
AI In Neurology Operating Room Market Size 2025-2029
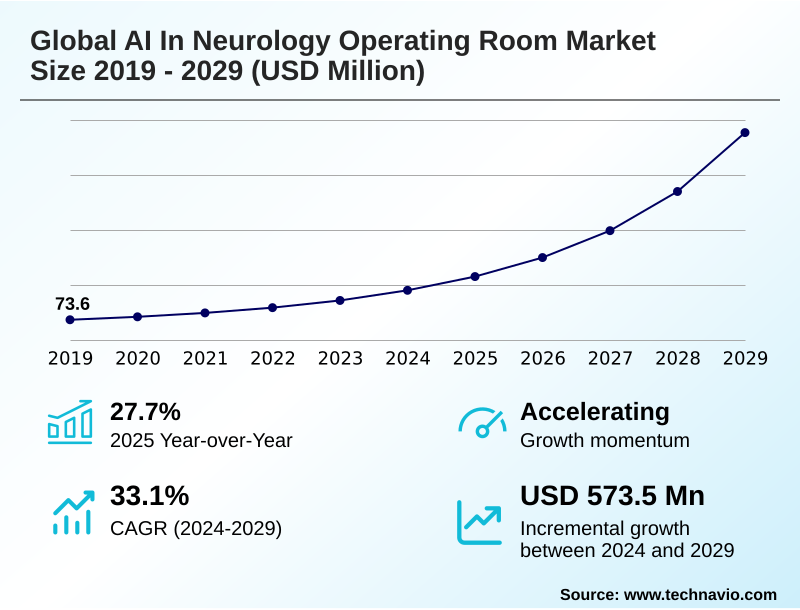
The ai in neurology operating room market size is valued to increase by USD 573.5 million, at a CAGR of 33.1% from 2024 to 2029. Increasing prevalence of neurological disorders will drive the ai in neurology operating room market.
Major Market Trends & Insights
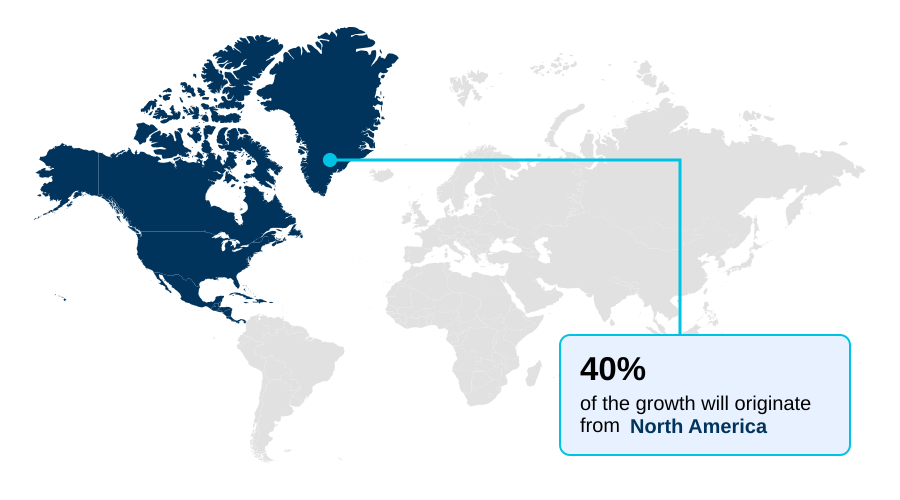
- North America dominated the market and accounted for a 39.6% growth during the forecast period.
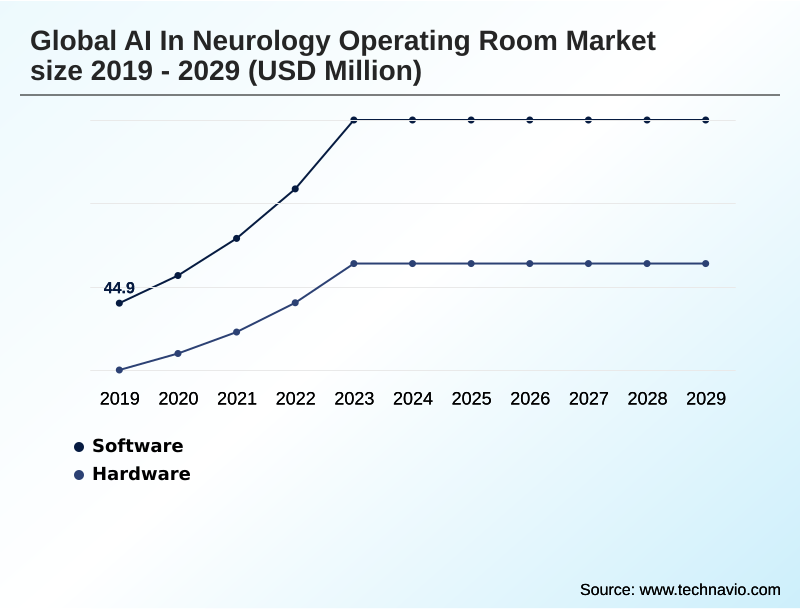
- By Component - Software segment was valued at USD 89.3 million in 2023
- By Technology - Deep learning segment accounted for the largest market revenue share in 2023
Market Size & Forecast
- Market Opportunities: USD 680.6 million
- Market Future Opportunities: USD 573.5 million
- CAGR from 2024 to 2029 : 33.1%
Market Summary
- The AI in neurology operating room market is defined by the application of advanced computational technologies to enhance surgical precision and patient outcomes. Core to this market is the use of machine learning in neurology and sophisticated AI algorithms for neurovascular care, which analyze complex datasets from sources like intraoperative MRI and EEG data analysis to provide real-time decision support.
- A key trend is the integration of AI with robotic neurosurgery platforms, enabling minimally invasive procedures with unparalleled accuracy. For instance, in a typical business scenario, a hospital implements an AI-powered surgical planning tool that processes preoperative scans, creating a detailed 3D brain modeling of the patient’s unique anatomy.
- This allows surgeons to simulate procedures, identify risks, and optimize the surgical path, reducing operating time and improving safety. This shift toward personalized neurosurgical planning and intelligent surgical guidance systems is driven by the need for better outcomes in treating complex conditions.
- However, the high cost of AI-integrated robotics and challenges related to data security and regulatory compliance persist, shaping the strategic decisions of healthcare providers and technology developers alike.
What will be the Size of the AI In Neurology Operating Room Market during the forecast period?
Get Key Insights on Market Forecast (PDF) Get Free Sample
How is the AI In Neurology Operating Room Market Segmented?
The ai in neurology operating room industry research report provides comprehensive data (region-wise segment analysis), with forecasts and estimates in "USD million" for the period 2025-2029, as well as historical data from 2019-2023 for the following segments.
- Component
- Software
- Hardware
- Technology
- Deep learning
- Machine learning
- Computer vision
- Others
- End-user
- Hospitals
- Ambulatory surgical centers
- Others
- Geography
- North America
- US
- Canada
- Mexico
- Europe
- Germany
- UK
- France
- APAC
- China
- Japan
- India
- Middle East and Africa
- Saudi Arabia
- UAE
- Israel
- South America
- Brazil
- Argentina
- Colombia
- Rest of World (ROW)
- North America
By Component Insights
The software segment is estimated to witness significant growth during the forecast period.
The software segment is the intellectual core of the AI in neurology operating room market, comprising a diverse range of AI-powered applications.
These systems leverage deep learning models and sophisticated computer vision algorithms for critical tasks from preoperative planning to intraoperative guidance.
Key functionalities include automated tumor segmentation, AI-driven diagnostic tools for identifying critical neural pathways, and predictive analytics that forecast surgical outcomes.
The adoption of these platforms is driven by the need for enhanced precision, with some systems demonstrating up to a 15% improvement in the accuracy of lesion boundary detection over traditional methods.
The evolution toward cloud-based AI platforms and augmented reality overlays is expanding capabilities in neurosurgical navigation systems, making intelligent surgical guidance a standard of care.
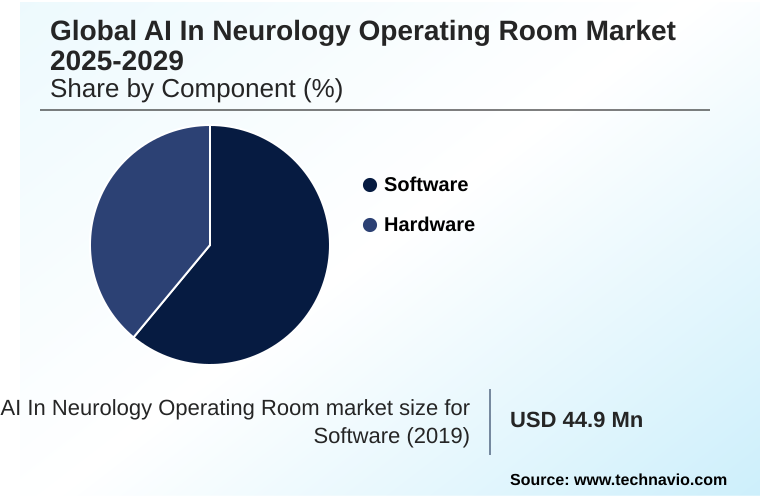
The Software segment was valued at USD 89.3 million in 2023 and showed a gradual increase during the forecast period.
Regional Analysis
North America is estimated to contribute 39.6% to the growth of the global market during the forecast period.Technavio’s analysts have elaborately explained the regional trends and drivers that shape the market during the forecast period.
See How AI In Neurology Operating Room Market Demand is Rising in North America Get Free Sample
The geographic landscape of the market is led by North America, which accounts for over 39% of the market's incremental growth, driven by its advanced healthcare infrastructure and high adoption rates of cutting-edge technology.
The region's leadership is supported by significant investment in AI research and the presence of key technology developers.
Hospitals in the United States and Canada are increasingly implementing robotic-assisted surgery platforms integrated with AI-powered diagnostic tools, which can reduce certain intraoperative errors by up to 20%.
Europe follows, with countries like Germany and the UK fostering innovation through strong R&D ecosystems.
Meanwhile, the APAC region is emerging as a high-growth market, fueled by rising healthcare expenditure and government initiatives promoting digital health, particularly in China and Japan, which are rapidly advancing their neurosurgical data analytics capabilities.
Market Dynamics
Our researchers analyzed the data with 2024 as the base year, along with the key drivers, trends, and challenges. A holistic analysis of drivers will help companies refine their marketing strategies to gain a competitive advantage.
- The strategic implementation of advanced technologies is fundamentally reshaping neurosurgical practices. The focus is increasingly on improving AI-driven stroke thrombectomy outcomes, where real-time analysis can significantly influence patient recovery trajectories. Similarly, the use of deep learning for epilepsy surgery is enabling more precise identification of seizure foci, leading to more effective interventions.
- In oncology, achieving precision with real-time AI in brain tumor resection is a primary objective, as it helps maximize tumor removal while preserving healthy tissue. The role of robotic assistance for minimally invasive neurosurgery continues to expand, offering enhanced dexterity and stability. These systems are powered by AI algorithms for neurovascular care, which provide critical insights during delicate procedures.
- The integration of AI for personalized neurosurgery is becoming a standard, allowing treatment plans to be tailored to individual patient anatomy and pathology. Advanced machine learning for predicting neurosurgery success rates offers valuable prognostic information for both clinicians and patients, with some models showing a predictive accuracy improvement of over 15% compared to traditional statistical methods.
- The development of AI models for intraoperative risk assessment provides an added layer of safety, alerting surgical teams to potential complications before they escalate. Furthermore, explainable AI in surgical decision support is crucial for building clinician trust and facilitating adoption by making the technology's recommendations transparent and understandable.
What are the key market drivers leading to the rise in the adoption of AI In Neurology Operating Room Industry?
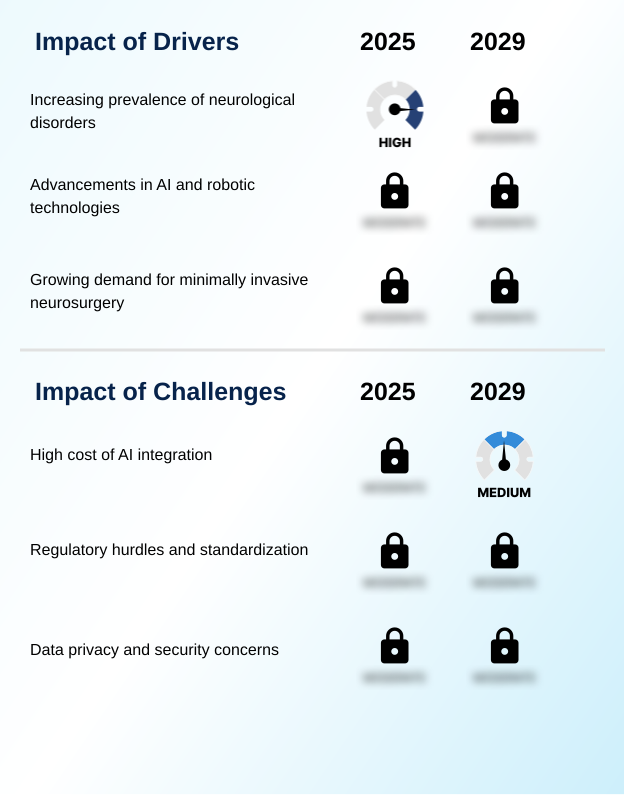
- The market's growth is primarily driven by the increasing global prevalence of complex neurological disorders, which necessitates more advanced and precise surgical interventions.
- Market growth is fueled by several key drivers, primarily the increasing prevalence of neurological disorders, which demands more effective interventions. Significant advancements in AI and robotic technologies provide the tools to meet this need.
- The evolution of machine learning in neurology has led to systems that can analyze complex medical images with 30% greater speed than manual methods. This capability is crucial for enhancing preoperative planning.
- The growing demand for minimally invasive neurosurgery is another powerful driver, as these techniques reduce patient trauma and shorten recovery times.
- AI for neurosurgery planning plays a critical role here, enabling surgeons to devise optimal, least-invasive surgical paths, thereby making complex procedures safer and more accessible.
What are the market trends shaping the AI In Neurology Operating Room Industry?
- A pivotal trend is the deepening integration of artificial intelligence with surgical robotics. This synergy is creating intelligent platforms that enhance neurosurgical precision and automate delicate maneuvers.
- Key trends are reshaping neurosurgical practice by combining advanced hardware with intelligent software. The integration of artificial intelligence with surgical robotics is paramount, creating platforms that leverage haptic feedback to enhance a surgeon's sense of touch during minimally invasive procedures. This synergy improves outcomes by enabling AI-powered surgical planning, which reduces procedure times by an average of 20%.
- Personalized neurosurgical planning is another major trend, where AI algorithms create patient-specific strategies, improving the accuracy of interventions by up to 15%. Furthermore, real-time intraoperative AI guidance and decision support, utilizing technologies like AI-enhanced imaging analysis, provide immediate insights, enhancing safety and precision during complex operations.
- This convergence is driving the adoption of sophisticated robotic neurosurgery platforms across leading medical centers.
What challenges does the AI In Neurology Operating Room Industry face during its growth?
- A key challenge restraining market expansion is the high capital investment and operational costs associated with integrating advanced AI systems into neurosurgical workflows.
- Despite strong growth drivers, the market faces significant challenges. The high cost of AI integration is a primary barrier, with the initial capital outlay for AI-integrated robotics and supporting infrastructure limiting adoption, especially in smaller facilities.
- Navigating complex regulatory hurdles and the lack of standardization also presents a major challenge, as varying approval processes across regions can delay market entry for new technologies by up to 18 months. Furthermore, data privacy and security concerns are paramount, given the sensitive nature of neurological data.
- Ensuring compliance with stringent regulations requires robust cybersecurity measures, which adds to the operational complexity and cost of implementing AI solutions in the neurology operating room.
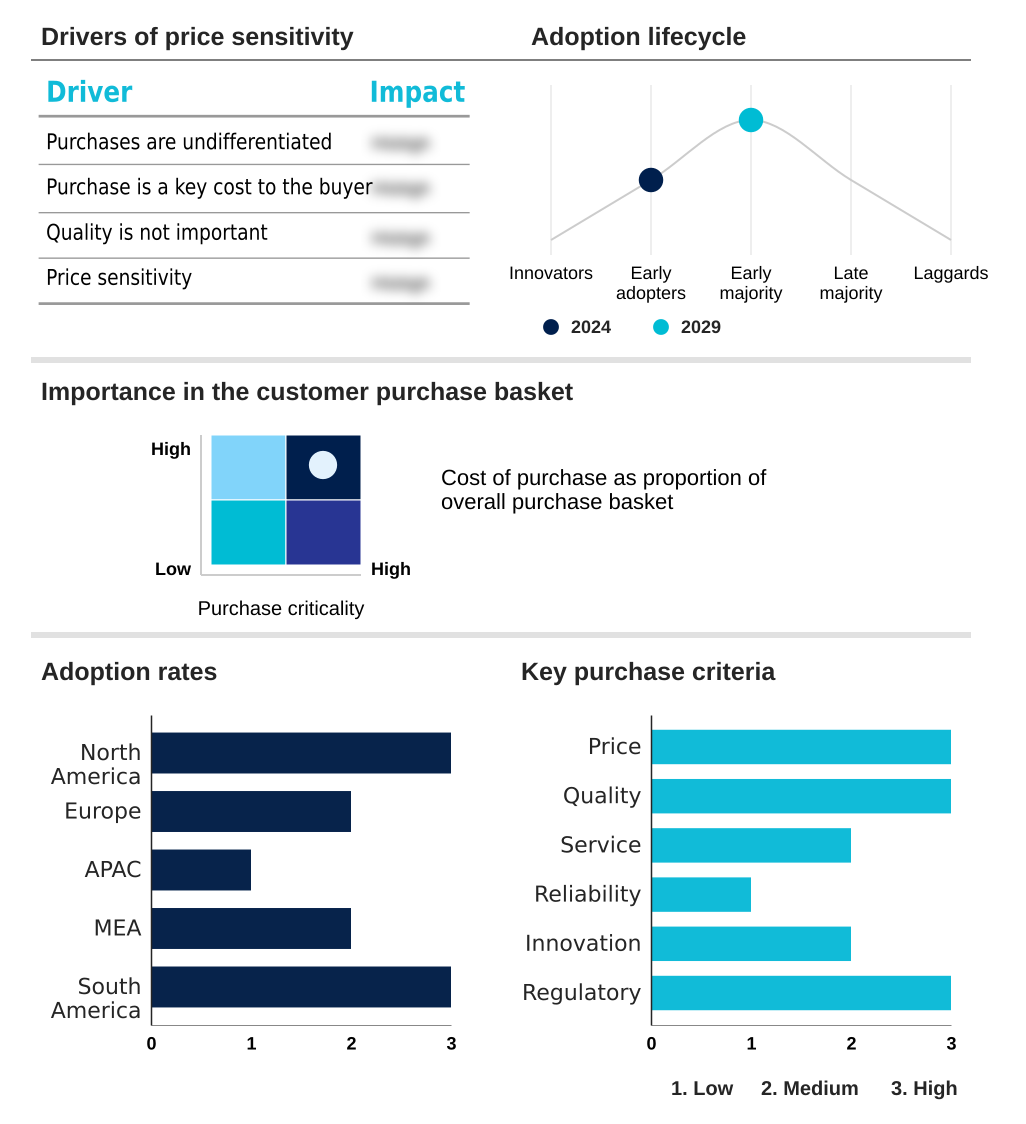
Exclusive Technavio Analysis on Customer Landscape
The ai in neurology operating room market forecasting report includes the adoption lifecycle of the market, covering from the innovator’s stage to the laggard’s stage. It focuses on adoption rates in different regions based on penetration. Furthermore, the ai in neurology operating room market report also includes key purchase criteria and drivers of price sensitivity to help companies evaluate and develop their market growth analysis strategies.
Customer Landscape of AI In Neurology Operating Room Industry
Competitive Landscape
Companies are implementing various strategies, such as strategic alliances, ai in neurology operating room market forecast, partnerships, mergers and acquisitions, geographical expansion, and product/service launches, to enhance their presence in the industry.
Activ Surgical Inc. - Advanced AR-based intraoperative intelligence platforms are enabling real-time tissue assessment, significantly enhancing precision during complex neurosurgical procedures.
The industry research and growth report includes detailed analyses of the competitive landscape of the market and information about key companies, including:
- Activ Surgical Inc.
- Aidoc Medical Ltd.
- Asensus Surgical US Inc.
- Augmedics
- Brainlab AG
- Brainomix Ltd.
- Caresyntax GmbH
- GE Healthcare Technologies
- Globus Medical Inc.
- Intuitive Surgical Inc.
- Johnson and Johnson Services
- KARL STORZ SE and Co. KG
- Medtronic Plc
- Olympus Corp.
- Proximie Ltd.
- Siemens Healthineers AG
- Stryker Corp.
- Viz.ai Inc.
Qualitative and quantitative analysis of companies has been conducted to help clients understand the wider business environment as well as the strengths and weaknesses of key industry players. Data is qualitatively analyzed to categorize companies as pure play, category-focused, industry-focused, and diversified; it is quantitatively analyzed to categorize companies as dominant, leading, strong, tentative, and weak.
Recent Development and News in Ai in neurology operating room market
- In September 2024, Brainlab AG announced the European launch of its latest AI-powered surgical planning suite, featuring enhanced 3D modeling and automated tissue segmentation for complex cranial procedures.
- In November 2024, Viz.ai Inc. received FDA clearance for its new AI algorithm designed for the early detection of small, unruptured intracranial aneurysms from standard CT angiography.
- In January 2025, Medtronic Plc and Siemens Healthineers AG formed a strategic partnership to integrate Medtronic's neurosurgical navigation systems with Siemens' advanced intraoperative imaging platforms, enabled by a shared AI data framework.
- In April 2025, Augmedics secured $150 million in Series D funding to accelerate the development and commercialization of its next-generation augmented reality surgical guidance system for spine and neurosurgery.
Dive into Technavio’s robust research methodology, blending expert interviews, extensive data synthesis, and validated models for unparalleled AI In Neurology Operating Room Market insights. See full methodology.
| Market Scope | |
|---|---|
| Page number | 295 |
| Base year | 2024 |
| Historic period | 2019-2023 |
| Forecast period | 2025-2029 |
| Growth momentum & CAGR | Accelerate at a CAGR of 33.1% |
| Market growth 2025-2029 | USD 573.5 million |
| Market structure | Fragmented |
| YoY growth 2024-2025(%) | 27.7% |
| Key countries | US, Canada, Mexico, Germany, UK, France, Italy, Spain, The Netherlands, China, Japan, India, South Korea, Australia, Indonesia, Saudi Arabia, UAE, Israel, South Africa, Turkey, Brazil, Argentina and Colombia |
| Competitive landscape | Leading Companies, Market Positioning of Companies, Competitive Strategies, and Industry Risks |
Research Analyst Overview
- The market's evolution is centered on the convergence of sophisticated AI algorithms and advanced surgical hardware. At the core, deep learning models and computer vision algorithms are transforming medical imaging, enabling automated tumor segmentation and precise 3D brain modeling. These AI-powered diagnostic tools are integrated into neurosurgical navigation systems, providing surgeons with augmented reality overlays for enhanced visualization during procedures.
- The synergy with robotic-assisted surgery platforms, guided by AI for real-time tissue characterization and haptic feedback, is facilitating unprecedented levels of precision. This integration is critical for boardroom decisions, as the adoption of such systems requires significant capital budgeting but promises substantial returns through improved efficiency, such as a documented 25% reduction in surgical planning time.
- The use of intraoperative MRI and EEG data analysis fuels machine learning algorithms, which refine intelligent surgical guidance and support personalized neurosurgical planning. This data-centric approach, which leverages neurosurgical data analytics, is fundamental to advancing AI-enhanced imaging analysis and robotic neurosurgery platforms, ultimately setting new standards for care with AI-integrated robotics and AI-powered surgical planning.
What are the Key Data Covered in this AI In Neurology Operating Room Market Research and Growth Report?
-
What is the expected growth of the AI In Neurology Operating Room Market between 2025 and 2029?
-
USD 573.5 million, at a CAGR of 33.1%
-
-
What segmentation does the market report cover?
-
The report is segmented by Component (Software, Hardware), Technology (Deep learning, Machine learning, Computer vision, Others), End-user (Hospitals, Ambulatory surgical centers, Others) and Geography (North America, Europe, APAC, Middle East and Africa, South America)
-
-
Which regions are analyzed in the report?
-
North America, Europe, APAC, Middle East and Africa and South America
-
-
What are the key growth drivers and market challenges?
-
Increasing prevalence of neurological disorders, High cost of AI integration
-
-
Who are the major players in the AI In Neurology Operating Room Market?
-
Activ Surgical Inc., Aidoc Medical Ltd., Asensus Surgical US Inc., Augmedics, Brainlab AG, Brainomix Ltd., Caresyntax GmbH, GE Healthcare Technologies, Globus Medical Inc., Intuitive Surgical Inc., Johnson and Johnson Services, KARL STORZ SE and Co. KG, Medtronic Plc, Olympus Corp., Proximie Ltd., Siemens Healthineers AG, Stryker Corp. and Viz.ai Inc.
-
Market Research Insights
- The market dynamics are shaped by the drive for greater efficiency and precision in neurosurgery. The adoption of AI for neurosurgery planning is accelerating, with institutions reporting up to a 30% reduction in preoperative preparation time. These systems utilize intelligent surgical guidance to analyze medical images, offering surgeons enhanced visualization and accuracy.
- The integration of neurosurgical data analytics enables continuous performance improvement, with some platforms demonstrating a 15% increase in the accuracy of identifying critical neural structures compared to manual methods. This focus on data-driven decision-making, supported by AI-enhanced imaging analysis and robotic neurosurgery platforms, is becoming a key differentiator.
- Advanced AI tools not only improve surgical outcomes but also optimize resource utilization, delivering a measurable return on investment for healthcare providers.
We can help! Our analysts can customize this ai in neurology operating room market research report to meet your requirements.
 RIA -
RIA - 
