
AI In Pulp And Paper Industry Market Size 2025-2029
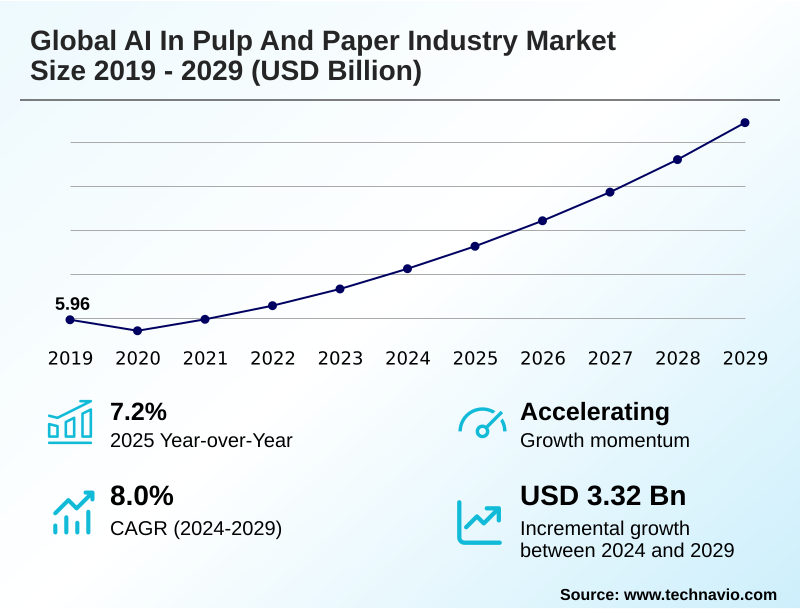
The ai in pulp and paper industry market size is valued to increase by USD 3.32 billion, at a CAGR of 8% from 2024 to 2029. Imperative for enhanced operational efficiency and cost reduction will drive the ai in pulp and paper industry market.
Major Market Trends & Insights
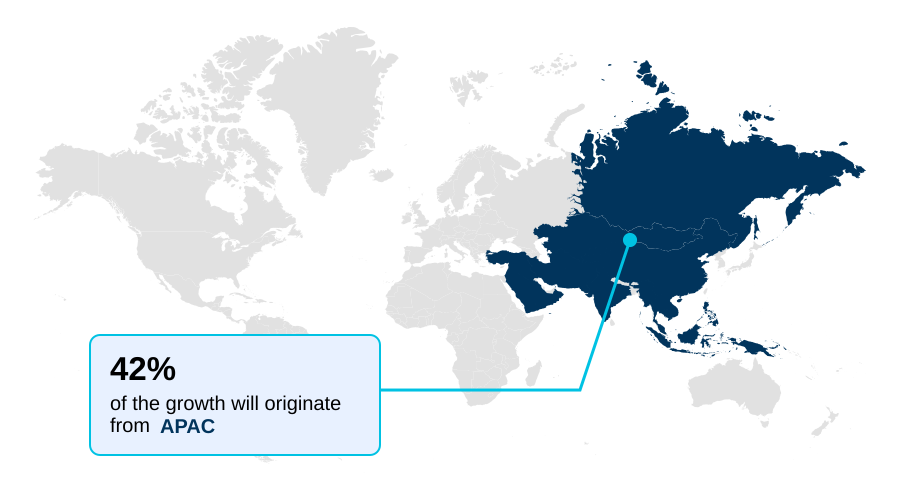
- APAC dominated the market and accounted for a 41.6% growth during the forecast period.
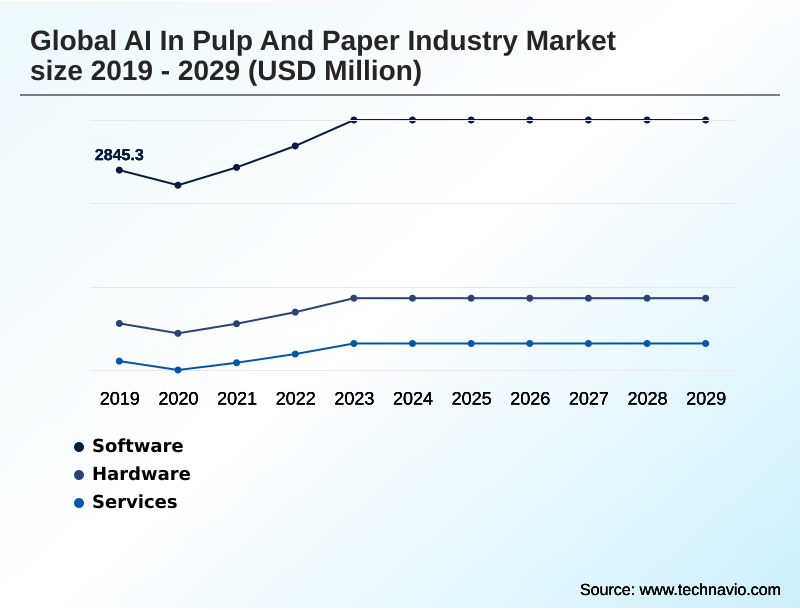
- By Component - Software segment was valued at USD 3.22 billion in 2023
- By Application - Process optimization segment accounted for the largest market revenue share in 2023
Market Size & Forecast
- Market Opportunities: USD 4.47 billion
- Market Future Opportunities: USD 3.32 billion
- CAGR from 2024 to 2029 : 8%
Market Summary
- The AI in pulp and paper industry is undergoing a significant transformation, driven by the need to boost efficiency, meet sustainability mandates, and reduce operational costs. This shift involves embedding intelligence across the value chain, utilizing process optimization algorithms to refine complex manufacturing workflows and predictive maintenance models to minimize costly downtime.
- A core focus is on data-driven decision making, where insights from operational technology (OT) integration improve asset performance. For example, a mill can deploy AI-powered visual inspection to automate real-time quality control, immediately identifying defects on the production line. This not only cuts waste but also ensures environmental compliance monitoring by optimizing resource use.
- However, challenges such as legacy system modernization and a persistent skills gap temper the pace of adoption. As the industry advances, the focus remains on leveraging AI in resource management to create smarter, more resilient, and sustainable operations. This includes everything from chemical dosage automation to comprehensive smart factory implementation, ultimately enabling a more competitive and eco-friendly manufacturing paradigm.
What will be the Size of the AI In Pulp And Paper Industry Market during the forecast period?
Get Key Insights on Market Forecast (PDF) Get Free Sample
How is the AI In Pulp And Paper Industry Market Segmented?
The ai in pulp and paper industry industry research report provides comprehensive data (region-wise segment analysis), with forecasts and estimates in "USD million" for the period 2025-2029, as well as historical data from 2019-2023 for the following segments.
- Component
- Software
- Hardware
- Services
- Application
- Process optimization
- Quality control
- Predictive maintenance
- Supply chain management
- Others
- End-user
- Paper manufacturers
- Pulp producers
- Packaging industry
- Geography
- APAC
- China
- Japan
- South Korea
- North America
- US
- Canada
- Europe
- Germany
- France
- Middle East and Africa
- South Africa
- Saudi Arabia
- South America
- Brazil
- Argentina
- Rest of World (ROW)
- APAC
By Component Insights
The software segment is estimated to witness significant growth during the forecast period.
The software segment is pivotal for AI in pulp and paper manufacturing, providing a range of solutions that drive operational intelligence. Companies leverage machine learning for pulp to refine production and implement advanced sensor analytics for real-time quality control.
The integration of the industrial internet of things (IIoT) facilitates supply chain automation and enables sophisticated predictive maintenance models.
Through ai for paper manufacturing, mills are transitioning toward smart pulp production and intelligent mill operations, utilizing process optimization algorithms to enhance automated paper quality.
These platforms are foundational to forestry ai applications, with some achieving cost reductions of up to 15%. This shift, supported by iiot in paper mills, is reshaping manufacturing from raw material input to final product delivery.
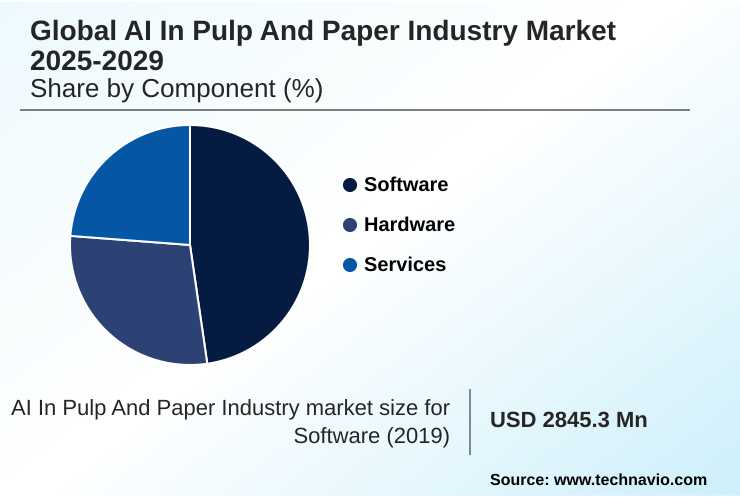
The Software segment was valued at USD 3.22 billion in 2023 and showed a gradual increase during the forecast period.
Regional Analysis
APAC is estimated to contribute 41.6% to the growth of the global market during the forecast period.Technavio’s analysts have elaborately explained the regional trends and drivers that shape the market during the forecast period.
See How AI In Pulp And Paper Industry Market Demand is Rising in APAC Get Free Sample
The global landscape is defined by distinct regional dynamics. Europe's market dominance, accounting for over 30% of market share, is driven by stringent regulations fostering advancements in ai-assisted engineering and generative ai in manufacturing for sustainable production.
In contrast, the APAC region is the epicenter of growth, contributing over 41% of the market's incremental expansion, fueled by industrialization and the adoption of technologies for production line optimization and raw material optimization.
North America focuses on modernizing existing infrastructure, deploying ai-based soft sensors and solutions for predictive asset health to enhance competitiveness.
Across all regions, the move toward an autonomous paper mill is a shared goal, with remote monitoring solutions and data-driven forestry management improving both efficiency and ai for workforce safety.
The focus on wet-end chemistry control and precise paper defect classification through real-time data processing is a universal trend.
Market Dynamics
Our researchers analyzed the data with 2024 as the base year, along with the key drivers, trends, and challenges. A holistic analysis of drivers will help companies refine their marketing strategies to gain a competitive advantage.
- The strategic deployment of artificial intelligence is reshaping the industrial landscape, with the benefits of iiot integration in paper manufacturing becoming increasingly evident. Companies are leveraging specific ai applications for process optimization in pulp mills to enhance throughput and reduce resource consumption.
- Central to this transformation are machine learning models for predictive maintenance, which are critical for minimizing costly unplanned downtime. In parallel, firms are using ai to improve paper quality control, primarily through automating defect detection with computer vision, a technique that has proven to be more than twice as effective as manual inspection in certain applications.
- The impact of ai on supply chain management is equally profound, enabling more accurate ai for demand forecasting in paper products and creating more resilient logistics networks. Beyond core production, ai strategies for energy reduction in mills and methods for optimizing chemical usage with ai algorithms are helping companies meet sustainability goals.
- While the challenges of integrating ai with legacy systems remain, the potential for innovation is expanding. Generative ai use cases in paper packaging are accelerating design cycles, and ai-based solutions for water management are addressing critical environmental concerns.
- Furthermore, the role of ai in workforce safety and training is creating safer and more efficient work environments, while real-time monitoring with ai-powered sensors provides unprecedented operational visibility. These advancements extend to ai applications in recycled paper processing and ai for optimizing biomass energy generation, demonstrating the technology's far-reaching impact.
What are the key market drivers leading to the rise in the adoption of AI In Pulp And Paper Industry Industry?
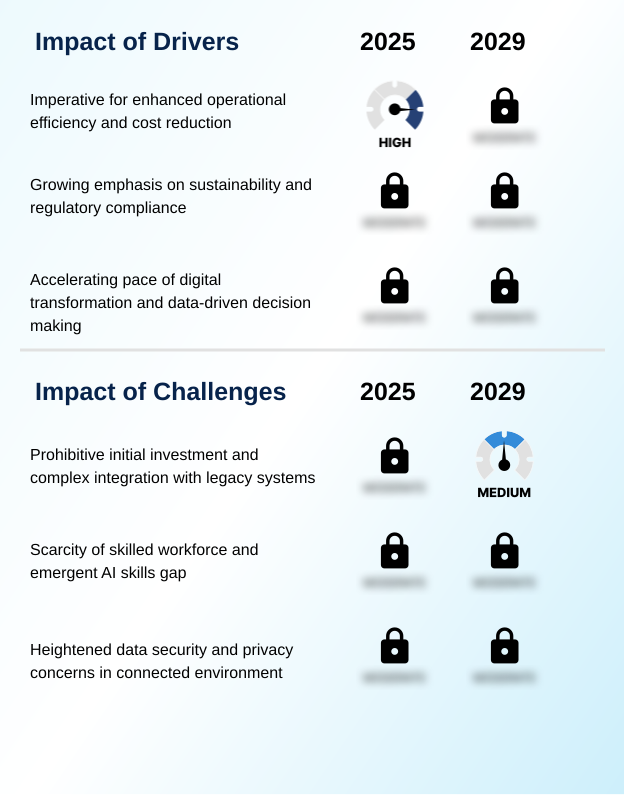
- The imperative for enhanced operational efficiency and cost reduction serves as a key driver for the market.
- The market is primarily driven by the imperative to enhance efficiency and sustainability. The deployment of AI for chemical dosage automation and pulp yield maximization directly addresses operational costs, with some mills increasing throughput by up to 10%.
- Enhanced paper machine efficiency is another critical driver, supported by AI-powered visual inspection for quality assurance.
- The push for stringent environmental compliance monitoring is accelerating the adoption of AI for waste reduction strategies, with certain applications reducing chemical inputs by 25%.
- This move toward intelligent manufacturing involves deep operational technology (ot) integration to enable predictive failure analysis and downtime reduction AI.
- Furthermore, the growth in ai in packaging production is creating demand for advanced solutions like automated sorting systems and AI for recycled fiber, while energy optimization ai remains a top priority across the industry.
What are the market trends shaping the AI In Pulp And Paper Industry Industry?
- A key market trend is the drive for enhanced efficiency and cost reduction, achieved primarily through the application of advanced process optimization techniques.
- Key market trends revolve around leveraging AI for comprehensive operational enhancements. The adoption of digital twin simulation is enabling mills to test and refine processes virtually, reducing waste and accelerating innovation. This complements the use of manufacturing execution systems (mes) and distributed control systems (dcs) for more cohesive ai-driven process control.
- A significant trend is the focus on sustainable paper production, with AI-powered energy consumption optimization and water usage reduction strategies becoming standard practice. Implementations have shown that predictive analytics can identify potential equipment failures up to six weeks in advance.
- Furthermore, automated defect detection is improving product quality, while advancements in pulp and paper analytics are central to the broader digital transformation in paper. These efforts toward operational efficiency ai are delivering tangible results, with some firms reporting cost reductions of nearly 15%.
What challenges does the AI In Pulp And Paper Industry Industry face during its growth?
- Prohibitive initial investment costs and the complexities of integrating with legacy systems present a key challenge affecting industry growth.
- Navigating the complexities of digital integration remains a central challenge. The high cost of legacy system modernization and ensuring seamless process control automation are significant hurdles. A widening skills gap is also a major concern; while 75% of companies are adopting AI, only 35% of the workforce has received relevant training.
- This affects everything from data-driven decision making to asset performance management. Furthermore, cybersecurity threats are escalating, with a 105% increase in attacks on industrial sectors, making ai in resource management and automated quality inspection systems potential targets.
- As mills move toward smart factory implementation, issues like supply chain visibility, process variable analysis, and optimizing ai in woodyard operations become more pronounced. These challenges also extend to specialized areas such as biomass cogeneration optimization and ensuring real-time process adjustments for ai for specialty papers.
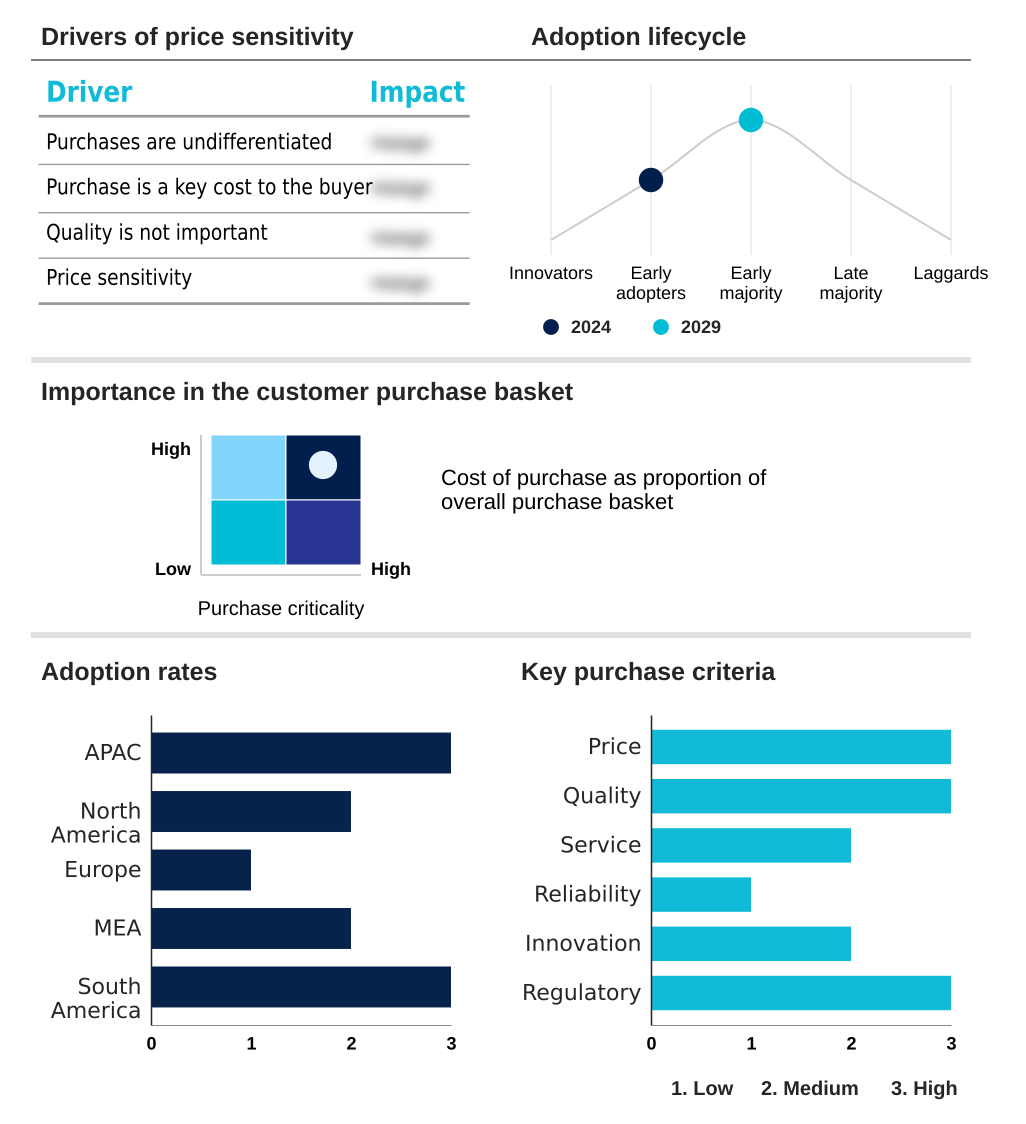
Exclusive Technavio Analysis on Customer Landscape
The ai in pulp and paper industry market forecasting report includes the adoption lifecycle of the market, covering from the innovator’s stage to the laggard’s stage. It focuses on adoption rates in different regions based on penetration. Furthermore, the ai in pulp and paper industry market report also includes key purchase criteria and drivers of price sensitivity to help companies evaluate and develop their market growth analysis strategies.
Customer Landscape of AI In Pulp And Paper Industry Industry
Competitive Landscape
Companies are implementing various strategies, such as strategic alliances, ai in pulp and paper industry market forecast, partnerships, mergers and acquisitions, geographical expansion, and product/service launches, to enhance their presence in the industry.
ABB Ltd. - Delivers an integrated AI platform designed to enhance process automation and operational intelligence across the pulp and paper value chain.
The industry research and growth report includes detailed analyses of the competitive landscape of the market and information about key companies, including:
- ABB Ltd.
- AFRY AB
- Andritz AG
- Aspen Technology Inc.
- AVEVA Group Plc
- Ecolab Inc.
- Emerson Electric Co.
- General Electric Co.
- Honeywell International Inc.
- Kadant Inc.
- Metso Outotec Corp.
- Rockwell Automation Inc.
- Schneider Electric SE
- Seeq
- Tietoevry
- Valmet Corp.
- Voith GmbH and Co. KGaA
- Yokogawa Electric Corp.
Qualitative and quantitative analysis of companies has been conducted to help clients understand the wider business environment as well as the strengths and weaknesses of key industry players. Data is qualitatively analyzed to categorize companies as pure play, category-focused, industry-focused, and diversified; it is quantitatively analyzed to categorize companies as dominant, leading, strong, tentative, and weak.
Recent Development and News in Ai in pulp and paper industry market
- In November 2024, Siemens highlighted its progress in digital twin technology at its Innovation Day, focusing on virtual simulation and process optimization for pulp and paper facilities.
- In January 2025, Natural Resources Canada initiated AI-driven projects to establish comprehensive big data platforms for the forest sector, aiming to improve forest inventories and advance sustainability practices.
- In early 2025, Valmet announced the launch of its next-generation DNAe automation system, which incorporates advanced AI capabilities to deliver significant operational value to its customers.
- In May 2025, Radix presented case studies demonstrating the use of AI and IIoT to identify operational bottlenecks and deploy scalable solutions for greater efficiency and sustainability in the pulp and paper industry.
Dive into Technavio’s robust research methodology, blending expert interviews, extensive data synthesis, and validated models for unparalleled AI In Pulp And Paper Industry Market insights. See full methodology.
| Market Scope | |
|---|---|
| Page number | 289 |
| Base year | 2024 |
| Historic period | 2019-2023 |
| Forecast period | 2025-2029 |
| Growth momentum & CAGR | Accelerate at a CAGR of 8% |
| Market growth 2025-2029 | USD 3318.5 million |
| Market structure | Fragmented |
| YoY growth 2024-2025(%) | 7.2% |
| Key countries | China, Japan, South Korea, India, US, Canada, Germany, Finland, Sweden, France, South Africa, Saudi Arabia, Brazil and Argentina |
| Competitive landscape | Leading Companies, Market Positioning of Companies, Competitive Strategies, and Industry Risks |
Research Analyst Overview
- The AI in pulp and paper industry is advancing beyond theoretical applications to become a core component of modern industrial strategy. The integration of manufacturing execution systems (mes) and distributed control systems (dcs) with ai-driven process control is enabling unprecedented levels of efficiency.
- Companies are deploying sophisticated process optimization algorithms and ai-based soft sensors to achieve pulp yield maximization and enhance paper machine efficiency. Concurrently, predictive maintenance models and systems for predictive asset health are critical for asset performance management and reducing costly interruptions.
- A key area of development is real-time quality control, where ai-powered visual inspection and automated defect detection are standardizing quality. In one application, a manufacturer achieved a 25% reduction in wet strength chemistry usage through real-time data processing and process variable analysis.
- This push for sustainability, driven by environmental compliance monitoring and goals for water usage reduction, is now a primary boardroom consideration, influencing long-term capital investments. The evolution toward smart factory implementation and production line optimization is further accelerated by generative ai in manufacturing and ai-assisted engineering, overcoming challenges related to operational technology (ot) integration and legacy system modernization.
- This is complemented by strategies for waste reduction and raw material optimization, creating a more resilient and profitable operational model.
What are the Key Data Covered in this AI In Pulp And Paper Industry Market Research and Growth Report?
-
What is the expected growth of the AI In Pulp And Paper Industry Market between 2025 and 2029?
-
USD 3.32 billion, at a CAGR of 8%
-
-
What segmentation does the market report cover?
-
The report is segmented by Component (Software, Hardware, Services), Application (Process optimization, Quality control, Predictive maintenance, Supply chain management, Others), End-user (Paper manufacturers, Pulp producers, Packaging industry) and Geography (APAC, North America, Europe, Middle East and Africa, South America)
-
-
Which regions are analyzed in the report?
-
APAC, North America, Europe, Middle East and Africa and South America
-
-
What are the key growth drivers and market challenges?
-
Imperative for enhanced operational efficiency and cost reduction, Prohibitive initial investment and complex integration with legacy systems
-
-
Who are the major players in the AI In Pulp And Paper Industry Market?
-
ABB Ltd., AFRY AB, Andritz AG, Aspen Technology Inc., AVEVA Group Plc, Ecolab Inc., Emerson Electric Co., General Electric Co., Honeywell International Inc., Kadant Inc., Metso Outotec Corp., Rockwell Automation Inc., Schneider Electric SE, Seeq, Tietoevry, Valmet Corp., Voith GmbH and Co. KGaA and Yokogawa Electric Corp.
-
Market Research Insights
- The market is rapidly advancing toward intelligent mill operations, where AI for paper manufacturing is central to achieving new levels of productivity. The adoption of smart pulp production techniques and iiIOT in paper mills facilitates predictive failure analysis, which has been shown to reduce unplanned downtime by over 30%.
- Through operational efficiency AI, companies achieve significant ai for cost reduction, with some reporting energy consumption decreases of 10%. Sustainable paper production is another key focus, advanced by energy optimization AI and better processing of ai for recycled fiber.
- This digital transformation in paper extends to forestry AI applications and automated sorting systems, enhancing supply chain visibility from raw material to finished product. The use of AI in packaging production and for downtime reduction AI is becoming standard, ensuring automated paper quality and more resilient operations.
We can help! Our analysts can customize this ai in pulp and paper industry market research report to meet your requirements.
 RIA -
RIA - 
