AI In Real Estate And Construction Market Analysis, Size, and Forecast 2025-2029: North America (US, Canada, and Mexico), Europe (Germany, UK, and France), APAC (China, Japan, and India), Middle East and Africa (Saudi Arabia, UAE, and South Africa), South America (Brazil, Argentina, and Colombia), and Rest of World (ROW)

AI In Real Estate And Construction Market Analysis, Size, and Forecast 2025-2029:
North America (US, Canada, and Mexico), Europe (Germany, UK, and France), APAC (China, Japan, and India), Middle East and Africa (Saudi Arabia, UAE, and South Africa), South America (Brazil, Argentina, and Colombia), and Rest of World (ROW)

Published: Dec 2025 295 Pages SKU: IRTNTR81112

Market Overview at a Glance

$15.10 B
Market Opportunity
29.1%
CAGR 2024 - 2029
36.1%
North America Growth
$3.27 B
Pre construction segment 2023

AI In Real Estate And Construction Market Size 2025-2029

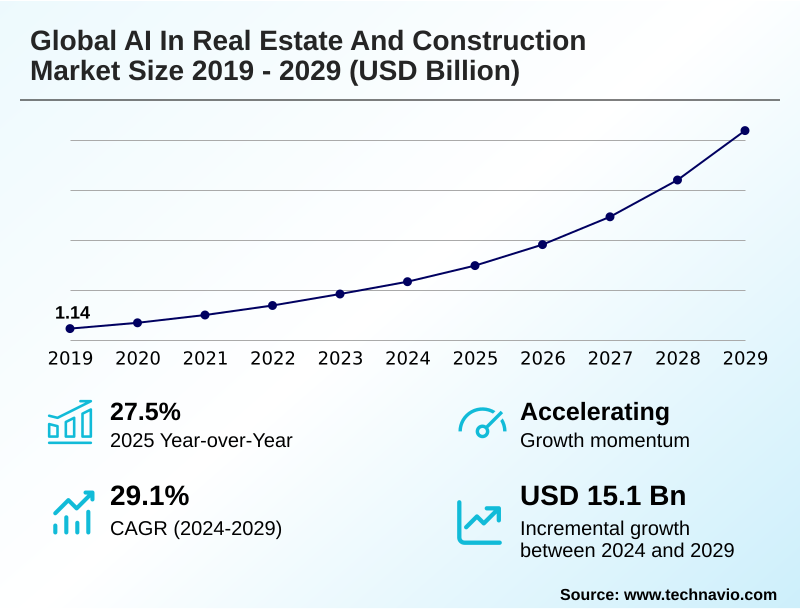
The ai in real estate and construction market size is valued to increase by USD 15.10 billion, at a CAGR of 29.1% from 2024 to 2029. Imperative for enhanced productivity and operational efficiency will drive the ai in real estate and construction market.

Major Market Trends & Insights

  • North America dominated the market and accounted for a 36.1% growth during the forecast period.
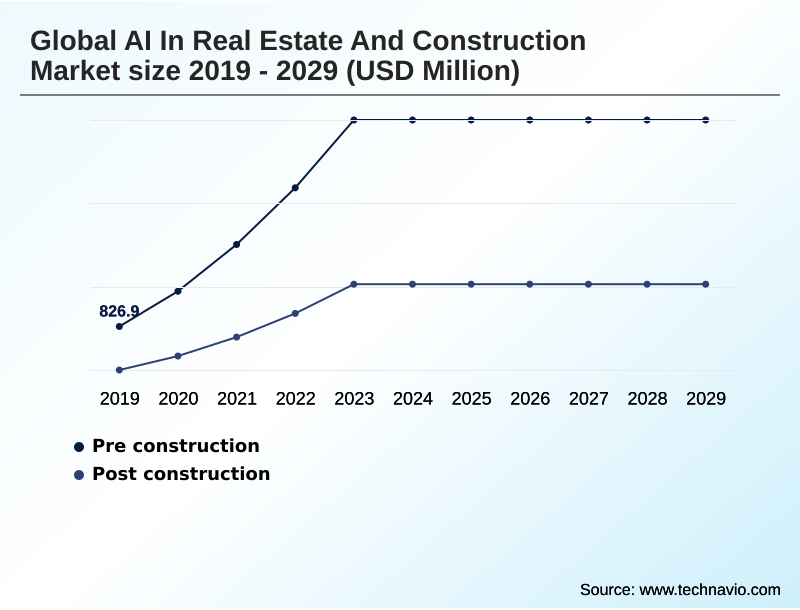
  • By Sector - Pre construction segment was valued at USD 3.27 billion in 2023
  • By Organization Size - Large enterprises segment accounted for the largest market revenue share in 2023

Market Size & Forecast

  • Market Opportunities: USD 19.80 billion
  • Market Future Opportunities: USD 15.10 billion
  • CAGR from 2024 to 2029 : 29.1%

Market Summary

  • The AI in real estate and construction market is defined by the deployment of intelligent technologies to address long-standing industry inefficiencies. This shift is driven by the need for enhanced productivity, the proliferation of data from sources like building information modeling (BIM), and increasing pressure for ESG compliance.
  • Key trends include the rise of generative design, where algorithms create optimized architectural plans, and the adoption of digital twin ecosystems for lifecycle asset management. AI-native platforms are central to this transformation, offering tools for predictive analytics and construction site automation.
  • For example, a major contractor can leverage an AI-driven project management platform using predictive maintenance algorithms to analyze real-time sensor data from heavy equipment, forecasting potential failures and scheduling maintenance during planned downtime. This proactive approach, which relies on point cloud data analysis and machine learning, minimizes costly on-site breakdowns and project delays.
  • However, challenges such as unstructured data extraction and the need for significant upfront investment without immediate ROI persist, tempering the pace of widespread adoption of technologies like AI-powered robotics.

What will be the Size of the AI In Real Estate And Construction Market during the forecast period?

Get Key Insights on Market Forecast (PDF) Request Free Sample

How is the AI In Real Estate And Construction Market Segmented?

The ai in real estate and construction industry research report provides comprehensive data (region-wise segment analysis), with forecasts and estimates in "USD million" for the period 2025-2029, as well as historical data from 2019-2023 for the following segments.

  • Sector
    • Pre construction
    • Post construction
  • Organization size
    • Large enterprises
    • SMEs
  • Technology
    • ML and DL
    • NLP
    • Generative AI
    • Computer vision
  • Geography
    • North America
      • US
      • Canada
      • Mexico
    • Europe
      • Germany
      • UK
      • France
    • APAC
      • China
      • Japan
      • India
    • Middle East and Africa
      • Saudi Arabia
      • UAE
      • South Africa
    • South America
      • Brazil
      • Argentina
      • Colombia
    • Rest of World (ROW)

By Sector Insights

The pre construction segment is estimated to witness significant growth during the forecast period.

The global AI in real estate and construction market 2025-2029 is segmented by sector, organization size, technology, and geography. The pre-construction phase, a critical segment, is being reshaped by AI-powered robotics.

Here, generative design and construction sequencing simulation are paramount, allowing firms to explore thousands of optimized architectural plans.

This proactive risk mitigation is enhanced by predictive cost estimation and automated quantity takeoffs, where machine learning models analyze historical data to forecast expenses with high accuracy.

For instance, AI-driven cost models have shown to improve bidding accuracy by over 15%.

This data-driven decision making helps in construction logistics planning and resource allocation modeling, transforming how projects are conceived and de-risked before any physical work begins, ensuring greater budget certainty and competitive-edge in capital project planning.

Request Free Sample

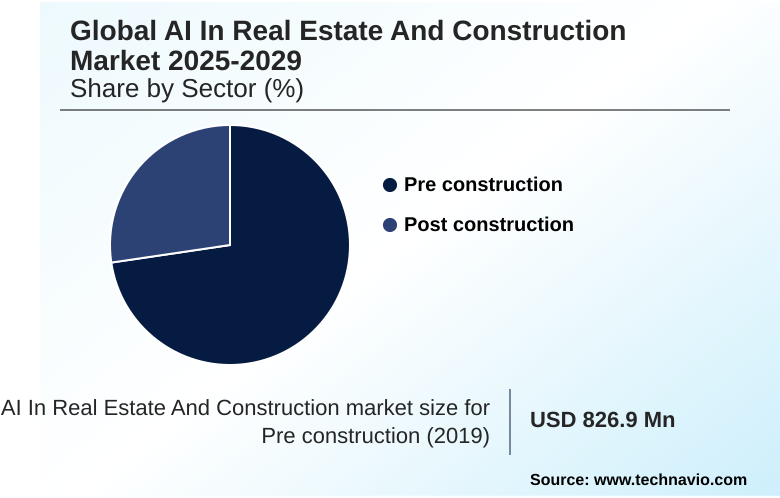
The Pre construction segment was valued at USD 3.27 billion in 2023 and showed a gradual increase during the forecast period.

Request Free Sample

Regional Analysis

North America is estimated to contribute 36.1% to the growth of the global market during the forecast period.Technavio’s analysts have elaborately explained the regional trends and drivers that shape the market during the forecast period.

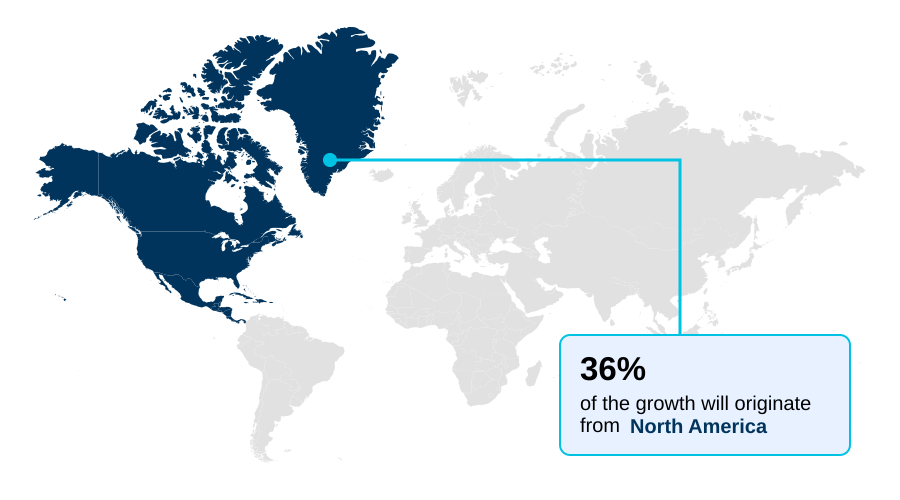
See How AI In Real Estate And Construction Market Demand is Rising in North America Request Free Sample

The geographic landscape of the AI in real estate and construction market is characterized by varied adoption rates and regional priorities.

North America leads, accounting for over 36% of incremental growth, driven by high labor costs and a mature technology ecosystem focused on predictive analytics. Europe emphasizes sustainability, using AI for ESG compliance reporting and to meet stringent green building standards.

The APAC region is the fastest-growing, with massive smart city initiatives and government mandates fueling the deployment of AI-powered robotics and smart building management. For instance, AI-driven progress tracking has improved schedule adherence by 25% on large infrastructure projects.

This global expansion highlights a shift towards AI-native platforms and construction site automation, with applications like automated valuation models becoming standard in developed real estate markets and reality capture technologies being deployed worldwide to create digital twins.

Market Dynamics

Our researchers analyzed the data with 2024 as the base year, along with the key drivers, trends, and challenges. A holistic analysis of drivers will help companies refine their marketing strategies to gain a competitive advantage.

  • The strategic evaluation of AI's role in the built environment increasingly centers on specific use cases and measurable outcomes. Stakeholders are assessing the impact of AI on construction project timelines, where automated progress tracking using drone imagery provides real-time visibility that is significantly more accurate than manual reporting.
  • In the design phase, the focus is on comparing generative design software for architectural planning, which can produce thousands of optimized iterations. Concurrently, the benefits of digital twins in facility management are becoming clear, especially when integrated with AI-powered predictive maintenance for heavy equipment, which reduces costly downtime.
  • On-site, computer vision for construction safety monitoring is a critical application, while the role of robotics in automating construction tasks addresses labor shortages. For investors, the ROI of AI in real estate asset management is paramount, with tools for AI-driven real estate investment analysis becoming indispensable.
  • Firms are leveraging natural language processing for contract analysis to mitigate legal risks and using AI to optimize building energy consumption. The future of autonomous construction vehicles and how AI improves construction supply chain logistics are key topics, alongside AI applications for property valuation accuracy.
  • Addressing the challenges of AI implementation in construction remains crucial for maximizing these benefits across the asset lifecycle. The move towards automating ESG reporting with AI platforms further underscores the technology's transformative potential.

What are the key market drivers leading to the rise in the adoption of AI In Real Estate And Construction Industry?

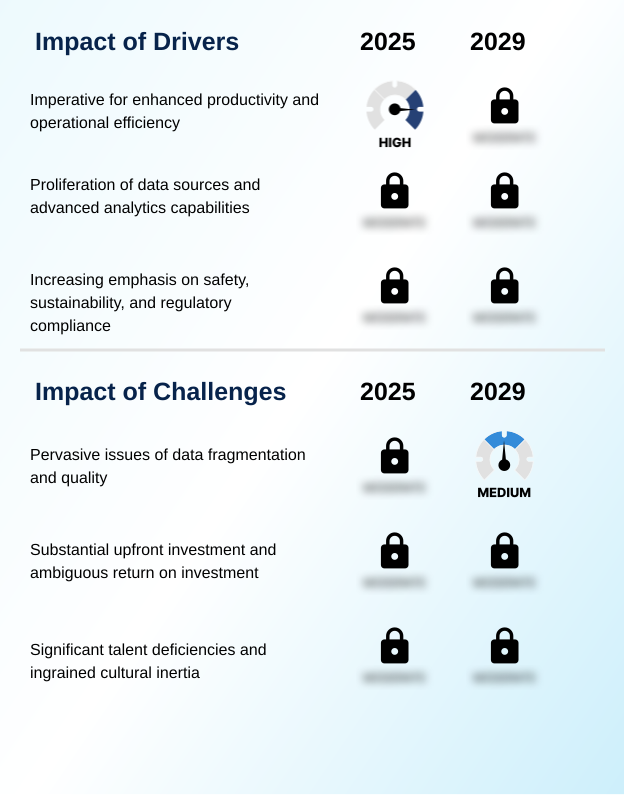
  • The imperative for enhanced productivity and operational efficiency across the real estate and construction sectors serves as a primary driver for market growth.

  • Market growth is primarily driven by the urgent need for operational efficiency and the increasing availability of high-quality data.
  • The imperative to overcome stagnant productivity fuels the adoption of AI-driven project management tools, which use predictive cost estimation and resource allocation modeling to improve outcomes. Firms utilizing these systems report up to a 20% improvement in budget adherence.
  • The proliferation of data from building information modeling (BIM), IoT sensors, and drone survey data analytics creates the necessary foundation for sophisticated machine learning. Furthermore, mounting pressure for enhanced ESG compliance reporting and site safety compliance is a significant catalyst.
  • AI-powered computer vision for on-site safety monitoring and energy consumption optimization systems help firms meet regulatory demands while also reducing operational costs by over 15%.

What are the market trends shaping the AI In Real Estate And Construction Industry?

  • A defining market trend is the rapid ascendancy of generative artificial intelligence and hyper-automation. This marks a significant evolutionary leap from predictive AI to creative and synthetic AI capabilities.

  • Key market trends are centered on the rapid advancement from predictive to synthetic AI capabilities, fundamentally altering project design and management. The rise of generative design and construction sequencing simulation allows firms to explore thousands of optimized project plans, accelerating conceptual phases by over 45%.
  • This is complemented by a strategic shift towards integrated digital twin ecosystems, which serve as a single source of truth for asset lifecycle management. These platforms leverage AI for real-time progress tracking and proactive risk mitigation. Simultaneously, the proliferation of AI-powered robotics and construction site automation is addressing labor shortages and enhancing safety.
  • Robotic systems for tasks like welding and bricklaying have shown a 3x improvement in speed over manual methods, reshaping on-site operations and driving operational efficiency gains.

What challenges does the AI In Real Estate And Construction Industry face during its growth?

  • Pervasive issues related to data fragmentation and poor data quality present a key challenge affecting industry growth.

  • Significant challenges hinder widespread AI adoption, primarily revolving around data, cost, and culture. The industry's notoriously fragmented data landscape, filled with unstructured formats, creates a major hurdle; data scientists report spending over 70% of their time on data cleansing rather than model development. This issue of unstructured data extraction complicates the use of predictive analytics.
  • The substantial upfront investment required for AI-native platforms and autonomous construction equipment, coupled with an often ambiguous immediate ROI, deters many firms, especially SMEs. A profound cultural inertia and a critical shortage of skilled talent, with salary demands for AI specialists increasing by nearly 25% in recent years, further constrain the market.
  • Overcoming these barriers is essential for unlocking the full potential of technologies like natural language processing and computer vision.

Exclusive Technavio Analysis on Customer Landscape

The ai in real estate and construction market forecasting report includes the adoption lifecycle of the market, covering from the innovator’s stage to the laggard’s stage. It focuses on adoption rates in different regions based on penetration. Furthermore, the ai in real estate and construction market report also includes key purchase criteria and drivers of price sensitivity to help companies evaluate and develop their market growth analysis strategies.

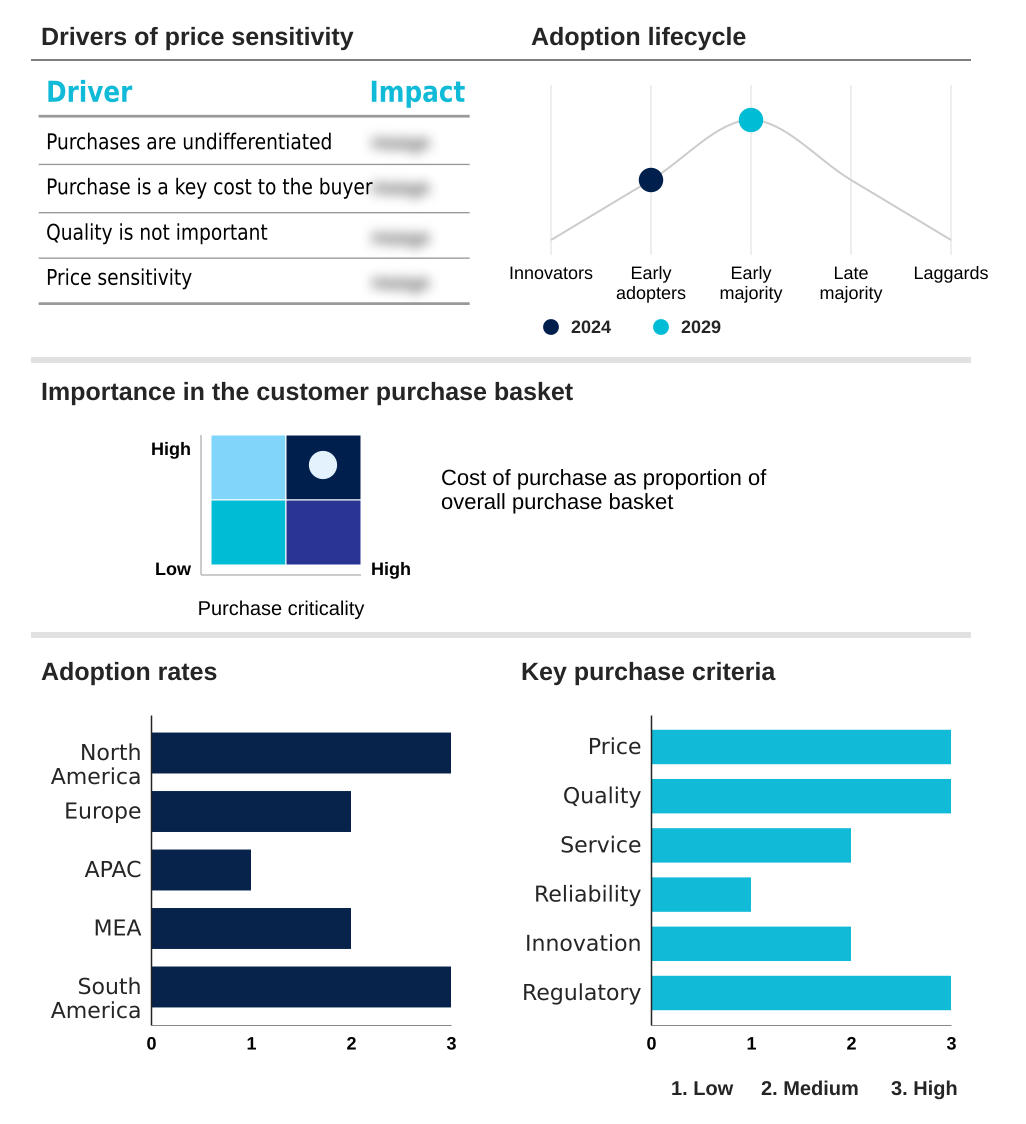
Customer Landscape of AI In Real Estate And Construction Industry

Competitive Landscape

Companies are implementing various strategies, such as strategic alliances, ai in real estate and construction market forecast, partnerships, mergers and acquisitions, geographical expansion, and product/service launches, to enhance their presence in the industry.

Acciona SA - Key offerings focus on integrated platforms that embed AI for predictive analytics, risk mitigation, and automated workflow intelligence across the entire asset lifecycle.

The industry research and growth report includes detailed analyses of the competitive landscape of the market and information about key companies, including:

  • Acciona SA
  • AECOM
  • AirWorks Solutions Inc.
  • Autodesk Inc.
  • Bentley Systems Inc.
  • Buildots Ltd
  • Dusty Robotics
  • Elise A.I. Technologies Corp.
  • Kwant
  • Laing O Rourke
  • Larsen and Toubro Ltd.
  • Magicbricks Realty Services Limited.
  • Matterport Inc.
  • Obayashi Corp.
  • Procore Technologies Inc.
  • Shimizu Corp.
  • Skanska AB
  • Trimble Inc.
  • Vinci

Qualitative and quantitative analysis of companies has been conducted to help clients understand the wider business environment as well as the strengths and weaknesses of key industry players. Data is qualitatively analyzed to categorize companies as pure play, category-focused, industry-focused, and diversified; it is quantitatively analyzed to categorize companies as dominant, leading, strong, tentative, and weak.

Recent Development and News in Ai in real estate and construction market

  • In September 2024, Arcol launched its AI-native building design and documentation platform, incorporating generative AI at its core to automate repetitive design tasks and offer intelligent suggestions for architects.
  • In November 2024, Buildots, an AI construction management company, announced a significant expansion of its operations in the United States, deploying its computer vision platform to provide fully digitized progress tracking on American construction sites.
  • In January 2025, Trimble Inc. introduced new AI-powered tools for its Construction One platform, designed to automatically analyze site data from reality capture technologies to track and validate work progress, enhancing project oversight.
  • In April 2025, BrainBox AI announced a strategic agreement with Trane Technologies to integrate its predictive and self-adapting artificial intelligence with Trane's commercial HVAC systems, aiming to embed autonomous AI for energy optimization in buildings.

Dive into Technavio’s robust research methodology, blending expert interviews, extensive data synthesis, and validated models for unparalleled AI In Real Estate And Construction Market insights. See full methodology.

Market Scope
Page number 295
Base year 2024
Historic period 2019-2023
Forecast period 2025-2029
Growth momentum & CAGR Accelerate at a CAGR of 29.1%
Market growth 2025-2029 USD 15101.0 million
Market structure Fragmented
YoY growth 2024-2025(%) 27.5%
Key countries US, Canada, Mexico, Germany, UK, France, Italy, Spain, The Netherlands, China, Japan, India, South Korea, Australia, Indonesia, Saudi Arabia, UAE, South Africa, Turkey, Israel, Brazil, Argentina and Colombia
Competitive landscape Leading Companies, Market Positioning of Companies, Competitive Strategies, and Industry Risks

Request Free Sample

Research Analyst Overview

  • The AI in real estate and construction market is transitioning from niche applications to foundational technology, fundamentally re-engineering industry workflows. This evolution is defined by the integration of technologies like generative design, predictive analytics, and computer vision into cohesive, AI-native platforms.
  • The development of digital twin ecosystems, powered by building information modeling and reality capture technologies, represents a critical boardroom-level strategic shift toward whole-lifecycle asset management. These dynamic virtual replicas enable sophisticated construction sequencing simulation and predictive maintenance algorithms, moving firms from reactive problem-solving to proactive optimization.
  • For instance, the deployment of AI-powered robotics and autonomous construction equipment, guided by point cloud data analysis, is addressing chronic labor shortages. Implementations of on-site safety monitoring through computer vision have demonstrated a 40% reduction in protocol violations.
  • The adoption of tools for unstructured data extraction and lease abstraction via natural language processing is automating back-office functions, solidifying AI's role as an indispensable tool for risk mitigation and operational excellence in both smart building management and construction site automation.

What are the Key Data Covered in this AI In Real Estate And Construction Market Research and Growth Report?

  • What is the expected growth of the AI In Real Estate And Construction Market between 2025 and 2029?

    • USD 15.10 billion, at a CAGR of 29.1%

  • What segmentation does the market report cover?

    • The report is segmented by Sector (Pre construction, and Post construction), Organization Size (Large enterprises, and SMEs), Technology (ML and DL, NLP, Generative AI, and Computer vision) and Geography (North America, Europe, APAC, Middle East and Africa, South America)

  • Which regions are analyzed in the report?

    • North America, Europe, APAC, Middle East and Africa and South America

  • What are the key growth drivers and market challenges?

    • Imperative for enhanced productivity and operational efficiency, Pervasive issues of data fragmentation and quality

  • Who are the major players in the AI In Real Estate And Construction Market?

    • Acciona SA, AECOM, AirWorks Solutions Inc., Autodesk Inc., Bentley Systems Inc., Buildots Ltd, Dusty Robotics, Elise A.I. Technologies Corp., Kwant, Laing O Rourke, Larsen and Toubro Ltd., Magicbricks Realty Services Limited., Matterport Inc., Obayashi Corp., Procore Technologies Inc., Shimizu Corp., Skanska AB, Trimble Inc. and Vinci

Market Research Insights

  • Market dynamics are shaped by the strategic adoption of AI to achieve measurable operational efficiency gains. The focus is on leveraging technologies for proactive risk mitigation and data-driven decision making, moving beyond reactive problem-solving. Implementations of automated defect detection systems have been shown to reduce rework costs by up to 30%, a critical factor in an industry with tight margins.
  • Furthermore, intelligent building management platforms utilizing energy consumption optimization algorithms can lower utility expenses by as much as 18%. This tangible ROI fuels the demand for solutions that provide workforce productivity analytics and enhance site safety compliance.
  • The ability to harness AI for subcontractor performance tracking and change order risk analysis is becoming a key competitive differentiator for firms aiming for superior project outcomes and improved profitability.

We can help! Our analysts can customize this ai in real estate and construction market research report to meet your requirements.

Get in touch

1. Executive Summary

1.1 Market overview

Executive Summary - Chart on Market Overview
Executive Summary - Data Table on Market Overview
Executive Summary - Chart on Global Market Characteristics
Executive Summary - Chart on Market by Geography
Executive Summary - Chart on Market Segmentation by Sector
Executive Summary - Chart on Market Segmentation by Organization Size
Executive Summary - Chart on Market Segmentation by Technology
Executive Summary - Chart on Incremental Growth
Executive Summary - Data Table on Incremental Growth
Executive Summary - Chart on Company Market Positioning

2. Technavio Analysis

2.1 Analysis of price sensitivity, lifecycle, customer purchase basket, adoption rates, and purchase criteria

2.2 Criticality of inputs and Factors of differentiation

Chart on Overview on criticality of inputs and factors of differentiation

2.3 Factors of disruption

Chart on Overview on factors of disruption

2.4 Impact of drivers and challenges

Chart on Impact of drivers and challenges in 2024 and 2029

3. Market Landscape

3.1 Market ecosystem

Chart on Parent Market
Data Table on - Parent Market

3.2 Market characteristics

Chart on Market characteristics analysis

3.3 Value chain analysis

Chart on Value chain analysis

4. Market Sizing

4.1 Market definition

Data Table on Offerings of companies included in the market definition

4.2 Market segment analysis

Market segments

4.3 Market size 2024

4.4 Market outlook: Forecast for 2024-2029

Chart on Global - Market size and forecast 2024-2029 ($ million)
Data Table on Global - Market size and forecast 2024-2029 ($ million)
Chart on Global Market: Year-over-year growth 2024-2029 (%)
Data Table on Global Market: Year-over-year growth 2024-2029 (%)

5. Historic Market Size

5.1 Global AI In Real Estate And Construction Market 2019 - 2023

Historic Market Size - Data Table on Global AI In Real Estate And Construction Market 2019 - 2023 ($ million)

5.2 Sector segment analysis 2019 - 2023

Historic Market Size - Sector Segment 2019 - 2023 ($ million)

5.3 Organization Size segment analysis 2019 - 2023

Historic Market Size - Organization Size Segment 2019 - 2023 ($ million)

5.4 Technology segment analysis 2019 - 2023

Historic Market Size - Technology Segment 2019 - 2023 ($ million)

5.5 Geography segment analysis 2019 - 2023

Historic Market Size - Geography Segment 2019 - 2023 ($ million)

5.6 Country segment analysis 2019 - 2023

Historic Market Size - Country Segment 2019 - 2023 ($ million)

6. Five Forces Analysis

6.1 Five forces summary

Five forces analysis - Comparison between 2024 and 2029

6.2 Bargaining power of buyers

Bargaining power of buyers - Impact of key factors 2024 and 2029

6.3 Bargaining power of suppliers

Bargaining power of suppliers - Impact of key factors in 2024 and 2029

6.4 Threat of new entrants

Threat of new entrants - Impact of key factors in 2024 and 2029

6.5 Threat of substitutes

Threat of substitutes - Impact of key factors in 2024 and 2029

6.6 Threat of rivalry

Threat of rivalry - Impact of key factors in 2024 and 2029

6.7 Market condition

Chart on Market condition - Five forces 2024 and 2029

7. Market Segmentation by Sector

7.1 Market segments

Chart on Sector - Market share 2024-2029 (%)
Data Table on Sector - Market share 2024-2029 (%)

7.2 Comparison by Sector

Chart on Comparison by Sector
Data Table on Comparison by Sector

7.3 Pre construction - Market size and forecast 2024-2029

Chart on Pre construction - Market size and forecast 2024-2029 ($ million)
Data Table on Pre construction - Market size and forecast 2024-2029 ($ million)
Chart on Pre construction - Year-over-year growth 2024-2029 (%)
Data Table on Pre construction - Year-over-year growth 2024-2029 (%)

7.4 Post construction - Market size and forecast 2024-2029

Chart on Post construction - Market size and forecast 2024-2029 ($ million)
Data Table on Post construction - Market size and forecast 2024-2029 ($ million)
Chart on Post construction - Year-over-year growth 2024-2029 (%)
Data Table on Post construction - Year-over-year growth 2024-2029 (%)

7.5 Market opportunity by Sector

Market opportunity by Sector ($ million)
Data Table on Market opportunity by Sector ($ million)

8. Market Segmentation by Organization Size

8.1 Market segments

Chart on Market Segmentation by Organization Size - Market share 2024-2029 (%)
Data Table on Market Segmentation by Organization Size - Market share 2024-2029 (%)

8.2 Comparison by Market Segmentation by Organization Size

Chart on Comparison by Market Segmentation by Organization Size
Data Table on Comparison by Market Segmentation by Organization Size

8.3 Large enterprises - Market size and forecast 2024-2029

Chart on Large enterprises - Market size and forecast 2024-2029 ($ million)
Data Table on Large enterprises - Market size and forecast 2024-2029 ($ million)
Chart on Large enterprises - Year-over-year growth 2024-2029 (%)
Data Table on Large enterprises - Year-over-year growth 2024-2029 (%)

8.4 SMEs - Market size and forecast 2024-2029

Chart on SMEs - Market size and forecast 2024-2029 ($ million)
Data Table on SMEs - Market size and forecast 2024-2029 ($ million)
Chart on SMEs - Year-over-year growth 2024-2029 (%)
Data Table on SMEs - Year-over-year growth 2024-2029 (%)

8.5 Market opportunity by Market Segmentation by Organization Size

Market opportunity by Market Segmentation by Organization Size ($ million)
Data Table on Market opportunity by Market Segmentation by Organization Size ($ million)

9. Market Segmentation by Technology

9.1 Market segments

Chart on Technology - Market share 2024-2029 (%)
Data Table on Technology - Market share 2024-2029 (%)

9.2 Comparison by Technology

Chart on Comparison by Technology
Data Table on Comparison by Technology

9.3 ML and DL - Market size and forecast 2024-2029

Chart on ML and DL - Market size and forecast 2024-2029 ($ million)
Data Table on ML and DL - Market size and forecast 2024-2029 ($ million)
Chart on ML and DL - Year-over-year growth 2024-2029 (%)
Data Table on ML and DL - Year-over-year growth 2024-2029 (%)

9.4 NLP - Market size and forecast 2024-2029

Chart on NLP - Market size and forecast 2024-2029 ($ million)
Data Table on NLP - Market size and forecast 2024-2029 ($ million)
Chart on NLP - Year-over-year growth 2024-2029 (%)
Data Table on NLP - Year-over-year growth 2024-2029 (%)

9.5 Generative AI - Market size and forecast 2024-2029

Chart on Generative AI - Market size and forecast 2024-2029 ($ million)
Data Table on Generative AI - Market size and forecast 2024-2029 ($ million)
Chart on Generative AI - Year-over-year growth 2024-2029 (%)
Data Table on Generative AI - Year-over-year growth 2024-2029 (%)

9.6 Computer vision - Market size and forecast 2024-2029

Chart on Computer vision - Market size and forecast 2024-2029 ($ million)
Data Table on Computer vision - Market size and forecast 2024-2029 ($ million)
Chart on Computer vision - Year-over-year growth 2024-2029 (%)
Data Table on Computer vision - Year-over-year growth 2024-2029 (%)

9.7 Market opportunity by Technology

Market opportunity by Technology ($ million)
Data Table on Market opportunity by Technology ($ million)

10. Customer Landscape

10.1 Customer landscape overview

Analysis of price sensitivity, lifecycle, customer purchase basket, adoption rates, and purchase criteria

11. Geographic Landscape

11.1 Geographic segmentation

Chart on Market share by geography 2024-2029 (%)
Data Table on Market share by geography 2024-2029 (%)

11.2 Geographic comparison

Chart on Geographic comparison
Data Table on Geographic comparison

11.3 North America - Market size and forecast 2024-2029

Chart on North America - Market size and forecast 2024-2029 ($ million)
Data Table on North America - Market size and forecast 2024-2029 ($ million)
Chart on North America - Year-over-year growth 2024-2029 (%)
Data Table on North America - Year-over-year growth 2024-2029 (%)
Chart on Regional Comparison - North America
Data Table on Regional Comparison - North America

11.3.1 US - Market size and forecast 2024-2029

Chart on US - Market size and forecast 2024-2029 ($ million)
Data Table on US - Market size and forecast 2024-2029 ($ million)
Chart on US - Year-over-year growth 2024-2029 (%)
Data Table on US - Year-over-year growth 2024-2029 (%)

11.3.2 Canada - Market size and forecast 2024-2029

Chart on Canada - Market size and forecast 2024-2029 ($ million)
Data Table on Canada - Market size and forecast 2024-2029 ($ million)
Chart on Canada - Year-over-year growth 2024-2029 (%)
Data Table on Canada - Year-over-year growth 2024-2029 (%)

11.3.3 Mexico - Market size and forecast 2024-2029

Chart on Mexico - Market size and forecast 2024-2029 ($ million)
Data Table on Mexico - Market size and forecast 2024-2029 ($ million)
Chart on Mexico - Year-over-year growth 2024-2029 (%)
Data Table on Mexico - Year-over-year growth 2024-2029 (%)

11.4 Europe - Market size and forecast 2024-2029

Chart on Europe - Market size and forecast 2024-2029 ($ million)
Data Table on Europe - Market size and forecast 2024-2029 ($ million)
Chart on Europe - Year-over-year growth 2024-2029 (%)
Data Table on Europe - Year-over-year growth 2024-2029 (%)
Chart on Regional Comparison - Europe
Data Table on Regional Comparison - Europe

11.4.1 Germany - Market size and forecast 2024-2029

Chart on Germany - Market size and forecast 2024-2029 ($ million)
Data Table on Germany - Market size and forecast 2024-2029 ($ million)
Chart on Germany - Year-over-year growth 2024-2029 (%)
Data Table on Germany - Year-over-year growth 2024-2029 (%)

11.4.2 UK - Market size and forecast 2024-2029

Chart on UK - Market size and forecast 2024-2029 ($ million)
Data Table on UK - Market size and forecast 2024-2029 ($ million)
Chart on UK - Year-over-year growth 2024-2029 (%)
Data Table on UK - Year-over-year growth 2024-2029 (%)

11.4.3 France - Market size and forecast 2024-2029

Chart on France - Market size and forecast 2024-2029 ($ million)
Data Table on France - Market size and forecast 2024-2029 ($ million)
Chart on France - Year-over-year growth 2024-2029 (%)
Data Table on France - Year-over-year growth 2024-2029 (%)

11.4.4 Italy - Market size and forecast 2024-2029

Chart on Italy - Market size and forecast 2024-2029 ($ million)
Data Table on Italy - Market size and forecast 2024-2029 ($ million)
Chart on Italy - Year-over-year growth 2024-2029 (%)
Data Table on Italy - Year-over-year growth 2024-2029 (%)

11.4.5 Spain - Market size and forecast 2024-2029

Chart on Spain - Market size and forecast 2024-2029 ($ million)
Data Table on Spain - Market size and forecast 2024-2029 ($ million)
Chart on Spain - Year-over-year growth 2024-2029 (%)
Data Table on Spain - Year-over-year growth 2024-2029 (%)

11.4.6 The Netherlands - Market size and forecast 2024-2029

Chart on The Netherlands - Market size and forecast 2024-2029 ($ million)
Data Table on The Netherlands - Market size and forecast 2024-2029 ($ million)
Chart on The Netherlands - Year-over-year growth 2024-2029 (%)
Data Table on The Netherlands - Year-over-year growth 2024-2029 (%)

11.5 APAC - Market size and forecast 2024-2029

Chart on APAC - Market size and forecast 2024-2029 ($ million)
Data Table on APAC - Market size and forecast 2024-2029 ($ million)
Chart on APAC - Year-over-year growth 2024-2029 (%)
Data Table on APAC - Year-over-year growth 2024-2029 (%)
Chart on Regional Comparison - APAC
Data Table on Regional Comparison - APAC

11.5.1 China - Market size and forecast 2024-2029

Chart on China - Market size and forecast 2024-2029 ($ million)
Data Table on China - Market size and forecast 2024-2029 ($ million)
Chart on China - Year-over-year growth 2024-2029 (%)
Data Table on China - Year-over-year growth 2024-2029 (%)

11.5.2 Japan - Market size and forecast 2024-2029

Chart on Japan - Market size and forecast 2024-2029 ($ million)
Data Table on Japan - Market size and forecast 2024-2029 ($ million)
Chart on Japan - Year-over-year growth 2024-2029 (%)
Data Table on Japan - Year-over-year growth 2024-2029 (%)

11.5.3 India - Market size and forecast 2024-2029

Chart on India - Market size and forecast 2024-2029 ($ million)
Data Table on India - Market size and forecast 2024-2029 ($ million)
Chart on India - Year-over-year growth 2024-2029 (%)
Data Table on India - Year-over-year growth 2024-2029 (%)

11.5.4 South Korea - Market size and forecast 2024-2029

Chart on South Korea - Market size and forecast 2024-2029 ($ million)
Data Table on South Korea - Market size and forecast 2024-2029 ($ million)
Chart on South Korea - Year-over-year growth 2024-2029 (%)
Data Table on South Korea - Year-over-year growth 2024-2029 (%)

11.5.5 Australia - Market size and forecast 2024-2029

Chart on Australia - Market size and forecast 2024-2029 ($ million)
Data Table on Australia - Market size and forecast 2024-2029 ($ million)
Chart on Australia - Year-over-year growth 2024-2029 (%)
Data Table on Australia - Year-over-year growth 2024-2029 (%)

11.5.6 Indonesia - Market size and forecast 2024-2029

Chart on Indonesia - Market size and forecast 2024-2029 ($ million)
Data Table on Indonesia - Market size and forecast 2024-2029 ($ million)
Chart on Indonesia - Year-over-year growth 2024-2029 (%)
Data Table on Indonesia - Year-over-year growth 2024-2029 (%)

11.6 Middle East and Africa - Market size and forecast 2024-2029

Chart on Middle East and Africa - Market size and forecast 2024-2029 ($ million)
Data Table on Middle East and Africa - Market size and forecast 2024-2029 ($ million)
Chart on Middle East and Africa - Year-over-year growth 2024-2029 (%)
Data Table on Middle East and Africa - Year-over-year growth 2024-2029 (%)
Chart on Regional Comparison - Middle East and Africa
Data Table on Regional Comparison - Middle East and Africa

11.6.1 Saudi Arabia - Market size and forecast 2024-2029

Chart on Saudi Arabia - Market size and forecast 2024-2029 ($ million)
Data Table on Saudi Arabia - Market size and forecast 2024-2029 ($ million)
Chart on Saudi Arabia - Year-over-year growth 2024-2029 (%)
Data Table on Saudi Arabia - Year-over-year growth 2024-2029 (%)

11.6.2 UAE - Market size and forecast 2024-2029

Chart on UAE - Market size and forecast 2024-2029 ($ million)
Data Table on UAE - Market size and forecast 2024-2029 ($ million)
Chart on UAE - Year-over-year growth 2024-2029 (%)
Data Table on UAE - Year-over-year growth 2024-2029 (%)

11.6.3 South Africa - Market size and forecast 2024-2029

Chart on South Africa - Market size and forecast 2024-2029 ($ million)
Data Table on South Africa - Market size and forecast 2024-2029 ($ million)
Chart on South Africa - Year-over-year growth 2024-2029 (%)
Data Table on South Africa - Year-over-year growth 2024-2029 (%)

11.6.4 Turkey - Market size and forecast 2024-2029

Chart on Turkey - Market size and forecast 2024-2029 ($ million)
Data Table on Turkey - Market size and forecast 2024-2029 ($ million)
Chart on Turkey - Year-over-year growth 2024-2029 (%)
Data Table on Turkey - Year-over-year growth 2024-2029 (%)

11.6.5 Israel - Market size and forecast 2024-2029

Chart on Israel - Market size and forecast 2024-2029 ($ million)
Data Table on Israel - Market size and forecast 2024-2029 ($ million)
Chart on Israel - Year-over-year growth 2024-2029 (%)
Data Table on Israel - Year-over-year growth 2024-2029 (%)

11.7 South America - Market size and forecast 2024-2029

Chart on South America - Market size and forecast 2024-2029 ($ million)
Data Table on South America - Market size and forecast 2024-2029 ($ million)
Chart on South America - Year-over-year growth 2024-2029 (%)
Data Table on South America - Year-over-year growth 2024-2029 (%)
Chart on Regional Comparison - South America
Data Table on Regional Comparison - South America

11.7.1 Brazil - Market size and forecast 2024-2029

Chart on Brazil - Market size and forecast 2024-2029 ($ million)
Data Table on Brazil - Market size and forecast 2024-2029 ($ million)
Chart on Brazil - Year-over-year growth 2024-2029 (%)
Data Table on Brazil - Year-over-year growth 2024-2029 (%)

11.7.2 Argentina - Market size and forecast 2024-2029

Chart on Argentina - Market size and forecast 2024-2029 ($ million)
Data Table on Argentina - Market size and forecast 2024-2029 ($ million)
Chart on Argentina - Year-over-year growth 2024-2029 (%)
Data Table on Argentina - Year-over-year growth 2024-2029 (%)

11.7.3 Colombia - Market size and forecast 2024-2029

Chart on Colombia - Market size and forecast 2024-2029 ($ million)
Data Table on Colombia - Market size and forecast 2024-2029 ($ million)
Chart on Colombia - Year-over-year growth 2024-2029 (%)
Data Table on Colombia - Year-over-year growth 2024-2029 (%)

11.8 Market opportunity by geography

Market opportunity by geography ($ million)
Data Tables on Market opportunity by geography ($ million)

12. Drivers, Challenges, and Opportunity

12.1 Market drivers

Imperative for enhanced productivity and operational efficiency
Proliferation of data sources and advanced analytics capabilities
Increasing emphasis on safety, sustainability, and regulatory compliance

12.2 Market challenges

Pervasive issues of data fragmentation and quality
Substantial upfront investment and ambiguous return on investment
Significant talent deficiencies and ingrained cultural inertia

12.3 Impact of drivers and challenges

Impact of drivers and challenges in 2024 and 2029

12.4 Market opportunities

Ascendance of generative AI and hyper-automation
Shift towards integrated platforms and digital twin ecosystems
Proliferation of AI-powered robotics and autonomous on-site systems

13. Competitive Landscape

13.1 Overview

13.2

Overview on criticality of inputs and factors of differentiation

13.3 Landscape disruption

Overview on factors of disruption

13.4 Industry risks

Impact of key risks on business

14. Competitive Analysis

14.1 Companies profiled

Companies covered

14.2 Company ranking index

14.3 Market positioning of companies

Matrix on companies position and classification

14.4 Acciona SA

Acciona SA - Overview
Acciona SA - Business segments
Acciona SA - Key news
Acciona SA - Key offerings
Acciona SA - Segment focus
SWOT

14.5 AECOM

AECOM - Overview
AECOM - Business segments
AECOM - Key news
AECOM - Key offerings
AECOM - Segment focus
SWOT

14.6 Autodesk Inc.

Autodesk Inc. - Overview
Autodesk Inc. - Business segments
Autodesk Inc. - Key news
Autodesk Inc. - Key offerings
Autodesk Inc. - Segment focus
SWOT

14.7 Bentley Systems Inc.

Bentley Systems Inc. - Overview
Bentley Systems Inc. - Business segments
Bentley Systems Inc. - Key news
Bentley Systems Inc. - Key offerings
Bentley Systems Inc. - Segment focus
SWOT

14.8 Elise A.I. Technologies Corp.

Elise A.I. Technologies Corp. - Overview
Elise A.I. Technologies Corp. - Product / Service
Elise A.I. Technologies Corp. - Key offerings
SWOT

14.9 Laing O Rourke

Laing O Rourke - Overview
Laing O Rourke - Product / Service
Laing O Rourke - Key offerings
SWOT

14.10 Larsen and Toubro Ltd.

Larsen and Toubro Ltd. - Overview
Larsen and Toubro Ltd. - Business segments
Larsen and Toubro Ltd. - Key offerings
Larsen and Toubro Ltd. - Segment focus
SWOT

14.11 Magicbricks Realty Services Limited.

Magicbricks Realty Services Limited. - Overview
Magicbricks Realty Services Limited. - Product / Service
Magicbricks Realty Services Limited. - Key offerings
SWOT

14.12 Matterport Inc.

Matterport Inc. - Overview
Matterport Inc. - Product / Service
Matterport Inc. - Key offerings
SWOT

14.13 Obayashi Corp.

Obayashi Corp. - Overview
Obayashi Corp. - Business segments
Obayashi Corp. - Key offerings
Obayashi Corp. - Segment focus
SWOT

14.14 Procore Technologies Inc.

Procore Technologies Inc. - Overview
Procore Technologies Inc. - Product / Service
Procore Technologies Inc. - Key news
Procore Technologies Inc. - Key offerings
SWOT

14.15 Shimizu Corp.

Shimizu Corp. - Overview
Shimizu Corp. - Business segments
Shimizu Corp. - Key offerings
Shimizu Corp. - Segment focus
SWOT

14.16 Skanska AB

Skanska AB - Overview
Skanska AB - Business segments
Skanska AB - Key offerings
Skanska AB - Segment focus
SWOT

14.17 Trimble Inc.

Trimble Inc. - Overview
Trimble Inc. - Business segments
Trimble Inc. - Key news
Trimble Inc. - Key offerings
Trimble Inc. - Segment focus
SWOT

14.18 Vinci

Vinci - Overview
Vinci - Business segments
Vinci - Key offerings
Vinci - Segment focus
SWOT

15. Appendix

15.1 Scope of the report

Market definition
Objectives
Notes and caveats

15.2 Inclusions and exclusions checklist

Inclusions checklist
Exclusions checklist

15.3 Currency conversion rates for US$

15.4 Research methodology

15.5 Data procurement

Information sources

15.6 Data validation

15.7 Validation techniques employed for market sizing

15.8 Data synthesis

15.9 360 degree market analysis

15.10 List of abbreviations

Research Methodology

Technavio presents a detailed picture of the market by way of study, synthesis, and summation of data from multiple sources. The analysts have presented the various facets of the market with a particular focus on identifying the key industry influencers. The data thus presented is comprehensive, reliable, and the result of extensive research, both primary and secondary.

INFORMATION SOURCES

Primary sources

  • Manufacturers and suppliers
  • Channel partners
  • Industry experts
  • Strategic decision makers

Secondary sources

  • Industry journals and periodicals
  • Government data
  • Financial reports of key industry players
  • Historical data
  • Press releases

DATA ANALYSIS

Data Synthesis

  • Collation of data
  • Estimation of key figures
  • Analysis of derived insights

Data Validation

  • Triangulation with data models
  • Reference against proprietary databases
  • Corroboration with industry experts

REPORT WRITING

Qualitative

  • Market drivers
  • Market challenges
  • Market trends
  • Five forces analysis

Quantitative

  • Market size and forecast
  • Market segmentation
  • Geographical insights
  • Competitive landscape

Interested in this report?

Get your sample now to see our research methodology and insights!

Download Now

Frequently Asked Questions

AI In Real Estate And Construction market growth will increase by USD 15101.0 million during 2025-2029.

The AI In Real Estate And Construction market is expected to grow at a CAGR of 29.1% during 2025-2029.

AI In Real Estate And Construction market is segmented by Sector (Pre construction, Post construction) Organization size (Large enterprises, SMEs) Technology (ML and DL, NLP, Generative AI, Computer vision)

Acciona SA, AECOM, AirWorks Solutions Inc., Autodesk Inc., Bentley Systems Inc., Buildots Ltd, Dusty Robotics, Elise A.I. Technologies Corp., Kwant, Laing O Rourke, Larsen and Toubro Ltd., Magicbricks Realty Services Limited., Matterport Inc., Obayashi Corp., Procore Technologies Inc., Shimizu Corp., Skanska AB, Trimble Inc., Vinci are a few of the key vendors in the AI In Real Estate And Construction market.

North America will register the highest growth rate of 36.1% among the other regions. Therefore, the AI In Real Estate And Construction market in North America is expected to garner significant business opportunities for the vendors during the forecast period.

US, Canada, Mexico, Germany, UK, France, Italy, Spain, The Netherlands, China, Japan, India, South Korea, Australia, Indonesia, Saudi Arabia, UAE, South Africa, Turkey, Israel, Brazil, Argentina, Colombia

  • Imperative for enhanced productivity and operational efficiency is the driving factor this market.

The AI In Real Estate And Construction market vendors should focus on grabbing business opportunities from the Sector segment as it accounted for the largest market share in the base year.