
Artificial Intelligence (AI) In Asset Management Market Size 2026-2030
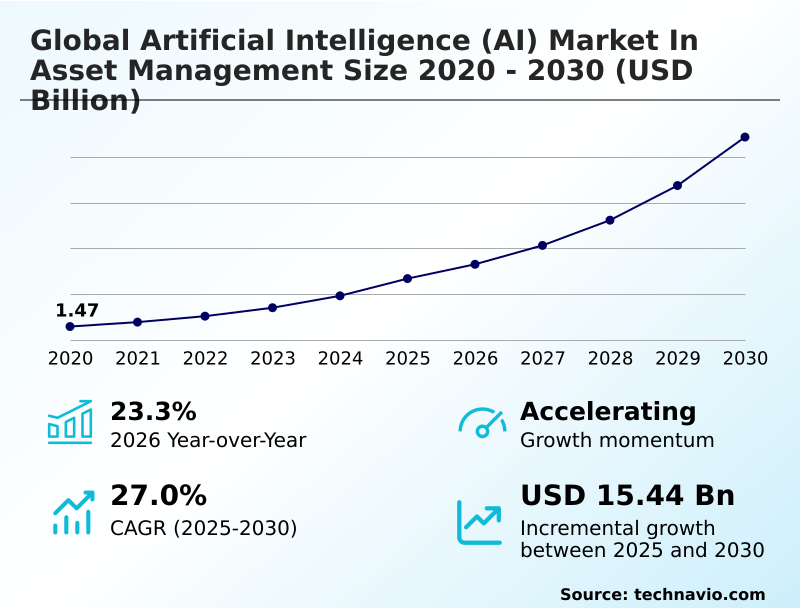
The artificial intelligence (ai) in asset management market size is valued to increase by USD 15.44 billion, at a CAGR of 27% from 2025 to 2030. Accelerated demand for hyper-personalization and customization will drive the artificial intelligence (ai) in asset management market.
Major Market Trends & Insights
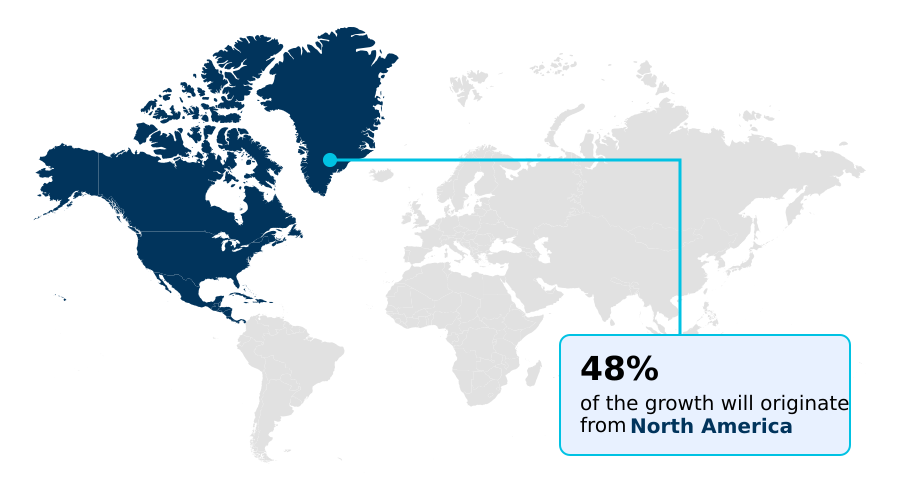
- North America dominated the market and accounted for a 47.8% growth during the forecast period.
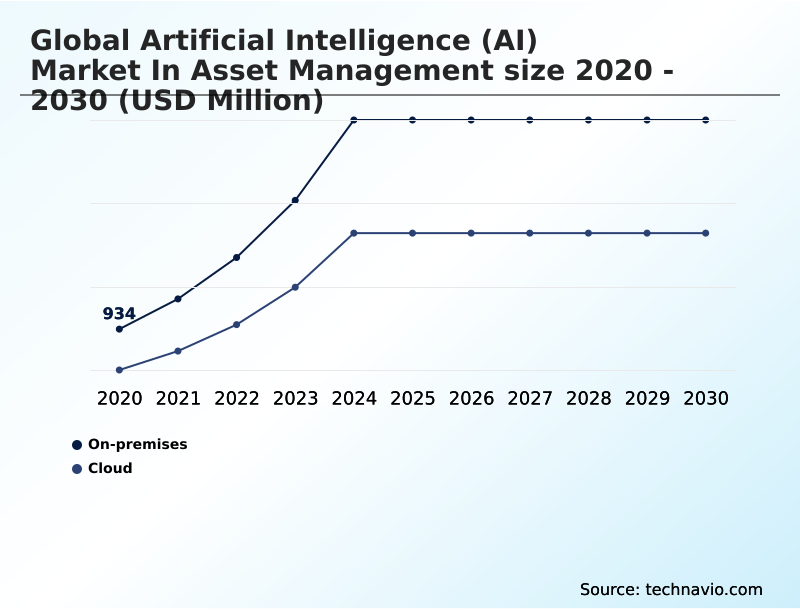
- By Deployment - On-premises segment was valued at USD 2.96 billion in 2024
- By Application - BFSI segment accounted for the largest market revenue share in 2024
Market Size & Forecast
- Market Opportunities: USD 20.67 billion
- Market Future Opportunities: USD 15.44 billion
- CAGR from 2025 to 2030 : 27%
Market Summary
- The artificial intelligence (AI) in asset management market is defined by a fundamental shift from experimental implementation to deep operational integration. Firms are increasingly deploying AI to refine investment strategies, enhance risk mitigation protocols, and streamline complex back-office workflows. This evolution is driven by the necessity to process massive datasets that exceed the capacity of traditional quantitative models.
- By utilizing machine learning models and natural language processing, firms can extract actionable insights from unstructured data sources, such as geopolitical news feeds and alternative financial indicators. For instance, a firm can leverage prescriptive analytics for automated portfolio construction, simulating market shocks to rebalance holdings in real-time and improve alpha generation.
- The maturation of these technologies allows for more precise automated asset allocation and the customization of investment products, such as bespoke direct indexing, at a scale previously considered unattainable. However, this progress is met with challenges related to data governance and the need for algorithmic transparency.
- The integration of generative AI is also facilitating the automation of multi-step portfolio management tasks, which significantly reduces the margin for human error and optimizes resource allocation across the enterprise, pushing the boundaries of fiduciary responsibility in a digital-first environment.
What will be the Size of the Artificial Intelligence (AI) In Asset Management Market during the forecast period?
Get Key Insights on Market Forecast (PDF) Request Free Sample
How is the Artificial Intelligence (AI) In Asset Management Market Segmented?
The artificial intelligence (ai) in asset management industry research report provides comprehensive data (region-wise segment analysis), with forecasts and estimates in "USD million" for the period 2026-2030, as well as historical data from 2020-2024 for the following segments.
- Deployment
- On-premises
- Cloud
- Application
- BFSI
- Retail and e-commerce
- Healthcare
- Energy and utilities
- Others
- Technology
- Machine learning
- Natural language processing
- Others
- Geography
- North America
- US
- Canada
- Mexico
- Europe
- UK
- Germany
- France
- APAC
- China
- Japan
- India
- Middle East and Africa
- Saudi Arabia
- UAE
- South Africa
- South America
- Brazil
- Argentina
- Rest of World (ROW)
- North America
By Deployment Insights
The on-premises segment is estimated to witness significant growth during the forecast period.
On-premises deployment remains a critical choice for large financial institutions prioritizing absolute data sovereignty and stringent security protocols. This approach provides complete authority over the AI software stack, enabling deep customization of algorithms for proprietary trading and front-to-back investment management.
By keeping high-performance computing infrastructure in-house for tasks like neural network training, firms ensure robust data governance and fiduciary oversight. This localized control is essential for streamlining back-office workflows and achieving greater operational efficiency.
On-premises solutions also minimize latency, a vital factor for market anomaly detection and strategies requiring rapid portfolio rebalancing.
This deployment model ensures that sensitive data remains within the firm’s perimeter, supporting rigorous AI-powered portfolio analytics while meeting internal risk policies and reducing overall cost optimization challenges.
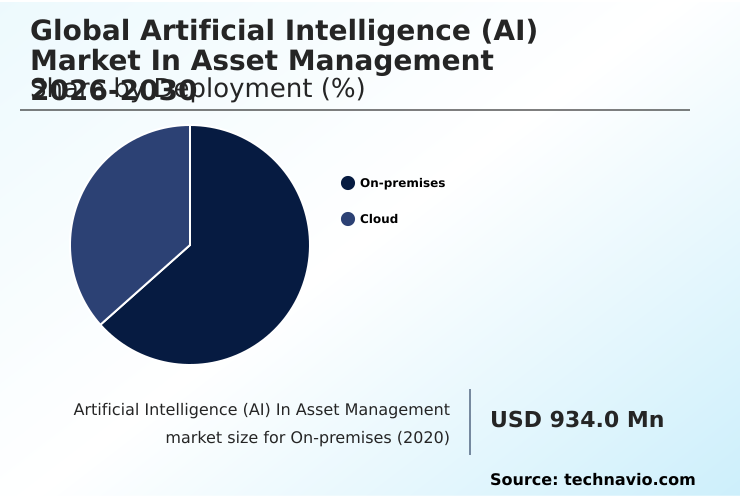
The On-premises segment was valued at USD 2.96 billion in 2024 and showed a gradual increase during the forecast period.
Regional Analysis
North America is estimated to contribute 47.8% to the growth of the global market during the forecast period.Technavio’s analysts have elaborately explained the regional trends and drivers that shape the market during the forecast period.
See How Artificial Intelligence (AI) In Asset Management Market Demand is Rising in North America Request Free Sample
The geographic landscape of the market is characterized by a significant concentration in North America, which accounts for nearly 47.8% of the incremental growth.
This dominance is fueled by a mature ecosystem of financial institutions and tech providers driving innovations in portfolio optimization and quantitative trading strategies. The region's leadership in deploying advanced machine learning models for risk analytics is a key factor.
Meanwhile, APAC is emerging as the fastest-growing region, with a projected CAGR of 28.0%, slightly outpacing Europe's 27.6% and North America's 26.6%.
This growth in APAC is driven by the rapid adoption of digital financial services and increasing investments in AI-enabled market intelligence.
The market's expansion globally is influenced by varying levels of data complexity and the need for predictive modeling to navigate market volatility, with high-frequency trading applications being a key focus in developed regions.
Market Dynamics
Our researchers analyzed the data with 2025 as the base year, along with the key drivers, trends, and challenges. A holistic analysis of drivers will help companies refine their marketing strategies to gain a competitive advantage.
- The strategic implementation of artificial intelligence is creating distinct competitive advantages across the asset management value chain. The use of AI for hyper-personalization in asset management is transitioning from a niche offering to a core requirement for wealth management platforms, enabling the creation of highly customized portfolios at scale.
- Concurrently, machine learning for algorithmic trading optimization is becoming more sophisticated, allowing firms to execute complex quantitative trading strategies using neural networks with greater precision. This is complemented by the rise of autonomous investment workflows with agentic AI, which automate end-to-end processes and are powered by developing large action models for financial tasks.
- AI-driven risk analytics for portfolio management now incorporate real-time risk assessment using AI models, providing a more dynamic view of potential exposures. Firms are also leveraging natural language processing for market sentiment analysis, with some reporting decision-making speeds that are twice as fast as those relying on manual research.
- As the industry moves forward, integrating AI with asset tokenization and smart contracts is set to unlock new efficiencies. This technological integration demands robust data governance frameworks for AI in finance and a focus on explainable AI for fiduciary responsibility in investment.
- Furthermore, AI applications for operational efficiency in asset servicing and for enhancing client onboarding in wealth management are streamlining operations, while managing algorithmic bias in automated portfolio construction and securing AI models against cybersecurity threats remain critical priorities.
- Finally, the ability to use alternative data with AI for alpha generation and to develop AI-driven tools for bespoke direct indexing are key differentiators in a crowded market, supported by cloud-based AI platforms for investment management and advanced regulatory technology for AI in financial services.
What are the key market drivers leading to the rise in the adoption of Artificial Intelligence (AI) In Asset Management Industry?
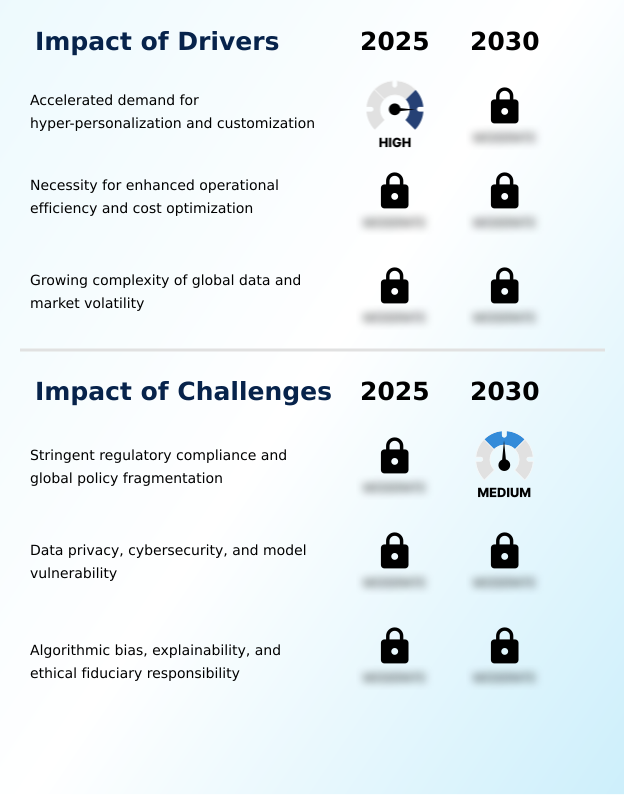
- The market is primarily driven by an accelerated demand for hyper-personalization and customization in investment solutions.
- Accelerated demand for hyper-personalized investment solutions is a primary driver of market growth. AI enables asset managers to deliver bespoke direct indexing strategies and thematic portfolios at scale, moving beyond broad segmentation to a truly individualized client experience.
- This is achieved through prescriptive analytics and machine learning models that facilitate automated portfolio construction and automated asset allocation. The necessity for enhanced operational efficiency and superior alpha generation further propels adoption, with robotic process automation streamlining routine tasks.
- The integration of advanced data analytics and the use of investment data platforms allow for real-time risk assessment and a transition toward client-centric fiduciary care.
- As competitive pressures mount, the ability to deliver granular, value-driven outcomes through AI has become a critical differentiator.
What are the market trends shaping the Artificial Intelligence (AI) In Asset Management Industry?
- The emergence of agentic AI and autonomous investment workflows represents a significant upcoming trend. This development is fundamentally reshaping operational dynamics across the industry.
- A definitive trend reshaping the market is the transition from passive analytical tools to active, agentic AI systems and autonomous investment workflows. Driven by the maturation of large action models, these systems are now executing end-to-end workflows, including identifying market anomalies and coordinating complex settlements. This shift toward AI-native asset managers compresses the operational lifecycle and fosters greater operational agility.
- The convergence of AI with asset tokenization and AI-driven smart contracts is also unlocking new efficiencies in digital asset management. Firms are leveraging multi-agent architectures to process unstructured information for market sentiment analysis, reflecting a broader push for AI-driven innovation.
- This technological leap is further supported by improved cloud computing integration, allowing professionals to pivot from technical execution to strategic oversight.
What challenges does the Artificial Intelligence (AI) In Asset Management Industry face during its growth?
- Stringent regulatory compliance and global policy fragmentation present a key challenge affecting industry growth.
- The market faces its foremost challenge in the complexity of regulatory compliance and global policy fragmentation. As authorities introduce distinct requirements for algorithmic transparency and data governance, firms find it difficult to maintain consistent global operations, with AI adoption rates varying by 15% across regions with differing rules.
- The full implementation of legislation like the EU AI Act imposes rigorous mandates for high-risk deep learning architectures, including systems used for significant investment decision-making. Simultaneously, regulators are emphasizing fiduciary responsibility and the mitigation of risks associated with algorithmic bias and model explainability.
- This landscape is complicated by persistent data privacy and cybersecurity threats, including model vulnerability, forcing firms to develop highly flexible compliance architectures for both on-premise and institutional digital assets. This focus on compliance can divert resources from core innovation in tactical hedging and enterprise-wide integration.
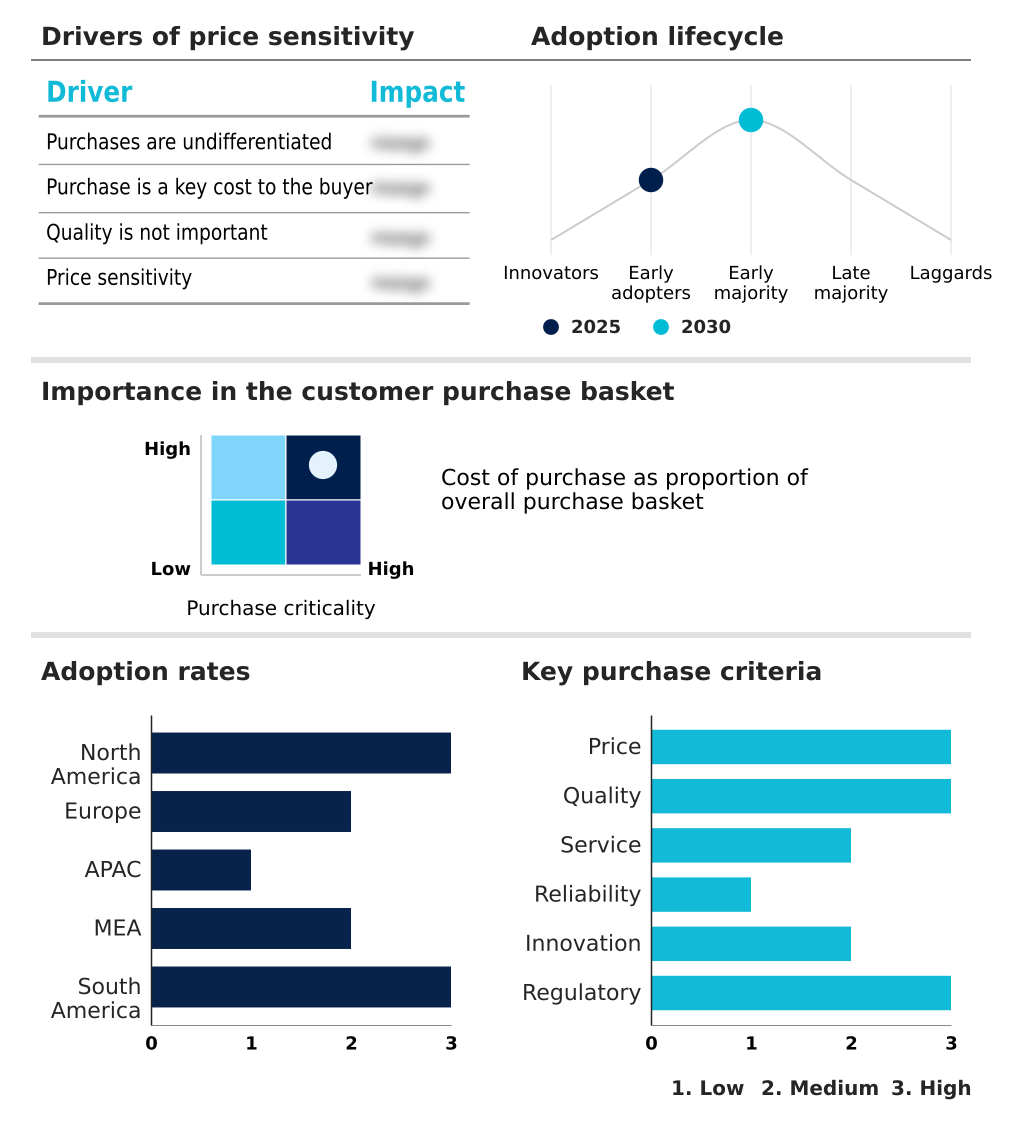
Exclusive Technavio Analysis on Customer Landscape
The artificial intelligence (ai) in asset management market forecasting report includes the adoption lifecycle of the market, covering from the innovator’s stage to the laggard’s stage. It focuses on adoption rates in different regions based on penetration. Furthermore, the artificial intelligence (ai) in asset management market report also includes key purchase criteria and drivers of price sensitivity to help companies evaluate and develop their market growth analysis strategies.
Customer Landscape of Artificial Intelligence (AI) In Asset Management Industry
Competitive Landscape
Companies are implementing various strategies, such as strategic alliances, artificial intelligence (ai) in asset management market forecast, partnerships, mergers and acquisitions, geographical expansion, and product/service launches, to enhance their presence in the industry.
BlackRock Inc. - Delivers integrated AI-driven risk analytics and portfolio management through a proprietary platform, enhancing investment decision support across diverse asset classes.
The industry research and growth report includes detailed analyses of the competitive landscape of the market and information about key companies, including:
- BlackRock Inc.
- Broadridge Financial Solutions
- FactSet Research Systems Inc.
- FMR LLC
- Franklin Templeton
- Invesco Ltd.
- JPMorgan Chase and Co.
- London Stock Exchange Group plc
- Morgan Stanley
- MSCI Inc.
- Northern Trust Corp.
- Schroders plc
- SimCorp A/S
- SS and C Technologies Inc.
- State Street Corp.
- T. Rowe Price Group Inc.
- The Charles Schwab Corp.
- The Goldman Sachs Group Inc.
- The Vanguard Group Inc.
- UBS Group AG
Qualitative and quantitative analysis of companies has been conducted to help clients understand the wider business environment as well as the strengths and weaknesses of key industry players. Data is qualitatively analyzed to categorize companies as pure play, category-focused, industry-focused, and diversified; it is quantitatively analyzed to categorize companies as dominant, leading, strong, tentative, and weak.
Recent Development and News in Artificial intelligence (ai) in asset management market
- In September, 2024, Morgan Stanley launched AI at Morgan Stanley Debrief, an AI-powered meeting assistant for its wealth management advisors that automatically transcribes and summarizes client meetings, extracts key points, and generates draft follow-up emails, saving significant administrative time per meeting.
- In November, 2024, Franklin Templeton entered a multi-year partnership with Wand AI to embed agentic artificial intelligence across its global operations, moving from pilots to enterprise-scale automation in research and operations with a target for wide-scale integration by 2026.
- In January, 2025, Broadridge Financial Solutions Inc collaborated with the Money Management Institute on a survey revealing that asset and wealth management firms are prioritizing AI-driven innovation, new products, and enhanced client experiences as key growth drivers, with 87% agreeing that younger investors require different service models.
- In April, 2025, BlackRock Inc launched the AI-powered Auto Commentary feature within Aladdin Wealth, generating personalized portfolio narratives for advisors. The tool integrates hundreds of data points from risk analytics, CIO outlooks, and client portfolio details to produce concise, client-ready insights.
Dive into Technavio’s robust research methodology, blending expert interviews, extensive data synthesis, and validated models for unparalleled Artificial Intelligence (AI) In Asset Management Market insights. See full methodology.
| Market Scope | |
|---|---|
| Page number | 298 |
| Base year | 2025 |
| Historic period | 2020-2024 |
| Forecast period | 2026-2030 |
| Growth momentum & CAGR | Accelerate at a CAGR of 27% |
| Market growth 2026-2030 | USD 15437.5 million |
| Market structure | Fragmented |
| YoY growth 2025-2026(%) | 23.3% |
| Key countries | US, Canada, Mexico, UK, Germany, France, Italy, Spain, The Netherlands, China, Japan, India, South Korea, Australia, Indonesia, Saudi Arabia, UAE, South Africa, Egypt, Nigeria, Brazil, Argentina and Chile |
| Competitive landscape | Leading Companies, Market Positioning of Companies, Competitive Strategies, and Industry Risks |
Research Analyst Overview
- The artificial intelligence in asset management market is evolving from a supplementary tool to a core operational backbone, fundamentally altering how firms approach investment decision support. Leading institutions are embedding advanced machine learning models and deep learning architectures into their front-to-back investment management systems.
- This integration enables sophisticated quantitative trading strategies, predictive modeling, and real-time risk assessment, which are critical for navigating volatile markets. The deployment of agentic AI systems for autonomous investment workflows represents a significant leap, compelling boardroom decisions on R&D spending versus compliance infrastructure.
- For instance, firms are reallocating budgets, with investments in AI-driven risk analytics increasing by over 20% year-over-year to meet new regulatory demands for algorithmic transparency and explainable AI. The focus is now on achieving superior alpha generation through automated portfolio construction and hyper-personalized solutions.
- As the industry advances, mastering data governance, ensuring fiduciary oversight, and managing multi-asset portfolio management with AI will define market leadership, moving beyond simple robotic process automation to holistic, intelligent asset management.
What are the Key Data Covered in this Artificial Intelligence (AI) In Asset Management Market Research and Growth Report?
-
What is the expected growth of the Artificial Intelligence (AI) In Asset Management Market between 2026 and 2030?
-
USD 15.44 billion, at a CAGR of 27%
-
-
What segmentation does the market report cover?
-
The report is segmented by Deployment (On-premises, and Cloud), Application (BFSI, Retail and e-commerce, Healthcare, Energy and utilities, and Others), Technology (Machine learning, Natural language processing, and Others) and Geography (North America, Europe, APAC, Middle East and Africa, South America)
-
-
Which regions are analyzed in the report?
-
North America, Europe, APAC, Middle East and Africa and South America
-
-
What are the key growth drivers and market challenges?
-
Accelerated demand for hyper-personalization and customization, Stringent regulatory compliance and global policy fragmentation
-
-
Who are the major players in the Artificial Intelligence (AI) In Asset Management Market?
-
BlackRock Inc., Broadridge Financial Solutions, FactSet Research Systems Inc., FMR LLC, Franklin Templeton, Invesco Ltd., JPMorgan Chase and Co., London Stock Exchange Group plc, Morgan Stanley, MSCI Inc., Northern Trust Corp., Schroders plc, SimCorp A/S, SS and C Technologies Inc., State Street Corp., T. Rowe Price Group Inc., The Charles Schwab Corp., The Goldman Sachs Group Inc., The Vanguard Group Inc. and UBS Group AG
-
Market Research Insights
- The market dynamics for artificial intelligence in asset management are shaped by the dual pressures of client demands and technological capabilities. Buyers are increasingly sophisticated, leveraging their power to demand hyper-personalized investment solutions, greater transparency, and lower fee structures, which compels firms to focus on operational efficiency.
- Adoption of AI has resulted in an average 25% improvement in portfolio performance analysis for early adopters. Concurrently, the bargaining power of suppliers, particularly those providing high-quality alternative data and specialized AI talent, remains high, creating a critical dependency for asset managers.
- The year-over-year growth of 23.3% reflects a market in rapid transition, where firms are compelled to invest in AI-driven innovation to maintain a competitive edge and meet the standards of client-centric fiduciary care. This environment fosters enterprise-wide integration of AI to manage market volatility and deliver superior alpha generation.
We can help! Our analysts can customize this artificial intelligence (ai) in asset management market research report to meet your requirements.
 RIA -
RIA - 
