AI In Retail And Consumer Products Market Size 2025-2029
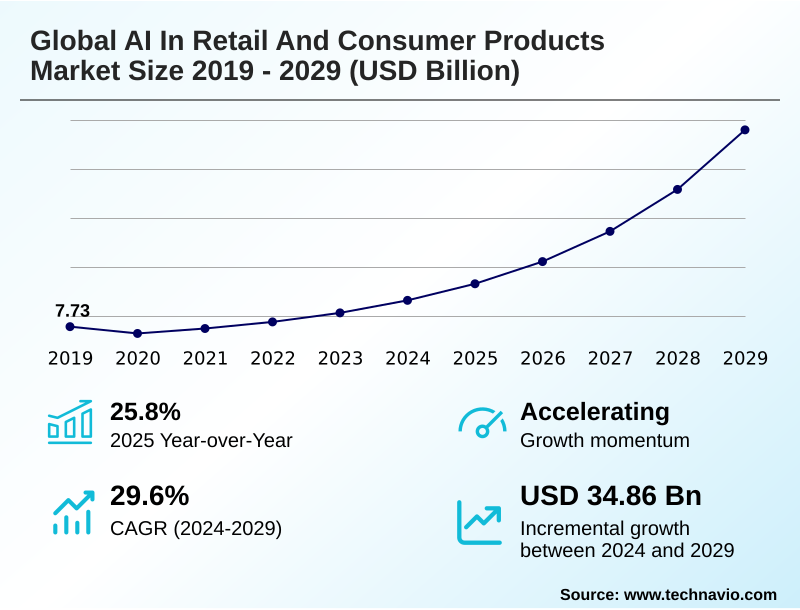
The ai in retail and consumer products market size is valued to increase by USD 34.86 billion, at a CAGR of 29.6% from 2024 to 2029. Imperative for hyper-personalization and enhanced customer experience will drive the ai in retail and consumer products market.
Major Market Trends & Insights
- North America dominated the market and accounted for a 35.2% growth during the forecast period.
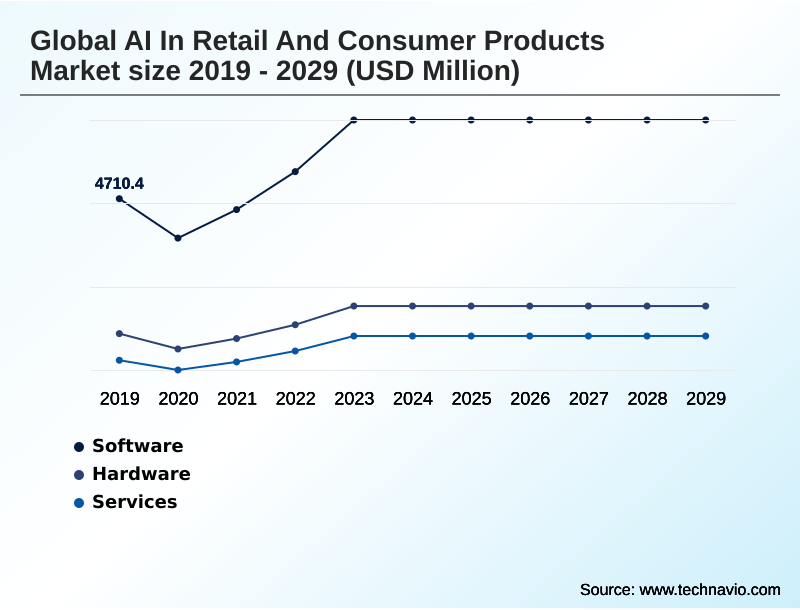
- By Component - Software segment was valued at USD 6.41 billion in 2023
- By Technology - ML and DL segment accounted for the largest market revenue share in 2023
Market Size & Forecast
- Market Opportunities: USD 40.25 billion
- Market Future Opportunities: USD 34.86 billion
- CAGR from 2024 to 2029 : 29.6%
Market Summary
- The AI in retail and consumer products market is undergoing a significant transformation, driven by the dual imperatives of enhancing customer experience and optimizing operational efficiency. The demand for AI-driven personalization is compelling businesses to adopt hyper-personalization engines and intelligent virtual assistants, moving beyond generic interactions to create context-aware shopping journeys.
- Technologies like computer vision systems are enabling frictionless checkout technology and sophisticated in-store analytics, bridging the gap between digital and physical retail. Internally, companies are deploying AI-powered demand forecasting and prescriptive analytics engines to refine supply chain optimization.
- For instance, a major apparel retailer can leverage demand forecasting models to analyze real-time sales and social media trends, adjusting inventory levels across hundreds of stores to reduce overstock situations by double-digit percentages. However, successful implementation hinges on overcoming challenges related to data quality and the high costs of deployment.
- The ongoing development of generative AI content creation and conversational commerce platforms continues to redefine engagement, making AI a foundational capability for competitive survival.
What will be the Size of the AI In Retail And Consumer Products Market during the forecast period?
Get Key Insights on Market Forecast (PDF) Get Free Sample
How is the AI In Retail And Consumer Products Market Segmented?
The ai in retail and consumer products industry research report provides comprehensive data (region-wise segment analysis), with forecasts and estimates in "USD million" for the period 2025-2029, as well as historical data from 2019-2023 for the following segments.
- Component
- Software
- Hardware
- Services
- Technology
- ML and DL
- Predictive and prescriptive analytics
- NLP
- Computer vision
- Generative AI
- Application
- Demand forecasting and inventory management
- Customer experience and engagement
- Pricing and promotion optimization
- Others
- Geography
- North America
- US
- Canada
- Mexico
- APAC
- China
- India
- Japan
- Europe
- Germany
- UK
- France
- South America
- Brazil
- Argentina
- Colombia
- Middle East and Africa
- UAE
- Saudi Arabia
- South Africa
- Rest of World (ROW)
- North America
By Component Insights
The software segment is estimated to witness significant growth during the forecast period.
The software segment is the market's core, comprising solutions that automate decisions and generate predictive insights. These platforms utilize natural language processing to power cognitive customer-care responses and intelligent store analytics.
Key applications include hyper-personalization engines that deliver tailored marketing and dynamic pricing algorithms that adjust in real-time. Use cases such as customer churn prediction and predictive maintenance are becoming standard.
This software enables an AI-powered search experience through conversational queries and allows for barcode-less item recognition in stores.
The adoption of these tools, such as those for agentic AI for decor matching, has led to measurable performance gains, with some retailers improving demand forecast accuracy by over 15%.
This shift toward integrated software platforms is foundational to building futuristic retail experiences.
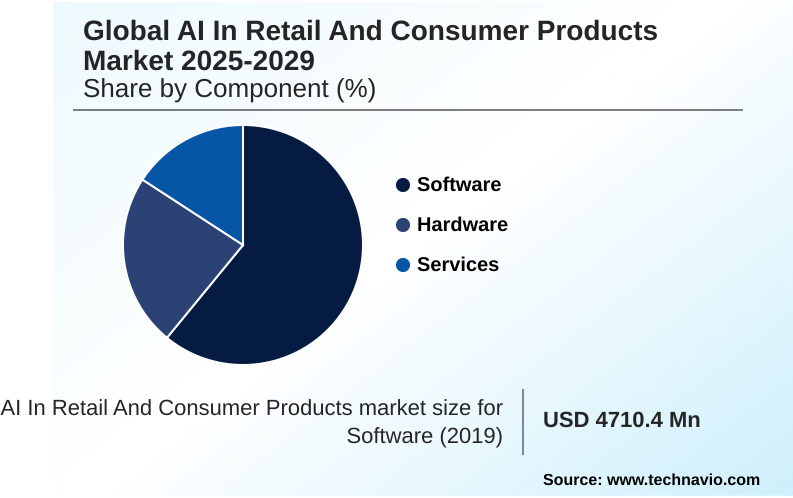
The Software segment was valued at USD 6.41 billion in 2023 and showed a gradual increase during the forecast period.
Regional Analysis
North America is estimated to contribute 35.2% to the growth of the global market during the forecast period.Technavio’s analysts have elaborately explained the regional trends and drivers that shape the market during the forecast period.
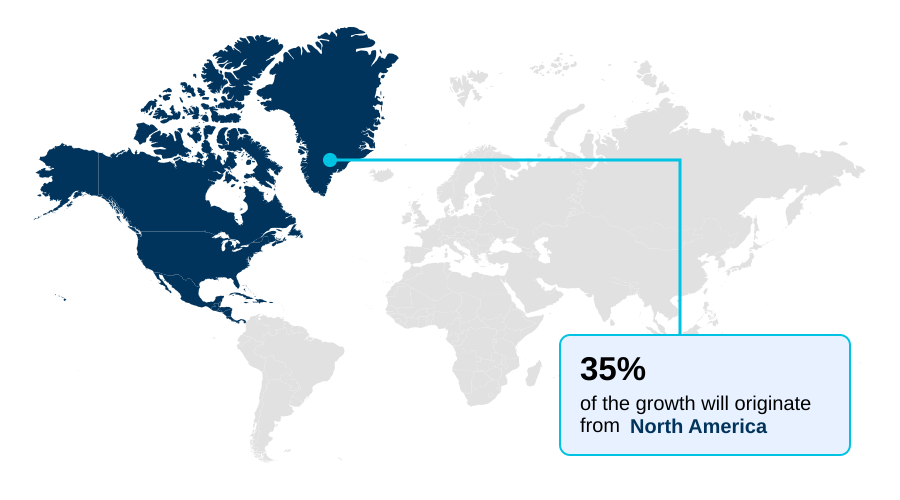
See How AI In Retail And Consumer Products Market Demand is Rising in North America Get Free Sample
The market exhibits distinct regional dynamics. North America leads due to early adoption, focusing on AI-powered clienteling and optimizing complex omnichannel supply chains.
APAC is the fastest-growing region, driven by a mobile-first digital economy and the rise of social commerce platforms. In this region, livestreaming e-commerce and hyper-local delivery optimization are key applications, with some platforms achieving a 25% reduction in delivery times.
Europe's market is shaped by strict data privacy regulations, encouraging the use of sentiment analysis and semantic search capabilities that respect user consent.
In emerging markets, AI-driven credit scoring is enabling a decentralized digital commerce model, expanding access to online retail for millions.
This geographic variance highlights the need for tailored strategies, from robotic shelf-stocking in labor-scarce markets to AI-powered logistics for navigating dense urban centers.
Market Dynamics
Our researchers analyzed the data with 2024 as the base year, along with the key drivers, trends, and challenges. A holistic analysis of drivers will help companies refine their marketing strategies to gain a competitive advantage.
- Strategic decision-making in the global AI in retail and consumer products market 2025-2029 for hyper-personalization requires a deep understanding of its diverse applications and returns. The ROI of AI implementation in retail operations is a central boardroom topic, particularly when evaluating the impact of dynamic pricing algorithms on revenue, which can outperform static models by a significant margin.
- For operational leaders, AI in retail for supply chain optimization is crucial, with a focus on AI for reducing stockouts and overstocks. Here, machine learning models for demand forecasting and an AI-enhanced supply chain for sustainability are top priorities. On the customer-facing side, generative AI use cases in conversational commerce and NLP applications in customer service automation are redefining engagement.
- Many are also exploring visual search technology in e-commerce platforms and AI-powered clienteling for luxury brands to create differentiated experiences. Technologically, computer vision for frictionless checkout systems and the role of autonomous robots in warehouse automation represent major capital investments. Concurrently, businesses must address the challenges of data governance in retail AI and the ethical considerations in retail AI deployment.
- Use cases like AI for fraud detection in retail transactions, prescriptive analytics for markdown optimization, and using AI to predict customer churn offer clear financial benefits. Success hinges on mastering AI-driven assortment optimization strategies and hyper-localized assortment planning with AI to meet localized demand.
What are the key market drivers leading to the rise in the adoption of AI In Retail And Consumer Products Industry?
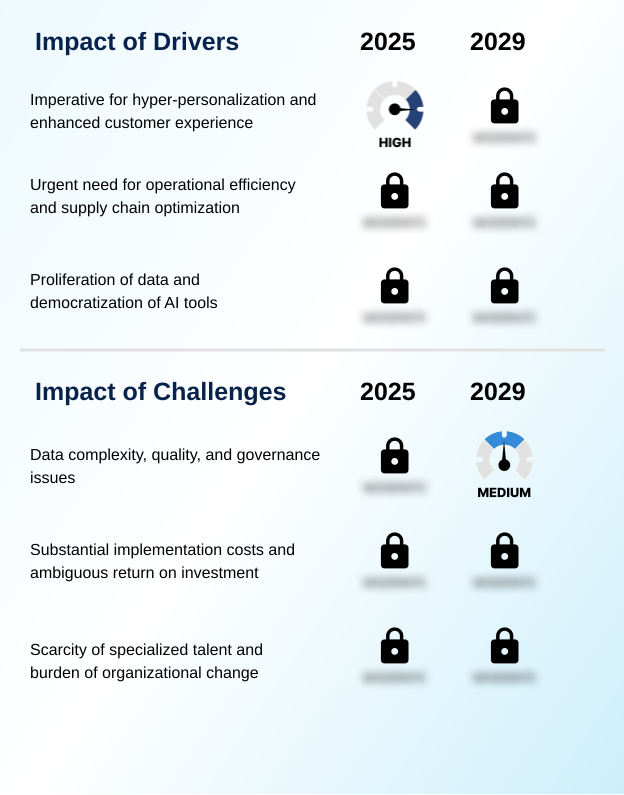
- The imperative for hyper-personalization and an enhanced customer experience serves as a key driver of market growth.
- A primary driver is the demand for hyper-personalization, addressed by hyper-personalization engines that leverage AI-driven personalization to enhance customer experiences. These systems analyze data to fuel recommendation algorithms, increasing conversion rates by over 15% in some deployments.
- A second driver is the need for operational efficiency, where AI-powered demand forecasting and prescriptive analytics engines are critical for supply chain optimization.
- Implementations of autonomous mobile robots and robotic process automation in warehouses have been shown to increase throughput by over 30%. The democratization of AI tools through AI-as-a-Service offerings and low-code AI platforms is also crucial.
- This allows more businesses to deploy AI-enhanced supply chain solutions and achieve AI-enabled operational excellence, fostering a more resilient agile supply chain model through better AI-driven inventory management.
What are the market trends shaping the AI In Retail And Consumer Products Industry?
- The proliferation of generative AI represents a key market trend, with increasing applications in conversational commerce and automated content creation.
- The market's evolution is defined by the proliferation of generative AI, powering a new class of intelligent virtual assistants for conversational commerce and automating generative AI content creation. The convergence of AI and computer vision systems is creating intelligent physical environments, with some retailers reporting an 18% improvement in on-shelf availability through automated shelf monitoring.
- This is pivotal for in-store analytics and frictionless checkout technology. A key trend is leveraging AI for product innovation, using generative design tools for assortment optimization. The quick commerce model, accelerated by digital twin technology, is reshaping fulfillment.
- This shift, supported by retail-tech startups, includes beauty tech applications and virtual influencers to create context-aware shopping journeys, reducing content creation cycles by up to 50% compared to manual methods.
What challenges does the AI In Retail And Consumer Products Industry face during its growth?
- The complexity, quality, and governance of data present a key challenge affecting industry growth.
- A formidable challenge is data complexity, requiring robust data cleansing and normalization and effective AI governance frameworks to prevent biased outcomes. Issues with data quality can reduce forecast accuracy by more than 20%, undermining trust in demand forecasting models.
- The high implementation cost and ambiguous ROI also temper adoption, with the expense of specialized hardware for GPU-accelerated demand forecasting being a significant factor. A critical hurdle is the scarcity of specialized talent and the burden of organizational change, which can delay projects by over six months.
- Without a culture that embraces data-driven insights from agentic AI customer intelligence and AI-powered customer insights, even advanced tools for automated merchandising or tracking real-time ESG metrics will fail. Overcoming resistance to new systems and ensuring a privacy-by-design approach are also key to successful deployment.
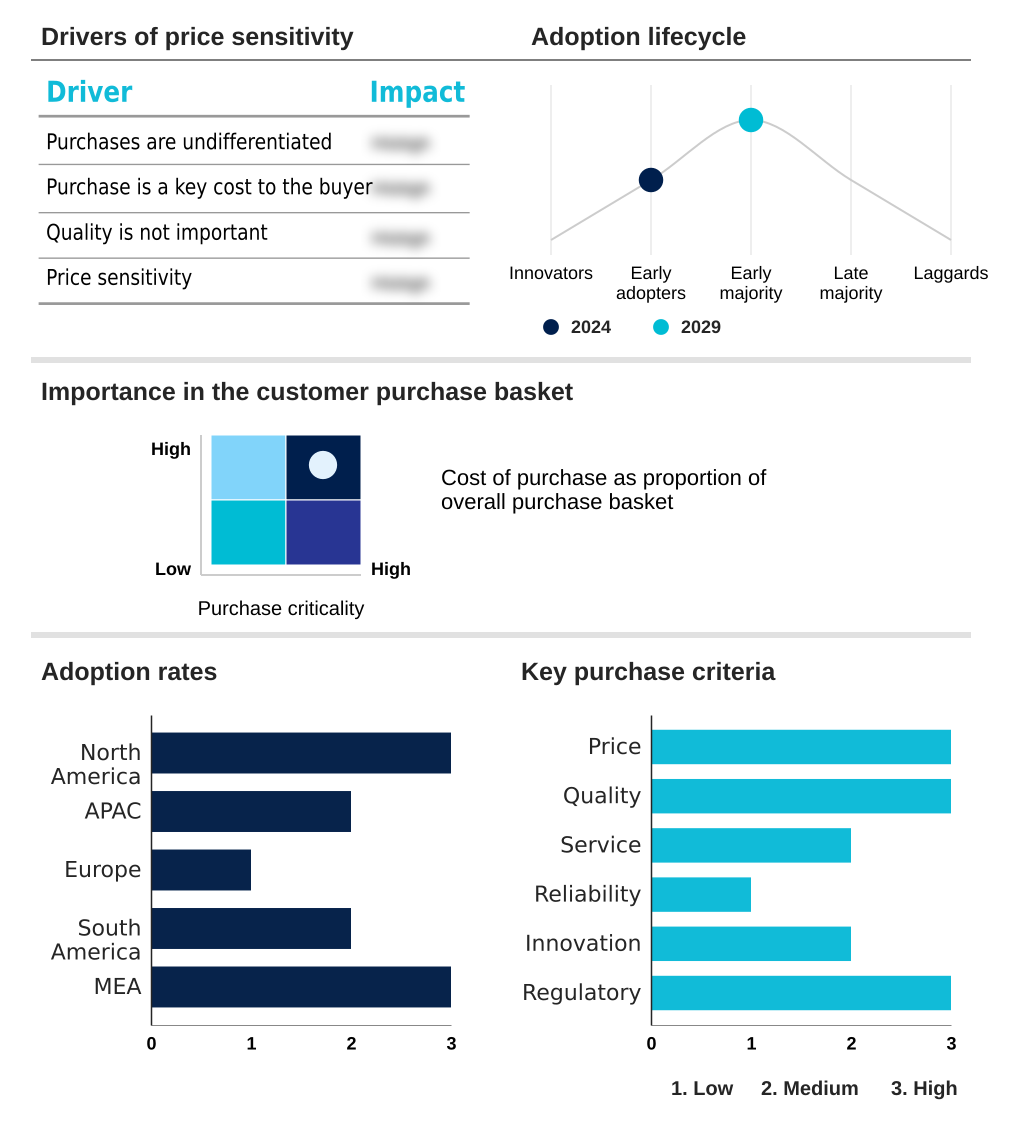
Exclusive Technavio Analysis on Customer Landscape
The ai in retail and consumer products market forecasting report includes the adoption lifecycle of the market, covering from the innovator’s stage to the laggard’s stage. It focuses on adoption rates in different regions based on penetration. Furthermore, the ai in retail and consumer products market report also includes key purchase criteria and drivers of price sensitivity to help companies evaluate and develop their market growth analysis strategies.
Customer Landscape of AI In Retail And Consumer Products Industry
Competitive Landscape
Companies are implementing various strategies, such as strategic alliances, ai in retail and consumer products market forecast, partnerships, mergers and acquisitions, geographical expansion, and product/service launches, to enhance their presence in the industry.
Accenture PLC - Leverages AI for demand forecasting and supply chain optimization, using AI-driven personalization to enhance customer engagement and operational efficiency.
The industry research and growth report includes detailed analyses of the competitive landscape of the market and information about key companies, including:
- Accenture PLC
- Amazon.com Inc.
- BigCommerce Holdings Inc.
- C3.ai Inc.
- Capgemini Service SAS
- Cognizant Technology Solution
- Google LLC
- Infosys Ltd.
- Intel Corp.
- IBM Corp.
- Microsoft Corp.
- NVIDIA Corp.
- Oracle Corp.
- Salesforce Inc.
- SAP SE
- SAS Institute Inc.
- Shopify Inc.
- Symphony Innovation LLC
Qualitative and quantitative analysis of companies has been conducted to help clients understand the wider business environment as well as the strengths and weaknesses of key industry players. Data is qualitatively analyzed to categorize companies as pure play, category-focused, industry-focused, and diversified; it is quantitatively analyzed to categorize companies as dominant, leading, strong, tentative, and weak.
Recent Development and News in Ai in retail and consumer products market
- In September 2024, Salesforce Inc. announced a strategic alliance with a leading robotics firm to integrate autonomous warehouse solutions into its Commerce Cloud, aiming to enhance fulfillment automation for enterprise clients.
- In November 2024, NVIDIA Corp. launched its next-generation Metropolis platform, featuring advanced AI models for real-time loss prevention and frictionless checkout, reporting a 40% increase in detection accuracy.
- In February 2025, Oracle Corp. acquired a specialized AI startup focused on prescriptive analytics for markdown optimization, integrating its technology into the Oracle Retail suite to enhance profitability for fashion retailers.
- In April 2025, SAP SE expanded its generative AI capabilities for retail, introducing a new module for hyper-localized assortment planning that leverages real-time social media trend analysis and local event data.
Dive into Technavio’s robust research methodology, blending expert interviews, extensive data synthesis, and validated models for unparalleled AI In Retail And Consumer Products Market insights. See full methodology.
| Market Scope | |
|---|---|
| Page number | 320 |
| Base year | 2024 |
| Historic period | 2019-2023 |
| Forecast period | 2025-2029 |
| Growth momentum & CAGR | Accelerate at a CAGR of 29.6% |
| Market growth 2025-2029 | USD 34863.3 million |
| Market structure | Fragmented |
| YoY growth 2024-2025(%) | 25.8% |
| Key countries | US, Canada, Mexico, China, India, Japan, South Korea, Australia, Indonesia, Germany, UK, France, Italy, Spain, The Netherlands, Brazil, Argentina, Colombia, UAE, Saudi Arabia, South Africa, Turkey and Israel |
| Competitive landscape | Leading Companies, Market Positioning of Companies, Competitive Strategies, and Industry Risks |
Research Analyst Overview
- The market's architecture is built on a foundation of sophisticated software and hardware designed for high-stakes decision-making. Core technologies like AI-driven personalization and AI-powered demand forecasting are now baseline requirements for competitive operations.
- The deployment of computer vision systems enables capabilities from automated shelf monitoring in stores to gesture recognition algorithms for loss prevention, with some systems demonstrating a theft detection accuracy improvement of over 30% compared to legacy methods. Advanced applications leverage natural language processing for intelligent virtual assistants and sentiment analysis to gauge brand perception.
- In logistics, prescriptive analytics engines and autonomous mobile robots are central to supply chain optimization and achieving predictive maintenance on equipment. For customer engagement, firms utilize hyper-personalization engines, dynamic pricing algorithms, and conversational commerce platforms. Internally, the rise of generative AI content creation, generative design tools, and low-code AI platforms is accelerating innovation in assortment optimization and hyper-localized assortments.
- Managing this ecosystem requires robust AI governance frameworks to address issues like model drift prevention and ensure effective data cleansing and normalization for all AI-as-a-Service and robotic process automation initiatives.
What are the Key Data Covered in this AI In Retail And Consumer Products Market Research and Growth Report?
-
What is the expected growth of the AI In Retail And Consumer Products Market between 2025 and 2029?
-
USD 34.86 billion, at a CAGR of 29.6%
-
-
What segmentation does the market report cover?
-
The report is segmented by Component (Software, Hardware, and Services), Technology (ML and DL, Predictive and prescriptive analytics, NLP, Computer vision, and Generative AI), Application (Demand forecasting and inventory management, Customer experience and engagement, Pricing and promotion optimization, and Others) and Geography (North America, APAC, Europe, South America, Middle East and Africa)
-
-
Which regions are analyzed in the report?
-
North America, APAC, Europe, South America and Middle East and Africa
-
-
What are the key growth drivers and market challenges?
-
Imperative for hyper-personalization and enhanced customer experience, Data complexity, quality, and governance issues
-
-
Who are the major players in the AI In Retail And Consumer Products Market?
-
Accenture PLC, Amazon.com Inc., BigCommerce Holdings Inc., C3.ai Inc., Capgemini Service SAS, Cognizant Technology Solution, Google LLC, Infosys Ltd., Intel Corp., IBM Corp., Microsoft Corp., NVIDIA Corp., Oracle Corp., Salesforce Inc., SAP SE, SAS Institute Inc., Shopify Inc. and Symphony Innovation LLC
-
Market Research Insights
- Market dynamics are shaped by the strategic deployment of advanced AI capabilities to achieve tangible business outcomes. The integration of agentic AI concierges and cognitive customer-care responses is elevating service standards, with some platforms improving first-contact resolution rates by over 20%.
- In operations, AI-enabled operational excellence is achieved through AI-driven inventory management and GPU-accelerated demand forecasting, which can reduce carrying costs by up to 15%. The rise of retail-tech startups is fostering innovation in areas like intelligent store analytics and automated merchandising. This allows for the creation of futuristic retail experiences and bespoke clienteling services.
- The adoption of digital twin technology in AI-enhanced supply chain solutions provides sophisticated simulation capabilities, while a privacy-by-design approach is critical for maintaining consumer trust in an increasingly data-driven environment.
We can help! Our analysts can customize this ai in retail and consumer products market research report to meet your requirements.
 RIA -
RIA - 
