AI In Reverse Logistics Market Analysis, Size, and Forecast 2026-2030: North America (US, Canada, and Mexico), Europe (Germany, UK, and France), APAC (China, India, and Japan), South America (Brazil, Argentina, and Colombia), Middle East and Africa (Saudi Arabia, UAE, and Turkey), and Rest of World (ROW)

AI In Reverse Logistics Market Analysis, Size, and Forecast 2026-2030:
North America (US, Canada, and Mexico), Europe (Germany, UK, and France), APAC (China, India, and Japan), South America (Brazil, Argentina, and Colombia), Middle East and Africa (Saudi Arabia, UAE, and Turkey), and Rest of World (ROW)

Published: Apr 2026 306 Pages SKU: IRTNTR81441

Market Overview at a Glance

$4.60 B
Market Opportunity
19.8%
CAGR 2025 - 2030
38.6%
North America Growth
$1.56 B
Software segment 2024

AI In Reverse Logistics Market Size 2026-2030

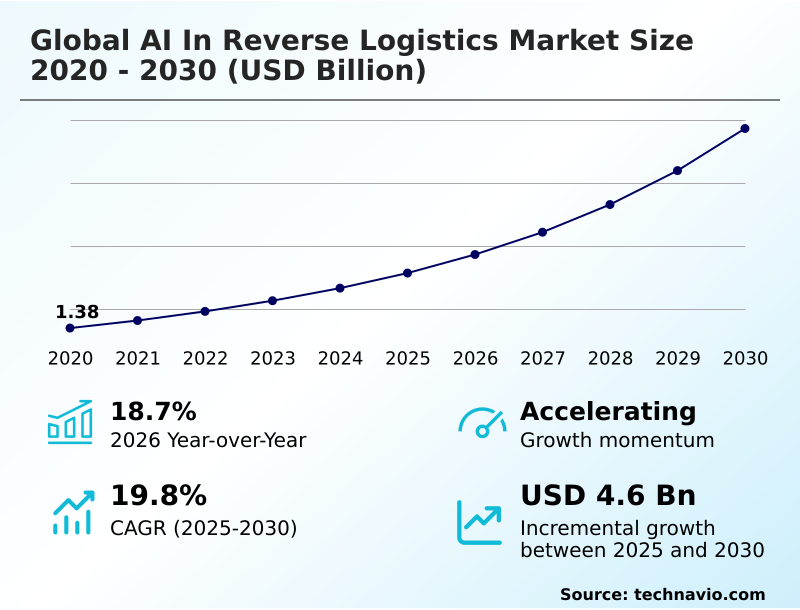
The ai in reverse logistics market size is valued to increase by USD 4.60 billion, at a CAGR of 19.8% from 2025 to 2030. Escalating complexity of global e-commerce returns will drive the ai in reverse logistics market.

Major Market Trends & Insights

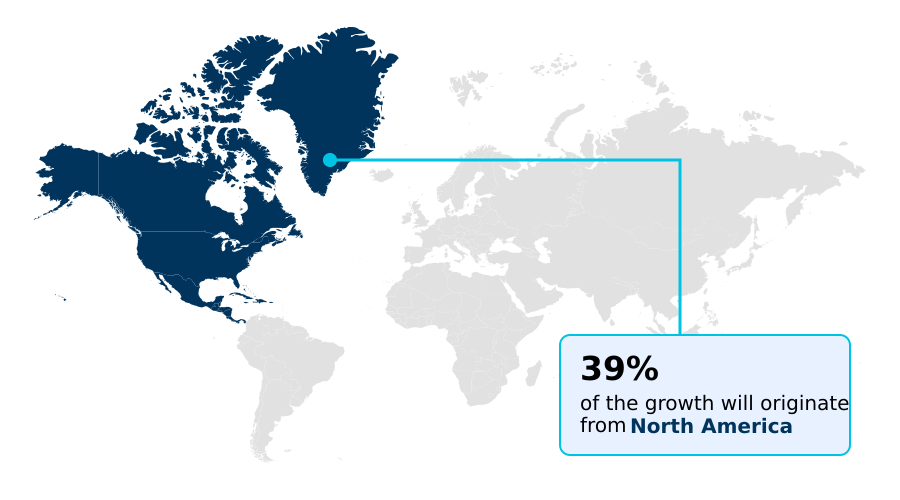
  • North America dominated the market and accounted for a 38.6% growth during the forecast period.
  • By Component - Software segment was valued at USD 1.56 billion in 2024
  • By Deployment - Cloud segment accounted for the largest market revenue share in 2024

Market Size & Forecast

  • Market Opportunities: USD 6.35 billion
  • Market Future Opportunities: USD 4.60 billion
  • CAGR from 2025 to 2030 : 19.8%

Market Summary

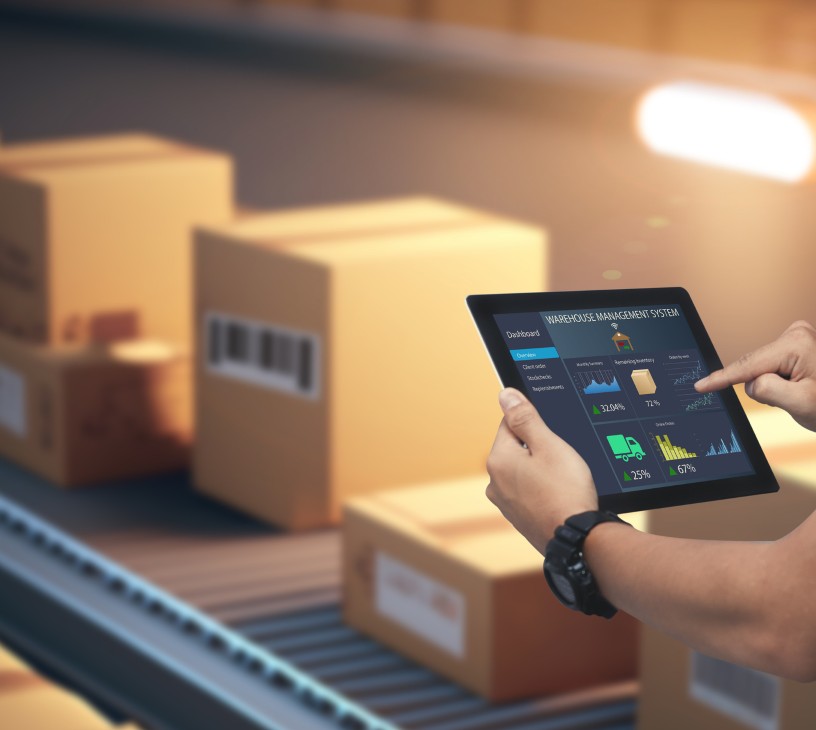
  • The AI in reverse logistics market represents a critical evolution in supply chain operations, driven by the need to manage the immense volume and complexity of product returns efficiently. Integrating advanced technologies such as machine learning and computer vision allows businesses to automate and optimize the entire returns lifecycle, from initial customer authorization to final product disposition.
  • Key drivers include the exponential growth of e-commerce, which has led to return rates far exceeding those of brick-and-mortar retail, and a growing regulatory and consumer push toward circular economy models. These intelligent systems use predictive returns analytics to forecast return volumes and return pattern analysis for AI for returns reduction.
  • For instance, a large electronics retailer can use an AI-powered returns platform for automated product grading, identifying whether a returned smartphone is suitable for immediate resale, refurbishment, or parts harvesting, thereby maximizing return value recovery.
  • While high initial investment and data integration issues present challenges, the move toward returns processing automation and AI-driven returns is essential for maintaining profitability and sustainability.

What will be the Size of the AI In Reverse Logistics Market during the forecast period?

Get Key Insights on Market Forecast (PDF) Request Free Sample

How is the AI In Reverse Logistics Market Segmented?

The ai in reverse logistics industry research report provides comprehensive data (region-wise segment analysis), with forecasts and estimates in "USD million" for the period 2026-2030, as well as historical data from 2020-2024 for the following segments.

  • Component
    • Software
    • Services
    • Hardware
  • Deployment
    • Cloud
    • On-premises
  • Application
    • Returns management and authorization
    • Transportation and route optimization
    • Inventory and warehouse management
    • Product inspection and sorting
    • Others
  • Geography
    • North America
      • US
      • Canada
      • Mexico
    • Europe
      • Germany
      • UK
      • France
    • APAC
      • China
      • India
      • Japan
    • South America
      • Brazil
      • Argentina
      • Colombia
    • Middle East and Africa
      • Saudi Arabia
      • UAE
      • Turkey
    • Rest of World (ROW)

By Component Insights

The software segment is estimated to witness significant growth during the forecast period.

The software segment is the core intelligence layer, powering warehouse automation and enabling sophisticated automated returns processing. An effective AI-powered returns platform uses return pattern analysis to forecast return volumes and reasons, allowing for proactive inventory adjustments.

These returns data analysis platforms are crucial for smart returns management, helping businesses transition toward AI for supply chain circularity by providing the data needed for intelligent disposition decisions.

The deployment of advanced AI in logistics automation has demonstrated the capacity to reduce manual assessment errors by over 15%, directly enhancing value recovery. This technology transforms returns from a cost center into a strategic, data-driven operation.

Request Free Sample

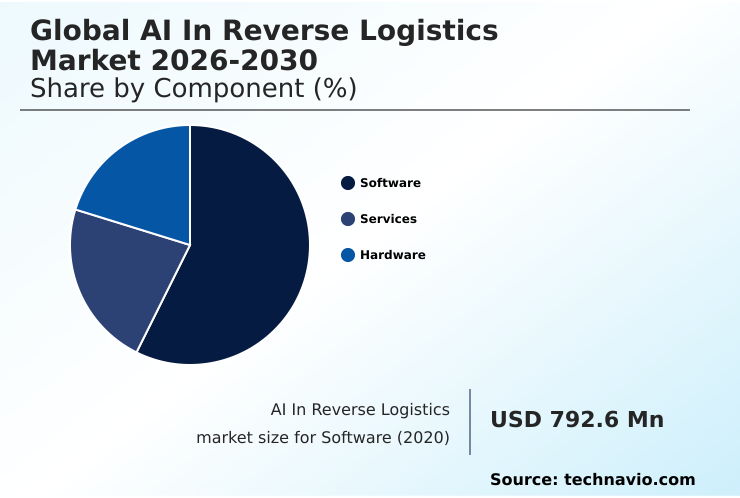
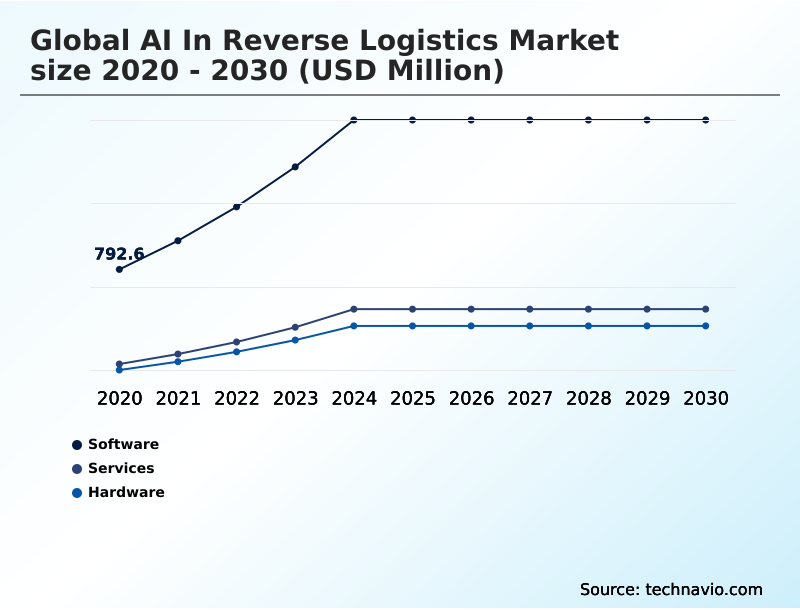
The Software segment was valued at USD 1.56 billion in 2024 and showed a gradual increase during the forecast period.

Request Free Sample

Regional Analysis

North America is estimated to contribute 38.6% to the growth of the global market during the forecast period.Technavio’s analysts have elaborately explained the regional trends and drivers that shape the market during the forecast period.

See How AI In Reverse Logistics Market Demand is Rising in North America Request Free Sample

The geographic landscape shows varied adoption maturity. North America leads in reverse supply chain management, driven by its massive e-commerce scale, with investments in autonomous mobile robots and automated product grading to manage high labor costs.

This focus on AI in warehouse returns has led to a 30% increase in processing throughput in some facilities.

In contrast, Europe's adoption of reverse logistics technology is heavily influenced by regulations promoting circular economy AI applications, leading to a greater emphasis on supply chain visibility and lifecycle tracking.

APAC is rapidly adopting returns processing automation to manage its fast-growing digital markets. The global AI in reverse logistics market is thus shaped by regional economic drivers and regulatory priorities.

Market Dynamics

Our researchers analyzed the data with 2025 as the base year, along with the key drivers, trends, and challenges. A holistic analysis of drivers will help companies refine their marketing strategies to gain a competitive advantage.

  • Evaluating an AI returns management platform features reveals that the core benefits stem from a combination of cost reduction and efficiency gains. For businesses exploring AI in reverse logistics market cost reduction, the implementation of AI for circular economy supply chain models is paramount.
  • This approach uses an AI platform for e-commerce returns to streamline workflows, directly impacting the bottom line. A key technology is AI computer vision for product grading, which automates a previously manual and error-prone task.
  • The overall automated returns management system benefits are clear, particularly when comparing returns optimization software comparison metrics, which often show a significant reduction in processing time. For example, using AI for reducing return processing time has been shown to be over 40% faster than traditional methods.
  • The implementing AI in reverse logistics journey also involves leveraging predictive analytics for return forecasting and generative AI for customer returns to enhance customer experience. This leads to higher AI in reverse logistics market efficiency and a stronger reverse logistics automation ROI.
  • Firms now prioritize AI for sustainable reverse logistics, with intelligent returns platform case studies demonstrating a clear path to both profitability and environmental responsibility.

What are the key market drivers leading to the rise in the adoption of AI In Reverse Logistics Industry?

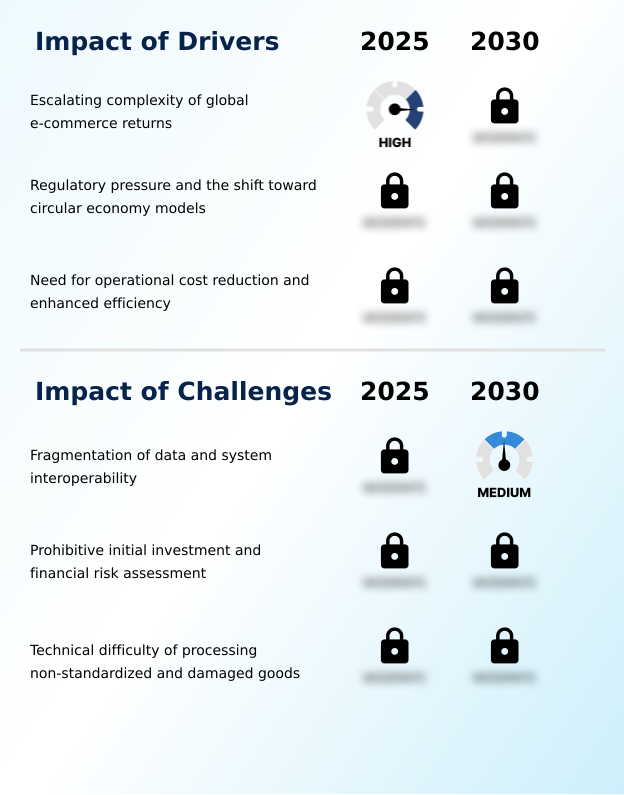
  • The escalating complexity and volume of global e-commerce returns are primary drivers for adopting intelligent automation in reverse logistics.

  • The escalating volume of e-commerce returns is a primary catalyst for adopting reverse logistics AI solutions.
  • Businesses are leveraging predictive returns analytics for optimizing returns with AI, which can reduce return rates at the point of sale by up to 10% through better sizing recommendations.
  • The strategic push toward circular economy logistics and sustainability mandates the use of AI-driven returns to identify refurbishment and recycling opportunities.
  • Modern returns management software is central to this shift, providing the tools for reverse logistics optimization and enabling effective e-commerce returns management AI.
  • These platforms not only improve operational efficiency but are also critical for AI for returns reduction, transforming the returns process into a value-generating activity.

What are the market trends shaping the AI In Reverse Logistics Industry?

  • The integration of generative AI is creating hyper-personalized return experiences. This trend shifts returns management from a standardized process to a dynamic, customer-centric interaction.

  • Key trends are redefining operational capabilities. The use of multi-spectral imaging inspection enables automated, granular assessment of returned items, improving grading accuracy by over 25% compared to manual methods. This precision, a core component of intelligent returns management, directly boosts return value recovery. Concurrently, the convergence of AI with the digital product passport creates a transparent lifecycle record.
  • Generative AI for customer returns is personalizing the user experience, while AI-driven disposition logic and integrated returns fraud prevention AI optimize financial outcomes. These advancements, including intelligent returns routing, provide the AI-powered returns intelligence necessary for firms to turn a logistical challenge into a competitive advantage.

What challenges does the AI In Reverse Logistics Industry face during its growth?

  • The fragmentation of data across incompatible legacy systems and a lack of interoperability present a key challenge to effective AI implementation.

  • A significant challenge is data fragmentation, which hampers the effectiveness of predictive analytics for returns and machine learning for reverse logistics. Without standardized data, even advanced robotic sorting systems and AI-powered product inspection tools cannot perform optimally, with accuracy sometimes dropping by 20% when handling non-standardized goods.
  • Implementing a cohesive disposition decision engine requires integrating siloed data from return merchandise authorization and other systems. The high capital cost of automated returns handling technology and the complexity of achieving logistics network optimization create financial barriers. Successfully deploying comprehensive returns data analytics requires modernizing legacy infrastructures, a costly but necessary step for full automation.

Exclusive Technavio Analysis on Customer Landscape

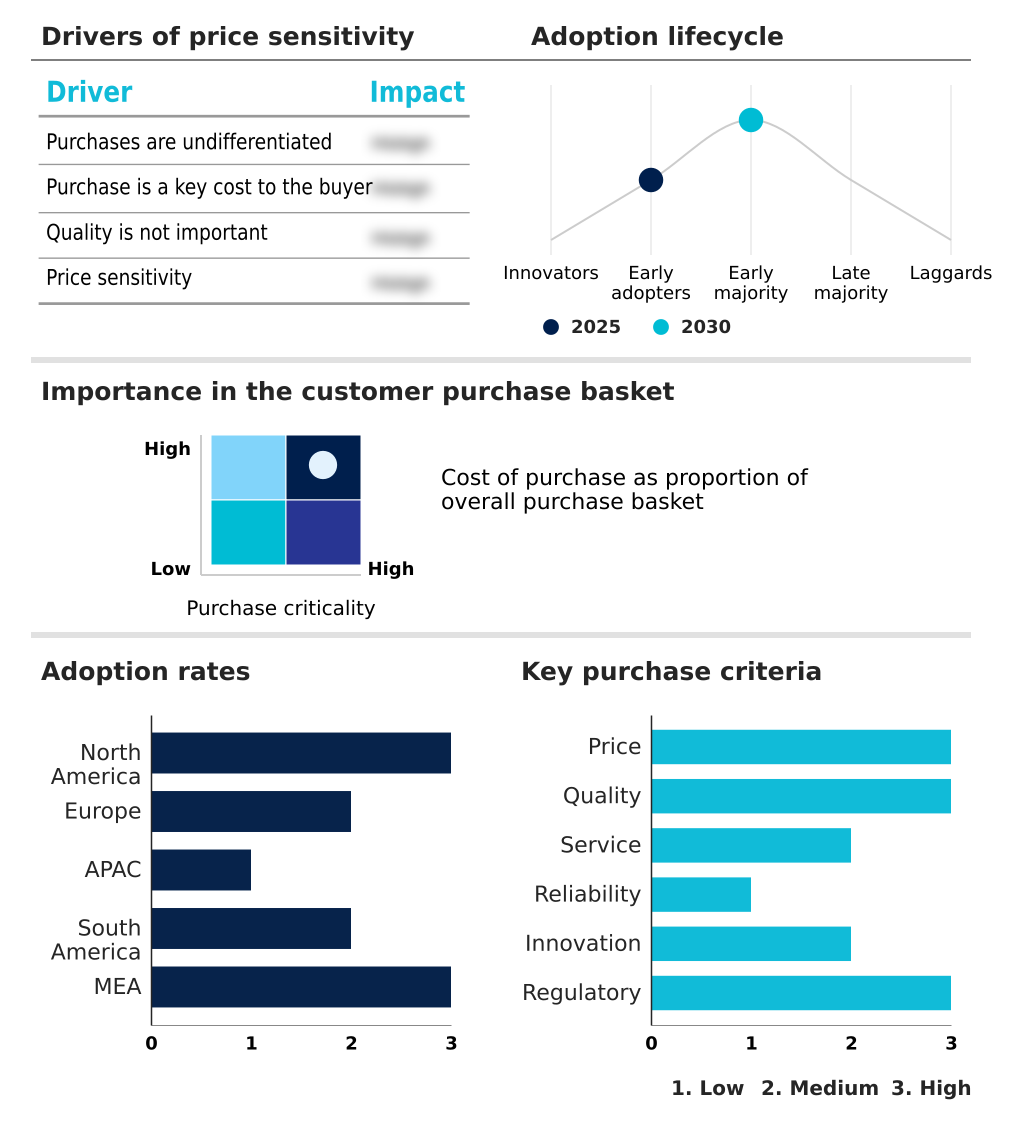
The ai in reverse logistics market forecasting report includes the adoption lifecycle of the market, covering from the innovator’s stage to the laggard’s stage. It focuses on adoption rates in different regions based on penetration. Furthermore, the ai in reverse logistics market report also includes key purchase criteria and drivers of price sensitivity to help companies evaluate and develop their market growth analysis strategies.

Customer Landscape of AI In Reverse Logistics Industry

Competitive Landscape

Companies are implementing various strategies, such as strategic alliances, ai in reverse logistics market forecast, partnerships, mergers and acquisitions, geographical expansion, and product/service launches, to enhance their presence in the industry.

Amazon Web Services Inc. - The company offers AI in reverse logistics through cloud-based machine learning, predictive analytics, and automation tools that enable intelligent returns processing, routing optimization, and inventory reintegration workflows.

The industry research and growth report includes detailed analyses of the competitive landscape of the market and information about key companies, including:

  • Amazon Web Services Inc.
  • Blue Yonder Group Inc.
  • DHL International GmbH
  • FarEye Technologies Pvt. Ltd.
  • FedEx Corp.
  • GXO Logistics Inc.
  • IBM Corp.
  • Kinaxis Inc.
  • Locus Robotics Corp.
  • Loop Returns
  • Manhattan Associates Inc.
  • Microsoft Corp.
  • Narvar Inc.
  • Oracle Corp.
  • Parcel Perform Pte Ltd.
  • ReBound Returns
  • ReturnLogic.
  • ReverseLogix
  • SAP SE
  • United Parcel Service Inc.

Qualitative and quantitative analysis of companies has been conducted to help clients understand the wider business environment as well as the strengths and weaknesses of key industry players. Data is qualitatively analyzed to categorize companies as pure play, category-focused, industry-focused, and diversified; it is quantitatively analyzed to categorize companies as dominant, leading, strong, tentative, and weak.

Recent Development and News in Ai in reverse logistics market

  • In May 2025, OmniChannel Dynamics, a global leader in digital marketplace technology, introduced an advanced machine learning framework designed to analyze the return habits of users across different geographical regions.
  • In June 2025, RetailFlow Solutions, a leading global provider of enterprise software for the retail sector, introduced a generative intelligence module that allows businesses to automate complex return negotiations through natural language interfaces.
  • In August 2025, AutoCycle Innovations, a major European automotive manufacturer, announced the implementation of an AI-driven material recovery system designed to identify and sort high-value alloys from returned vehicle components.
  • In September 2025, Vision Systems Lab, a prominent research laboratory in East Asia, in collaboration with a major industrial sensor manufacturer, unveiled a prototype for an automated inspection station that uses short-wave infrared imaging to verify the authenticity and internal integrity of high-end consumer electronics.

Dive into Technavio’s robust research methodology, blending expert interviews, extensive data synthesis, and validated models for unparalleled AI In Reverse Logistics Market insights. See full methodology.

Market Scope
Page number 306
Base year 2025
Historic period 2020-2024
Forecast period 2026-2030
Growth momentum & CAGR Accelerate at a CAGR of 19.8%
Market growth 2026-2030 USD 4602.5 million
Market structure Fragmented
YoY growth 2025-2026(%) 18.7%
Key countries US, Canada, Mexico, Germany, UK, France, The Netherlands, Italy, Spain, China, India, Japan, South Korea, Australia, Indonesia, Brazil, Argentina, Colombia, Saudi Arabia, UAE, Turkey, South Africa and Egypt
Competitive landscape Leading Companies, Market Positioning of Companies, Competitive Strategies, and Industry Risks

Request Free Sample

Research Analyst Overview

  • The market is rapidly evolving from a cost-center management function to a strategic, value-generating operation powered by AI-driven returns. The integration of sophisticated technologies such as autonomous mobile robots and multi-spectral imaging inspection for automated product grading is becoming a key differentiator.
  • A core component is the disposition decision engine, which uses predictive returns analytics and return pattern analysis for reverse logistics optimization. Boardroom decisions are increasingly influenced by the capabilities of intelligent returns management systems to support circular economy logistics and enhance supply chain visibility.
  • The implementation of a comprehensive AI-powered returns platform can lead to a 25% improvement in return value recovery. Successful strategies now depend on robust returns data analytics and warehouse automation to manage everything from return merchandise authorization to the final intelligent disposition, underpinned by effective returns management software and automated returns processing.

What are the Key Data Covered in this AI In Reverse Logistics Market Research and Growth Report?

  • What is the expected growth of the AI In Reverse Logistics Market between 2026 and 2030?

    • USD 4.60 billion, at a CAGR of 19.8%

  • What segmentation does the market report cover?

    • The report is segmented by Component (Software, Services, and Hardware), Deployment (Cloud, and On-premises), Application (Returns management and authorization, Transportation and route optimization, Inventory and warehouse management, Product inspection and sorting, and Others) and Geography (North America, Europe, APAC, South America, Middle East and Africa)

  • Which regions are analyzed in the report?

    • North America, Europe, APAC, South America and Middle East and Africa

  • What are the key growth drivers and market challenges?

    • Escalating complexity of global e-commerce returns, Fragmentation of data and system interoperability

  • Who are the major players in the AI In Reverse Logistics Market?

    • Amazon Web Services Inc., Blue Yonder Group Inc., DHL International GmbH, FarEye Technologies Pvt. Ltd., FedEx Corp., GXO Logistics Inc., IBM Corp., Kinaxis Inc., Locus Robotics Corp., Loop Returns, Manhattan Associates Inc., Microsoft Corp., Narvar Inc., Oracle Corp., Parcel Perform Pte Ltd., ReBound Returns, ReturnLogic., ReverseLogix, SAP SE and United Parcel Service Inc.

Market Research Insights

  • Market dynamics are shaped by the dual pressures of operational cost reduction and the strategic need for sustainability. The adoption of automated returns handling has shown a direct correlation with improved profitability, with some firms reporting a 15% reduction in processing costs per unit.
  • Predictive analytics for returns is becoming standard, enabling AI-powered returns intelligence that helps businesses anticipate and manage return volumes more effectively. The shift toward AI in warehouse returns has led to efficiency gains where throughput has increased by over 30% without physical expansion.
  • Furthermore, the focus on circular economy AI applications is not just a compliance measure; it is a value driver, turning a potential loss into a new revenue stream through effective machine learning for reverse logistics.

We can help! Our analysts can customize this ai in reverse logistics market research report to meet your requirements.

Get in touch

1. Executive Summary

1.1 Market overview

Executive Summary - Chart on Market Overview
Executive Summary - Data Table on Market Overview
Executive Summary - Chart on Global Market Characteristics
Executive Summary - Chart on Market by Geography
Executive Summary - Chart on Market Segmentation by Component
Executive Summary - Chart on Market Segmentation by Deployment
Executive Summary - Chart on Market Segmentation by Application
Executive Summary - Chart on Incremental Growth
Executive Summary - Data Table on Incremental Growth
Executive Summary - Chart on Company Market Positioning

2. Technavio Analysis

2.1 Analysis of price sensitivity, lifecycle, customer purchase basket, adoption rates, and purchase criteria

2.2 Criticality of inputs and Factors of differentiation

Chart on Overview on criticality of inputs and factors of differentiation

2.3 Factors of disruption

Chart on Overview on factors of disruption

2.4 Impact of drivers and challenges

Chart on Impact of drivers and challenges in 2025 and 2030

3. Market Landscape

3.1 Market ecosystem

Chart on Parent Market
Data Table on - Parent Market

3.2 Market characteristics

Chart on Market characteristics analysis

3.3 Value chain analysis

Chart on Value chain analysis

4. Market Sizing

4.1 Market definition

Data Table on Offerings of companies included in the market definition

4.2 Market segment analysis

Market segments

4.3 Market size 2025

4.4 Market outlook: Forecast for 2025-2030

Chart on Global - Market size and forecast 2025-2030 ($ million)
Data Table on Global - Market size and forecast 2025-2030 ($ million)
Chart on Global Market: Year-over-year growth 2025-2030 (%)
Data Table on Global Market: Year-over-year growth 2025-2030 (%)

5. Historic Market Size

5.1 Global AI In Reverse Logistics Market 2020 - 2024

Historic Market Size - Data Table on Global AI In Reverse Logistics Market 2020 - 2024 ($ million)

5.2 Component segment analysis 2020 - 2024

Historic Market Size - Component Segment 2020 - 2024 ($ million)

5.3 Deployment segment analysis 2020 - 2024

Historic Market Size - Deployment Segment 2020 - 2024 ($ million)

5.4 Application segment analysis 2020 - 2024

Historic Market Size - Application Segment 2020 - 2024 ($ million)

5.5 Geography segment analysis 2020 - 2024

Historic Market Size - Geography Segment 2020 - 2024 ($ million)

5.6 Country segment analysis 2020 - 2024

Historic Market Size - Country Segment 2020 - 2024 ($ million)

6. Qualitative Analysis

6.1 Impact of geopolitical conflicts on Global AI In Reverse Logistics Market

7. Five Forces Analysis

7.1 Five forces summary

Five forces analysis - Comparison between 2025 and 2030

7.2 Bargaining power of buyers

Bargaining power of buyers - Impact of key factors 2025 and 2030

7.3 Bargaining power of suppliers

Bargaining power of suppliers - Impact of key factors in 2025 and 2030

7.4 Threat of new entrants

Threat of new entrants - Impact of key factors in 2025 and 2030

7.5 Threat of substitutes

Threat of substitutes - Impact of key factors in 2025 and 2030

7.6 Threat of rivalry

Threat of rivalry - Impact of key factors in 2025 and 2030

7.7 Market condition

Chart on Market condition - Five forces 2025 and 2030

8. Market Segmentation by Component

8.1 Market segments

Chart on Component - Market share 2025-2030 (%)
Data Table on Component - Market share 2025-2030 (%)

8.2 Comparison by Component

Chart on Comparison by Component
Data Table on Comparison by Component

8.3 Software - Market size and forecast 2025-2030

Chart on Software - Market size and forecast 2025-2030 ($ million)
Data Table on Software - Market size and forecast 2025-2030 ($ million)
Chart on Software - Year-over-year growth 2025-2030 (%)
Data Table on Software - Year-over-year growth 2025-2030 (%)

8.4 Services - Market size and forecast 2025-2030

Chart on Services - Market size and forecast 2025-2030 ($ million)
Data Table on Services - Market size and forecast 2025-2030 ($ million)
Chart on Services - Year-over-year growth 2025-2030 (%)
Data Table on Services - Year-over-year growth 2025-2030 (%)

8.5 Hardware - Market size and forecast 2025-2030

Chart on Hardware - Market size and forecast 2025-2030 ($ million)
Data Table on Hardware - Market size and forecast 2025-2030 ($ million)
Chart on Hardware - Year-over-year growth 2025-2030 (%)
Data Table on Hardware - Year-over-year growth 2025-2030 (%)

8.6 Market opportunity by Component

Market opportunity by Component ($ million)
Data Table on Market opportunity by Component ($ million)

9. Market Segmentation by Deployment

9.1 Market segments

Chart on Deployment - Market share 2025-2030 (%)
Data Table on Deployment - Market share 2025-2030 (%)

9.2 Comparison by Deployment

Chart on Comparison by Deployment
Data Table on Comparison by Deployment

9.3 Cloud - Market size and forecast 2025-2030

Chart on Cloud - Market size and forecast 2025-2030 ($ million)
Data Table on Cloud - Market size and forecast 2025-2030 ($ million)
Chart on Cloud - Year-over-year growth 2025-2030 (%)
Data Table on Cloud - Year-over-year growth 2025-2030 (%)

9.4 On-premises - Market size and forecast 2025-2030

Chart on On-premises - Market size and forecast 2025-2030 ($ million)
Data Table on On-premises - Market size and forecast 2025-2030 ($ million)
Chart on On-premises - Year-over-year growth 2025-2030 (%)
Data Table on On-premises - Year-over-year growth 2025-2030 (%)

9.5 Market opportunity by Deployment

Market opportunity by Deployment ($ million)
Data Table on Market opportunity by Deployment ($ million)

10. Market Segmentation by Application

10.1 Market segments

Chart on Application - Market share 2025-2030 (%)
Data Table on Application - Market share 2025-2030 (%)

10.2 Comparison by Application

Chart on Comparison by Application
Data Table on Comparison by Application

10.3 Returns management and authorization - Market size and forecast 2025-2030

Chart on Returns management and authorization - Market size and forecast 2025-2030 ($ million)
Data Table on Returns management and authorization - Market size and forecast 2025-2030 ($ million)
Chart on Returns management and authorization - Year-over-year growth 2025-2030 (%)
Data Table on Returns management and authorization - Year-over-year growth 2025-2030 (%)

10.4 Transportation and route optimization - Market size and forecast 2025-2030

Chart on Transportation and route optimization - Market size and forecast 2025-2030 ($ million)
Data Table on Transportation and route optimization - Market size and forecast 2025-2030 ($ million)
Chart on Transportation and route optimization - Year-over-year growth 2025-2030 (%)
Data Table on Transportation and route optimization - Year-over-year growth 2025-2030 (%)

10.5 Inventory and warehouse management - Market size and forecast 2025-2030

Chart on Inventory and warehouse management - Market size and forecast 2025-2030 ($ million)
Data Table on Inventory and warehouse management - Market size and forecast 2025-2030 ($ million)
Chart on Inventory and warehouse management - Year-over-year growth 2025-2030 (%)
Data Table on Inventory and warehouse management - Year-over-year growth 2025-2030 (%)

10.6 Product inspection and sorting - Market size and forecast 2025-2030

Chart on Product inspection and sorting - Market size and forecast 2025-2030 ($ million)
Data Table on Product inspection and sorting - Market size and forecast 2025-2030 ($ million)
Chart on Product inspection and sorting - Year-over-year growth 2025-2030 (%)
Data Table on Product inspection and sorting - Year-over-year growth 2025-2030 (%)

10.7 Others - Market size and forecast 2025-2030

Chart on Others - Market size and forecast 2025-2030 ($ million)
Data Table on Others - Market size and forecast 2025-2030 ($ million)
Chart on Others - Year-over-year growth 2025-2030 (%)
Data Table on Others - Year-over-year growth 2025-2030 (%)

10.8 Market opportunity by Application

Market opportunity by Application ($ million)
Data Table on Market opportunity by Application ($ million)

11. Customer Landscape

11.1 Customer landscape overview

Analysis of price sensitivity, lifecycle, customer purchase basket, adoption rates, and purchase criteria

12. Geographic Landscape

12.1 Geographic segmentation

Chart on Market share by geography 2025-2030 (%)
Data Table on Market share by geography 2025-2030 (%)

12.2 Geographic comparison

Chart on Geographic comparison
Data Table on Geographic comparison

12.3 North America - Market size and forecast 2025-2030

Chart on North America - Market size and forecast 2025-2030 ($ million)
Data Table on North America - Market size and forecast 2025-2030 ($ million)
Chart on North America - Year-over-year growth 2025-2030 (%)
Data Table on North America - Year-over-year growth 2025-2030 (%)
Chart on Regional Comparison - North America
Data Table on Regional Comparison - North America

12.3.1 US - Market size and forecast 2025-2030

Chart on US - Market size and forecast 2025-2030 ($ million)
Data Table on US - Market size and forecast 2025-2030 ($ million)
Chart on US - Year-over-year growth 2025-2030 (%)
Data Table on US - Year-over-year growth 2025-2030 (%)

12.3.2 Canada - Market size and forecast 2025-2030

Chart on Canada - Market size and forecast 2025-2030 ($ million)
Data Table on Canada - Market size and forecast 2025-2030 ($ million)
Chart on Canada - Year-over-year growth 2025-2030 (%)
Data Table on Canada - Year-over-year growth 2025-2030 (%)

12.3.3 Mexico - Market size and forecast 2025-2030

Chart on Mexico - Market size and forecast 2025-2030 ($ million)
Data Table on Mexico - Market size and forecast 2025-2030 ($ million)
Chart on Mexico - Year-over-year growth 2025-2030 (%)
Data Table on Mexico - Year-over-year growth 2025-2030 (%)

12.4 Europe - Market size and forecast 2025-2030

Chart on Europe - Market size and forecast 2025-2030 ($ million)
Data Table on Europe - Market size and forecast 2025-2030 ($ million)
Chart on Europe - Year-over-year growth 2025-2030 (%)
Data Table on Europe - Year-over-year growth 2025-2030 (%)
Chart on Regional Comparison - Europe
Data Table on Regional Comparison - Europe

12.4.1 Germany - Market size and forecast 2025-2030

Chart on Germany - Market size and forecast 2025-2030 ($ million)
Data Table on Germany - Market size and forecast 2025-2030 ($ million)
Chart on Germany - Year-over-year growth 2025-2030 (%)
Data Table on Germany - Year-over-year growth 2025-2030 (%)

12.4.2 UK - Market size and forecast 2025-2030

Chart on UK - Market size and forecast 2025-2030 ($ million)
Data Table on UK - Market size and forecast 2025-2030 ($ million)
Chart on UK - Year-over-year growth 2025-2030 (%)
Data Table on UK - Year-over-year growth 2025-2030 (%)

12.4.3 France - Market size and forecast 2025-2030

Chart on France - Market size and forecast 2025-2030 ($ million)
Data Table on France - Market size and forecast 2025-2030 ($ million)
Chart on France - Year-over-year growth 2025-2030 (%)
Data Table on France - Year-over-year growth 2025-2030 (%)

12.4.4 The Netherlands - Market size and forecast 2025-2030

Chart on The Netherlands - Market size and forecast 2025-2030 ($ million)
Data Table on The Netherlands - Market size and forecast 2025-2030 ($ million)
Chart on The Netherlands - Year-over-year growth 2025-2030 (%)
Data Table on The Netherlands - Year-over-year growth 2025-2030 (%)

12.4.5 Italy - Market size and forecast 2025-2030

Chart on Italy - Market size and forecast 2025-2030 ($ million)
Data Table on Italy - Market size and forecast 2025-2030 ($ million)
Chart on Italy - Year-over-year growth 2025-2030 (%)
Data Table on Italy - Year-over-year growth 2025-2030 (%)

12.4.6 Spain - Market size and forecast 2025-2030

Chart on Spain - Market size and forecast 2025-2030 ($ million)
Data Table on Spain - Market size and forecast 2025-2030 ($ million)
Chart on Spain - Year-over-year growth 2025-2030 (%)
Data Table on Spain - Year-over-year growth 2025-2030 (%)

12.5 APAC - Market size and forecast 2025-2030

Chart on APAC - Market size and forecast 2025-2030 ($ million)
Data Table on APAC - Market size and forecast 2025-2030 ($ million)
Chart on APAC - Year-over-year growth 2025-2030 (%)
Data Table on APAC - Year-over-year growth 2025-2030 (%)
Chart on Regional Comparison - APAC
Data Table on Regional Comparison - APAC

12.5.1 China - Market size and forecast 2025-2030

Chart on China - Market size and forecast 2025-2030 ($ million)
Data Table on China - Market size and forecast 2025-2030 ($ million)
Chart on China - Year-over-year growth 2025-2030 (%)
Data Table on China - Year-over-year growth 2025-2030 (%)

12.5.2 India - Market size and forecast 2025-2030

Chart on India - Market size and forecast 2025-2030 ($ million)
Data Table on India - Market size and forecast 2025-2030 ($ million)
Chart on India - Year-over-year growth 2025-2030 (%)
Data Table on India - Year-over-year growth 2025-2030 (%)

12.5.3 Japan - Market size and forecast 2025-2030

Chart on Japan - Market size and forecast 2025-2030 ($ million)
Data Table on Japan - Market size and forecast 2025-2030 ($ million)
Chart on Japan - Year-over-year growth 2025-2030 (%)
Data Table on Japan - Year-over-year growth 2025-2030 (%)

12.5.4 South Korea - Market size and forecast 2025-2030

Chart on South Korea - Market size and forecast 2025-2030 ($ million)
Data Table on South Korea - Market size and forecast 2025-2030 ($ million)
Chart on South Korea - Year-over-year growth 2025-2030 (%)
Data Table on South Korea - Year-over-year growth 2025-2030 (%)

12.5.5 Australia - Market size and forecast 2025-2030

Chart on Australia - Market size and forecast 2025-2030 ($ million)
Data Table on Australia - Market size and forecast 2025-2030 ($ million)
Chart on Australia - Year-over-year growth 2025-2030 (%)
Data Table on Australia - Year-over-year growth 2025-2030 (%)

12.5.6 Indonesia - Market size and forecast 2025-2030

Chart on Indonesia - Market size and forecast 2025-2030 ($ million)
Data Table on Indonesia - Market size and forecast 2025-2030 ($ million)
Chart on Indonesia - Year-over-year growth 2025-2030 (%)
Data Table on Indonesia - Year-over-year growth 2025-2030 (%)

12.6 South America - Market size and forecast 2025-2030

Chart on South America - Market size and forecast 2025-2030 ($ million)
Data Table on South America - Market size and forecast 2025-2030 ($ million)
Chart on South America - Year-over-year growth 2025-2030 (%)
Data Table on South America - Year-over-year growth 2025-2030 (%)
Chart on Regional Comparison - South America
Data Table on Regional Comparison - South America

12.6.1 Brazil - Market size and forecast 2025-2030

Chart on Brazil - Market size and forecast 2025-2030 ($ million)
Data Table on Brazil - Market size and forecast 2025-2030 ($ million)
Chart on Brazil - Year-over-year growth 2025-2030 (%)
Data Table on Brazil - Year-over-year growth 2025-2030 (%)

12.6.2 Argentina - Market size and forecast 2025-2030

Chart on Argentina - Market size and forecast 2025-2030 ($ million)
Data Table on Argentina - Market size and forecast 2025-2030 ($ million)
Chart on Argentina - Year-over-year growth 2025-2030 (%)
Data Table on Argentina - Year-over-year growth 2025-2030 (%)

12.6.3 Colombia - Market size and forecast 2025-2030

Chart on Colombia - Market size and forecast 2025-2030 ($ million)
Data Table on Colombia - Market size and forecast 2025-2030 ($ million)
Chart on Colombia - Year-over-year growth 2025-2030 (%)
Data Table on Colombia - Year-over-year growth 2025-2030 (%)

12.7 Middle East and Africa - Market size and forecast 2025-2030

Chart on Middle East and Africa - Market size and forecast 2025-2030 ($ million)
Data Table on Middle East and Africa - Market size and forecast 2025-2030 ($ million)
Chart on Middle East and Africa - Year-over-year growth 2025-2030 (%)
Data Table on Middle East and Africa - Year-over-year growth 2025-2030 (%)
Chart on Regional Comparison - Middle East and Africa
Data Table on Regional Comparison - Middle East and Africa

12.7.1 Saudi Arabia - Market size and forecast 2025-2030

Chart on Saudi Arabia - Market size and forecast 2025-2030 ($ million)
Data Table on Saudi Arabia - Market size and forecast 2025-2030 ($ million)
Chart on Saudi Arabia - Year-over-year growth 2025-2030 (%)
Data Table on Saudi Arabia - Year-over-year growth 2025-2030 (%)

12.7.2 UAE - Market size and forecast 2025-2030

Chart on UAE - Market size and forecast 2025-2030 ($ million)
Data Table on UAE - Market size and forecast 2025-2030 ($ million)
Chart on UAE - Year-over-year growth 2025-2030 (%)
Data Table on UAE - Year-over-year growth 2025-2030 (%)

12.7.3 Turkey - Market size and forecast 2025-2030

Chart on Turkey - Market size and forecast 2025-2030 ($ million)
Data Table on Turkey - Market size and forecast 2025-2030 ($ million)
Chart on Turkey - Year-over-year growth 2025-2030 (%)
Data Table on Turkey - Year-over-year growth 2025-2030 (%)

12.7.4 South Africa - Market size and forecast 2025-2030

Chart on South Africa - Market size and forecast 2025-2030 ($ million)
Data Table on South Africa - Market size and forecast 2025-2030 ($ million)
Chart on South Africa - Year-over-year growth 2025-2030 (%)
Data Table on South Africa - Year-over-year growth 2025-2030 (%)

12.7.5 Egypt - Market size and forecast 2025-2030

Chart on Egypt - Market size and forecast 2025-2030 ($ million)
Data Table on Egypt - Market size and forecast 2025-2030 ($ million)
Chart on Egypt - Year-over-year growth 2025-2030 (%)
Data Table on Egypt - Year-over-year growth 2025-2030 (%)

12.8 Market opportunity by geography

Market opportunity by geography ($ million)
Data Tables on Market opportunity by geography ($ million)

13. Drivers, Challenges, and Opportunity

13.1 Market drivers

Escalating complexity of global e-commerce returns
Regulatory pressure and the shift toward circular economy models
Need for operational cost reduction and enhanced efficiency

13.2 Market challenges

Fragmentation of data and system interoperability
Prohibitive initial investment and financial risk assessment
Technical difficulty of processing non-standardized and damaged goods

13.3 Impact of drivers and challenges

Impact of drivers and challenges in 2025 and 2030

13.4 Market opportunities

Integration of generative AI for hyper-personalized return experiences:
Advanced computer vision and multi-spectral imaging for precision grading
AI-driven circularity and the implementation of digital product passports

14. Competitive Landscape

14.1 Overview

14.2

Overview on criticality of inputs and factors of differentiation

14.3 Landscape disruption

Overview on factors of disruption

14.4 Industry risks

Impact of key risks on business

15. Competitive Analysis

15.1 Companies profiled

Companies covered

15.2 Company ranking index

15.3 Market positioning of companies

Matrix on companies position and classification

15.4 Amazon Web Services Inc.

Amazon Web Services Inc. - Overview
Amazon Web Services Inc. - Product / Service
Amazon Web Services Inc. - Key offerings
SWOT

15.5 DHL International GmbH

DHL International GmbH - Overview
DHL International GmbH - Business segments
DHL International GmbH - Key news
DHL International GmbH - Key offerings
DHL International GmbH - Segment focus
SWOT

15.6 FedEx Corp.

FedEx Corp. - Overview
FedEx Corp. - Business segments
FedEx Corp. - Key offerings
FedEx Corp. - Segment focus
SWOT

15.7 GXO Logistics Inc.

GXO Logistics Inc. - Overview
GXO Logistics Inc. - Product / Service
GXO Logistics Inc. - Key offerings
SWOT

15.8 IBM Corp.

IBM Corp. - Overview
IBM Corp. - Business segments
IBM Corp. - Key news
IBM Corp. - Key offerings
IBM Corp. - Segment focus
SWOT

15.9 Kinaxis Inc.

Kinaxis Inc. - Overview
Kinaxis Inc. - Product / Service
Kinaxis Inc. - Key offerings
SWOT

15.10 Locus Robotics Corp.

Locus Robotics Corp. - Overview
Locus Robotics Corp. - Product / Service
Locus Robotics Corp. - Key offerings
SWOT

15.11 Manhattan Associates Inc.

Manhattan Associates Inc. - Overview
Manhattan Associates Inc. - Business segments
Manhattan Associates Inc. - Key offerings
Manhattan Associates Inc. - Segment focus
SWOT

15.12 Microsoft Corp.

Microsoft Corp. - Overview
Microsoft Corp. - Business segments
Microsoft Corp. - Key news
Microsoft Corp. - Key offerings
Microsoft Corp. - Segment focus
SWOT

15.13 Narvar Inc.

Narvar Inc. - Overview
Narvar Inc. - Product / Service
Narvar Inc. - Key offerings
SWOT

15.14 Oracle Corp.

Oracle Corp. - Overview
Oracle Corp. - Business segments
Oracle Corp. - Key news
Oracle Corp. - Key offerings
Oracle Corp. - Segment focus
SWOT

15.15 Parcel Perform Pte Ltd.

Parcel Perform Pte Ltd. - Overview
Parcel Perform Pte Ltd. - Product / Service
Parcel Perform Pte Ltd. - Key offerings
SWOT

15.16 ReturnLogic.

ReturnLogic. - Overview
ReturnLogic. - Product / Service
ReturnLogic. - Key offerings
SWOT

15.17 SAP SE

SAP SE - Overview
SAP SE - Business segments
SAP SE - Key news
SAP SE - Key offerings
SAP SE - Segment focus
SWOT

15.18 United Parcel Service Inc.

United Parcel Service Inc. - Overview
United Parcel Service Inc. - Business segments
United Parcel Service Inc. - Key offerings
United Parcel Service Inc. - Segment focus
SWOT

16. Appendix

16.1 Scope of the report

Market definition
Objectives
Notes and caveats

16.2 Inclusions and exclusions checklist

Inclusions checklist
Exclusions checklist

16.3 Currency conversion rates for US$

16.4 Research methodology

16.5 Data procurement

Information sources

16.6 Data validation

16.7 Validation techniques employed for market sizing

16.8 Data synthesis

16.9 360 degree market analysis

16.10 List of abbreviations

Research Methodology

Technavio presents a detailed picture of the market by way of study, synthesis, and summation of data from multiple sources. The analysts have presented the various facets of the market with a particular focus on identifying the key industry influencers. The data thus presented is comprehensive, reliable, and the result of extensive research, both primary and secondary.

INFORMATION SOURCES

Primary sources

  • Manufacturers and suppliers
  • Channel partners
  • Industry experts
  • Strategic decision makers

Secondary sources

  • Industry journals and periodicals
  • Government data
  • Financial reports of key industry players
  • Historical data
  • Press releases

DATA ANALYSIS

Data Synthesis

  • Collation of data
  • Estimation of key figures
  • Analysis of derived insights

Data Validation

  • Triangulation with data models
  • Reference against proprietary databases
  • Corroboration with industry experts

REPORT WRITING

Qualitative

  • Market drivers
  • Market challenges
  • Market trends
  • Five forces analysis

Quantitative

  • Market size and forecast
  • Market segmentation
  • Geographical insights
  • Competitive landscape

Interested in this report?

Get your sample now to see our research methodology and insights!

Download Now

Frequently Asked Questions

AI In Reverse Logistics market growth will increase by USD 4602.5 million during 2026-2030.

The AI In Reverse Logistics market is expected to grow at a CAGR of 19.8% during 2026-2030.

AI In Reverse Logistics market is segmented by Component (Software, Services, Hardware) Deployment (Cloud, On-premises) Application (Returns management and authorization, Transportation and route optimization, Inventory and warehouse management, Product inspection and sorting, Others)

Amazon Web Services Inc., Blue Yonder Group Inc., DHL International GmbH, FarEye Technologies Pvt. Ltd., FedEx Corp., GXO Logistics Inc., IBM Corp., Kinaxis Inc., Locus Robotics Corp., Loop Returns, Manhattan Associates Inc., Microsoft Corp., Narvar Inc., Oracle Corp., Parcel Perform Pte Ltd., ReBound Returns, ReturnLogic., ReverseLogix, SAP SE, United Parcel Service Inc. are a few of the key vendors in the AI In Reverse Logistics market.

North America will register the highest growth rate of 38.6% among the other regions. Therefore, the AI In Reverse Logistics market in North America is expected to garner significant business opportunities for the vendors during the forecast period.

US, Canada, Mexico, Germany, UK, France, The Netherlands, Italy, Spain, China, India, Japan, South Korea, Australia, Indonesia, Brazil, Argentina, Colombia, Saudi Arabia, UAE, Turkey, South Africa, Egypt

  • Escalating complexity of global e-commerce returns is the driving factor this market.

The AI In Reverse Logistics market vendors should focus on grabbing business opportunities from the Component segment as it accounted for the largest market share in the base year.
RIA - Research AI Assistant
Ask RIA