AI In Vision Market Analysis, Size, and Forecast 2025-2029: North America (US, Canada, and Mexico), APAC (China, Japan, and South Korea), Europe (Germany, UK, and France), Middle East and Africa (UAE, Saudi Arabia, and South Africa), South America (Brazil, Argentina, and Colombia), and Rest of World (ROW)

AI In Vision Market Analysis, Size, and Forecast 2025-2029:
North America (US, Canada, and Mexico), APAC (China, Japan, and South Korea), Europe (Germany, UK, and France), Middle East and Africa (UAE, Saudi Arabia, and South Africa), South America (Brazil, Argentina, and Colombia), and Rest of World (ROW)

Published: Dec 2025 304 Pages SKU: IRTNTR81016

Market Overview at a Glance

$34.80 B
Market Opportunity
17.6%
CAGR 2024 - 2029
31%
North America Growth
$11.75 B
Hardware segment 2023

AI In Vision Market Size 2025-2029

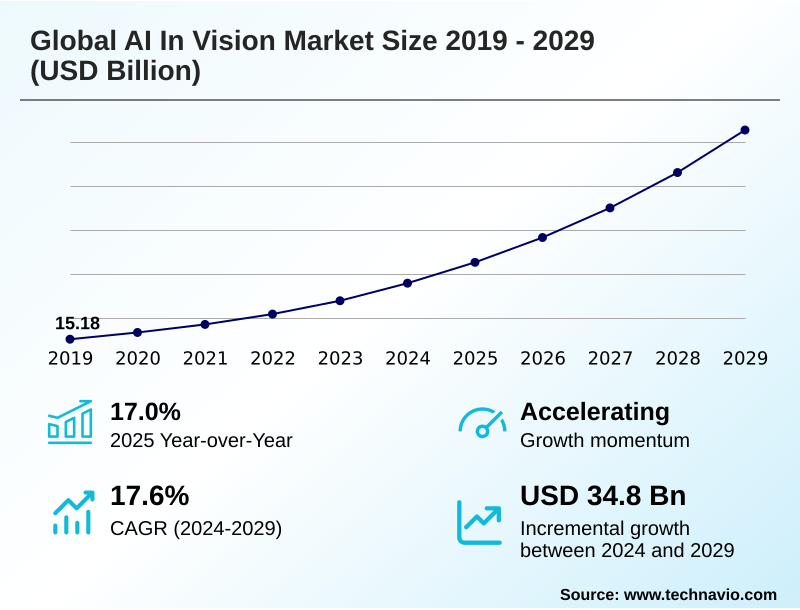
The ai in vision market size is valued to increase by USD 34.80 billion, at a CAGR of 17.6% from 2024 to 2029. Increasing demand for automation and Industry 4.0 integration will drive the ai in vision market.

Major Market Trends & Insights

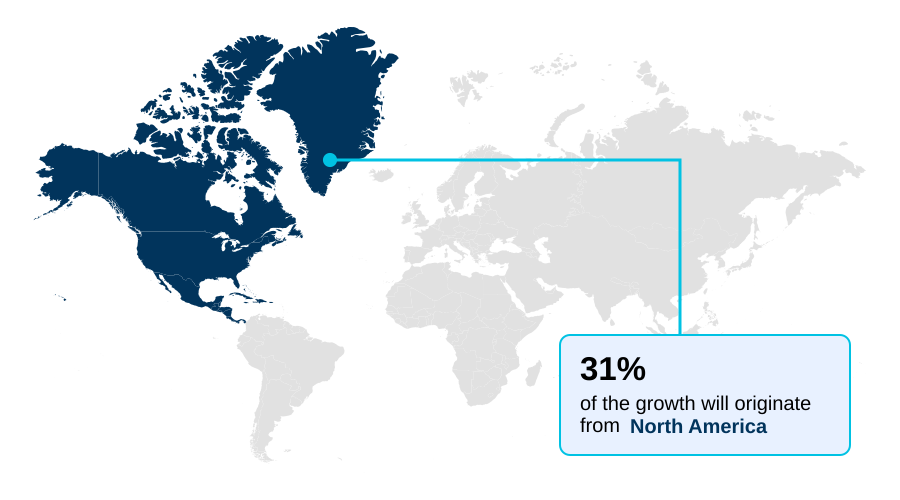
  • North America dominated the market and accounted for a 31% growth during the forecast period.
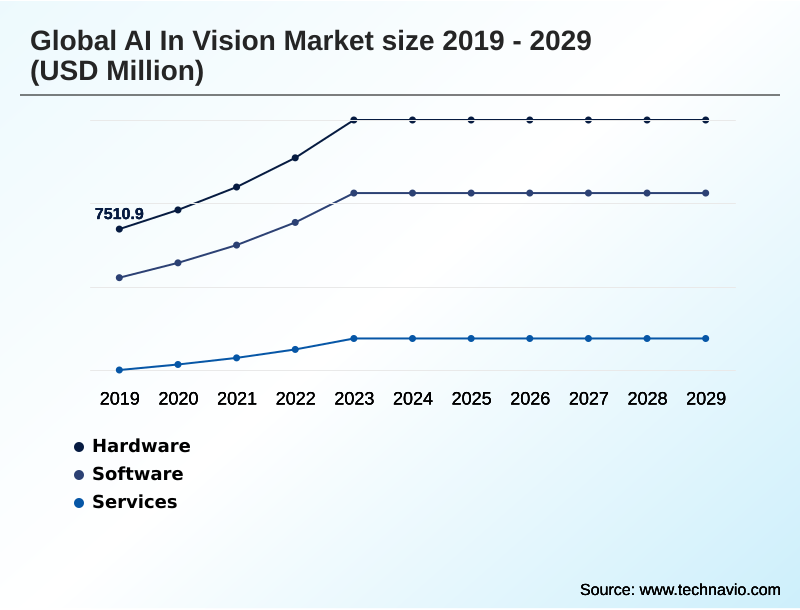
  • By Component - Hardware segment was valued at USD 11.75 billion in 2023
  • By Technology - Computer vision segment accounted for the largest market revenue share in 2023

Market Size & Forecast

  • Market Opportunities: USD 47.54 billion
  • Market Future Opportunities: USD 34.80 billion
  • CAGR from 2024 to 2029 : 17.6%

Market Summary

  • The AI in vision market is a transformative force enabling industries to derive actionable intelligence from visual data. At its core, the market is driven by the demand for automation in sectors like manufacturing, where automated quality control systems use deep learning models to identify microscopic defects with near-perfect accuracy, enhancing product quality and reducing waste.
  • The synergistic evolution of sophisticated computer vision algorithms, from convolutional neural networks to advanced vision transformers, and powerful, specialized hardware like graphics processing units and neural processing units, underpins this expansion. This enables a broad spectrum of applications, from advanced driver-assistance systems enhancing vehicle safety to AI in medical imaging analysis that aids in early disease detection.
  • However, the industry grapples with significant challenges, including the high cost of implementation, the need for vast, unbiased datasets, and navigating complex ethical and data privacy regulations. The rise of generative AI and on-device AI processing are key trends shaping the future, promising to lower barriers to entry and enable more responsive, secure, and context-aware applications across the board.

What will be the Size of the AI In Vision Market during the forecast period?

Get Key Insights on Market Forecast (PDF) Request Free Sample

How is the AI In Vision Market Segmented?

The ai in vision industry research report provides comprehensive data (region-wise segment analysis), with forecasts and estimates in "USD million" for the period 2025-2029, as well as historical data from 2019-2023 for the following segments.

  • Component
    • Hardware
    • Software
    • Services
  • Technology
    • Computer vision
    • Virtual reality
    • Augmented reality
    • Mixed reality
  • End-user
    • Manufacturing
    • Healthcare and life sciences
    • Automotive
    • Retail and e-commerce
    • Others
  • Geography
    • North America
      • US
      • Canada
      • Mexico
    • APAC
      • China
      • Japan
      • South Korea
    • Europe
      • Germany
      • UK
      • France
    • Middle East and Africa
      • UAE
      • Saudi Arabia
      • South Africa
    • South America
      • Brazil
      • Argentina
      • Colombia
    • Rest of World (ROW)

By Component Insights

The hardware segment is estimated to witness significant growth during the forecast period.

The hardware segment is the bedrock of the AI in vision market, comprising the specialized silicon that powers intensive machine learning tasks.

While graphics processing units remain essential for training large models, the primary growth catalyst is the proliferation of hardware for inference at the network periphery. This shift toward edge computing is crucial for applications demanding real-time responsiveness.

The development of systems on a chip that integrate dedicated neural processing units is accelerating this trend, enabling powerful on-device AI capabilities.

These custom application specific integrated circuits enable complex on-device AI processing, reducing response delays in driver monitoring systems and AR/VR with AI vision by over 60%.

This localized processing is essential for edge AI for low latency in safety-critical systems, AI for surgical robotics, and privacy-sensitive applications like facial recognition used in AI for public safety.

Request Free Sample

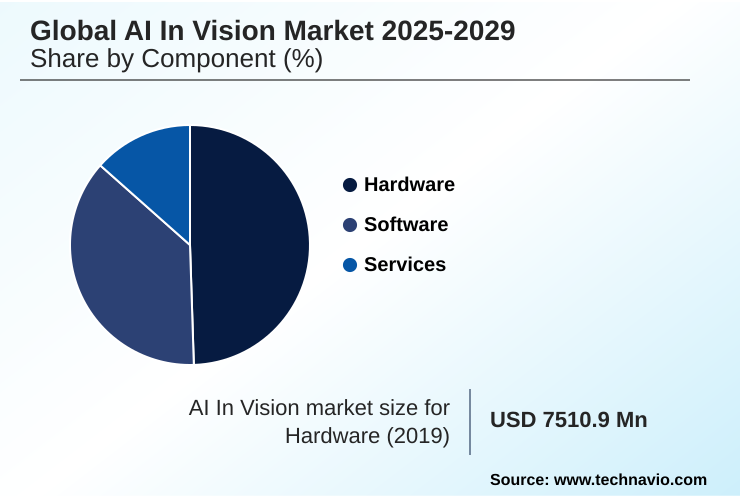
The Hardware segment was valued at USD 11.75 billion in 2023 and showed a gradual increase during the forecast period.

Request Free Sample

Regional Analysis

North America is estimated to contribute 31% to the growth of the global market during the forecast period.Technavio’s analysts have elaborately explained the regional trends and drivers that shape the market during the forecast period.

See How AI In Vision Market Demand is Rising in North America Request Free Sample

North America leads the AI in vision market, accounting for over 31% of incremental growth, driven by R&D in autonomous navigation systems and widespread adoption in healthcare and defense.

The region is a hub for spatial data analytics and digital twin technology.

In contrast, APAC is the fastest-growing market, propelled by smart city traffic management initiatives and a massive manufacturing base in China utilizing automated optical inspection for AI for supply chain optimization.

Europe’s market is distinguished by its strong industrial focus, with Germany’s Industry 4.0 strategy leveraging object detection and image classification for factory automation, improving production efficiency by 20%.

Applications like in-cabin monitoring in the automotive sector and image segmentation in medical diagnostics are key growth areas across mature regions, while emerging economies leverage the technology for AI in retail inventory management and even AI in sports analytics.

Market Dynamics

Our researchers analyzed the data with 2024 as the base year, along with the key drivers, trends, and challenges. A holistic analysis of drivers will help companies refine their marketing strategies to gain a competitive advantage.

  • Enterprises evaluating the adoption of advanced visual intelligence must weigh the cost of implementing AI vision systems against the significant operational returns. The ROI of autonomous retail stores, for instance, is increasingly clear, with some early adopters reporting a twofold increase in checkout efficiency.
  • A key architectural decision is the choice between edge AI vs cloud AI for video analytics; while cloud offers vast computational power, the need for real-time response is driving a definitive shift toward the edge, effectively reducing latency with edge AI vision in critical applications.
  • Technologically, the evolution is rapid, and it is important to understand how vision transformers improve object detection over older architectures. The use of generative AI for synthetic training data is becoming a standard practice to mitigate the challenges of AI model bias in vision and reduce data acquisition costs.
  • This is particularly relevant given the tightening regulatory landscape, where the impact of the EU AI act on vision market is forcing a greater focus on governance and transparency, especially concerning the ethical implications of facial recognition AI.
  • From using AI vision for predictive maintenance in factories to deploying 3D digital twin for industrial inspection and computer vision in precision agriculture drones, the applications are expanding.
  • Advances in on-device AI vision, powered by the role of NPUs in edge AI vision, are enabling new use cases in AI vision in autonomous driving safety and enhancing multimodal AI for customer experience.

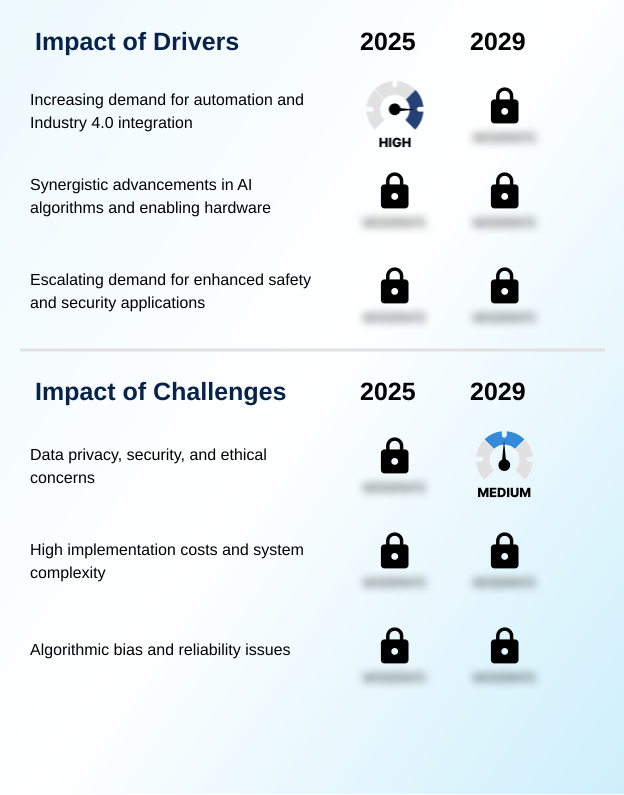
What are the key market drivers leading to the rise in the adoption of AI In Vision Industry?

  • The increasing demand for automation and deeper integration with Industry 4.0 initiatives serves as a key driver for the market.

  • The pursuit of automation and operational efficiency through AI for industrial automation is a primary market driver.
  • In smart factories, automated quality control systems powered by deep learning models identify defects with superhuman accuracy, with some deployments reducing error rates by over 95%.
  • Vision-guided robotics are transforming manufacturing floors, enabling precise vision-guided robotic assembly and AI in logistics automation. The synergy between innovative computer vision algorithms for tasks like activity recognition and specialized hardware underpins this growth.
  • The escalating demand for safety is another significant force, fueling the adoption of advanced driver-assistance systems and AI for predictive maintenance solutions.
  • These systems use real-time object detection and analysis to prevent accidents and equipment failures, improving AI in quality control and operational uptime by more than 25%.

What are the market trends shaping the AI In Vision Industry?

  • A significant market trend is the proliferation of generative AI within vision applications, expanding capabilities from data analysis to content creation.

  • A key trend is the rapid integration of generative AI, which enables the creation of new visual content and addresses data scarcity through synthetic data generation for AI. Models like vision transformers and multimodal foundation models are moving the market beyond simple analysis to active creation.
  • This has led to advancements in generative video and 3d scene reconstruction, revolutionizing generative AI in media creation. Multimodal AI applications and vision language models are enabling more intuitive human-robot interaction, where systems can understand visual and verbal commands contextually. This trend reduces model development time for AI-driven diagnostic tools by up to 40%.
  • The ability to create realistic simulations, such as a 3d digital twin for industrial inspection, allows for virtual system validation, reducing latency with edge AI vision during physical deployment.

What challenges does the AI In Vision Industry face during its growth?

  • Data privacy, security, and ethical concerns represent a key challenge affecting the industry's growth trajectory.

  • Significant challenges surround data privacy in AI vision, security, and the need for ethical AI deployment. The use of biometric identification in public spaces has sparked intense regulatory scrutiny, with error rate disparities in some legacy systems exceeding 30% across demographic groups. This issue of algorithmic bias, often rooted in non-representative training data, remains a fundamental hurdle.
  • The complexity and cost of implementation, including the labor-intensive process of data annotation and the capital for high-performance computing, constrain wider adoption. The 'black box' nature of many convolutional neural networks makes it difficult to audit for fairness, a critical requirement for applications like AI in medical imaging analysis or AI-powered video analytics.
  • Even with advanced techniques like foveated rendering and eye tracking improving efficiency, ensuring model reliability across diverse, real-world conditions for applications from frictionless checkout solutions to computer vision for smart agriculture and scene segmentation remains a persistent concern.

Exclusive Technavio Analysis on Customer Landscape

The ai in vision market forecasting report includes the adoption lifecycle of the market, covering from the innovator’s stage to the laggard’s stage. It focuses on adoption rates in different regions based on penetration. Furthermore, the ai in vision market report also includes key purchase criteria and drivers of price sensitivity to help companies evaluate and develop their market growth analysis strategies.

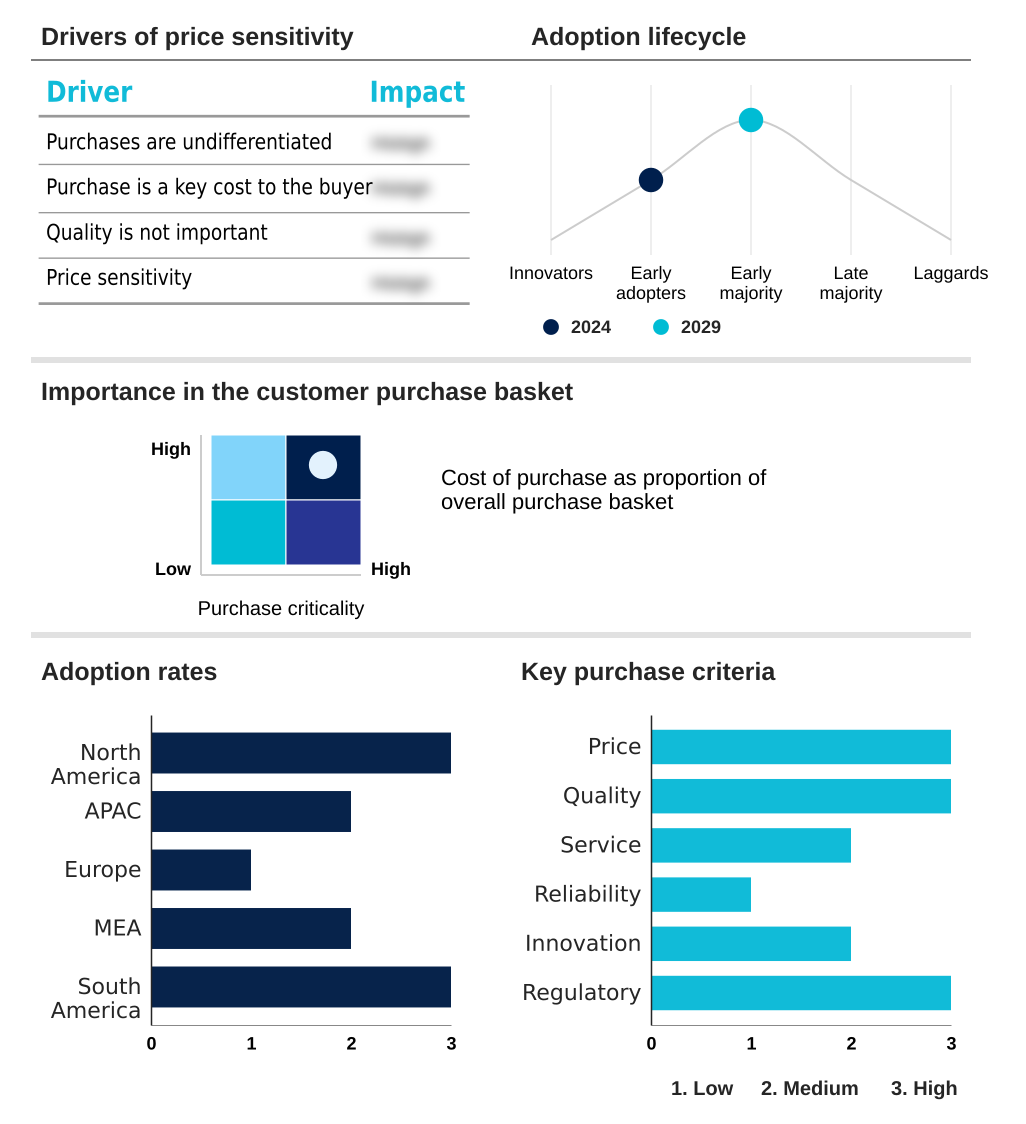
Customer Landscape of AI In Vision Industry

Competitive Landscape

Companies are implementing various strategies, such as strategic alliances, ai in vision market forecast, partnerships, mergers and acquisitions, geographical expansion, and product/service launches, to enhance their presence in the industry.

Amazon.com Inc. - Key offerings enable image analysis, facial recognition, and autonomous logistics through comprehensive cloud-based services, supporting enterprise-grade computer vision applications.

The industry research and growth report includes detailed analyses of the competitive landscape of the market and information about key companies, including:

  • Amazon.com Inc.
  • Apptronik Inc.
  • Cipia Vision Ltd.
  • Clarifai Inc.
  • Google LLC
  • Hawk Eye Innovations Ltd.
  • Imagga Technologies Ltd.
  • Intel Corp.
  • Magic Leap Inc.
  • Matterport Inc.
  • Meta Platforms Inc.
  • Microsoft Corp.
  • NVIDIA Corp.
  • Opencv.ai
  • Qualcomm Inc.
  • SenseTime Group Inc.
  • Trigo Vision Ltd.
  • viso.ai

Qualitative and quantitative analysis of companies has been conducted to help clients understand the wider business environment as well as the strengths and weaknesses of key industry players. Data is qualitatively analyzed to categorize companies as pure play, category-focused, industry-focused, and diversified; it is quantitatively analyzed to categorize companies as dominant, leading, strong, tentative, and weak.

Recent Development and News in Ai in vision market

  • In September, 2024, NVIDIA Corp. announced a strategic partnership with a leading automotive OEM to co-develop a centralized computing platform for Level 4 autonomous driving, leveraging its next-generation processors to fuse data from over 20 high-resolution cameras.
  • In November, 2024, Clarifai Inc. secured $150 million in Series D funding to expand its full-stack generative AI platform, focusing on the creation of high-fidelity synthetic data to train vision models for rare industrial and medical scenarios.
  • In February, 2025, the US Department of Commerce, following the lead of the EU's AI Act, published a new framework proposing stringent testing and transparency requirements for facial recognition technologies used in critical infrastructure and public safety applications.
  • In April, 2025, Qualcomm Inc. launched its new robotics chipset featuring a dedicated low-power neural processing unit capable of performing complex on-device visual-language tasks, reducing energy consumption for battery-powered drones and robots by 40%.

Dive into Technavio’s robust research methodology, blending expert interviews, extensive data synthesis, and validated models for unparalleled AI In Vision Market insights. See full methodology.

Market Scope
Page number 304
Base year 2024
Historic period 2019-2023
Forecast period 2025-2029
Growth momentum & CAGR Accelerate at a CAGR of 17.6%
Market growth 2025-2029 USD 34802.5 million
Market structure Fragmented
YoY growth 2024-2025(%) 17.0%
Key countries US, Canada, Mexico, China, Japan, South Korea, India, Australia, Indonesia, Germany, UK, France, Italy, Spain, The Netherlands, UAE, Saudi Arabia, South Africa, Israel, Turkey, Brazil, Argentina and Colombia
Competitive landscape Leading Companies, Market Positioning of Companies, Competitive Strategies, and Industry Risks

Request Free Sample

Research Analyst Overview

  • The AI in vision market is defined by a rapid and continuous cycle of innovation, fundamentally altering how industries interact with the physical world.
  • Boardroom decisions are increasingly influenced by the strategic shift toward edge computing, which necessitates capital investment in specialized systems on a chip and neural processing units but offers significant long-term ROI through reduced data transmission costs and enhanced data privacy.
  • The technological core of the market revolves around the evolution of deep learning models, including convolutional neural networks and vision transformers, which power a vast array of functions from basic image classification and object detection to complex scene segmentation and activity recognition. Applications such as automated quality control, advanced driver-assistance systems, and in-cabin monitoring are becoming standard.
  • This technology is powered by hardware like graphics processing units for training and application specific integrated circuits for deployment. Deployments of vision-guided robotics have shown to increase production throughput by over 25% in certain manufacturing settings. The expansion into generative AI, generative video, and multimodal perception is creating new frontiers, enabling more sophisticated natural user interfaces and spatial computing experiences.

What are the Key Data Covered in this AI In Vision Market Research and Growth Report?

  • What is the expected growth of the AI In Vision Market between 2025 and 2029?

    • USD 34.80 billion, at a CAGR of 17.6%

  • What segmentation does the market report cover?

    • The report is segmented by Component (Hardware, Software, Services), Technology (Computer vision, Virtual reality, Augmented reality, Mixed reality), End-user (Manufacturing, Healthcare and life sciences, Automotive, Retail and e-commerce, Others) and Geography (North America, APAC, Europe, Middle East and Africa, South America)

  • Which regions are analyzed in the report?

    • North America, APAC, Europe, Middle East and Africa and South America

  • What are the key growth drivers and market challenges?

    • Increasing demand for automation and Industry 4.0 integration, Data privacy, security, and ethical concerns

  • Who are the major players in the AI In Vision Market?

    • Amazon.com Inc., Apptronik Inc., Cipia Vision Ltd., Clarifai Inc., Google LLC, Hawk Eye Innovations Ltd., Imagga Technologies Ltd., Intel Corp., Magic Leap Inc., Matterport Inc., Meta Platforms Inc., Microsoft Corp., NVIDIA Corp., Opencv.ai, Qualcomm Inc., SenseTime Group Inc., Trigo Vision Ltd. and viso.ai

Market Research Insights

  • Market dynamics are increasingly shaped by the migration from cloud-based processing to on-device AI processing, a shift that addresses the critical need for low-latency decision-making. In applications such as autonomous navigation systems and vision-guided robotic assembly, this transition has reduced response times by over 60%, a crucial factor for safety and operational fluidity.
  • Concurrently, AI-powered video analytics is being deployed for smart city traffic management, optimizing traffic flow and decreasing congestion by up to 25% in pilot programs. In the commercial sector, AI in retail inventory management has enabled businesses to cut stockout incidents by nearly a third, directly enhancing customer satisfaction and sales.
  • These advancements, built on trends like multimodal AI applications and synthetic data generation for AI, highlight a clear business case driven by measurable efficiency gains and enhanced safety protocols.

We can help! Our analysts can customize this ai in vision market research report to meet your requirements.

Get in touch

1. Executive Summary

1.1 Market overview

Executive Summary - Chart on Market Overview
Executive Summary - Data Table on Market Overview
Executive Summary - Chart on Global Market Characteristics
Executive Summary - Chart on Market by Geography
Executive Summary - Chart on Market Segmentation by Component
Executive Summary - Chart on Market Segmentation by Technology
Executive Summary - Chart on Market Segmentation by End-user
Executive Summary - Chart on Incremental Growth
Executive Summary - Data Table on Incremental Growth
Executive Summary - Chart on Company Market Positioning

2. Technavio Analysis

2.1 Analysis of price sensitivity, lifecycle, customer purchase basket, adoption rates, and purchase criteria

2.2 Criticality of inputs and Factors of differentiation

Chart on Overview on criticality of inputs and factors of differentiation

2.3 Factors of disruption

Chart on Overview on factors of disruption

2.4 Impact of drivers and challenges

Chart on Impact of drivers and challenges in 2024 and 2029

3. Market Landscape

3.1 Market ecosystem

Chart on Parent Market
Data Table on - Parent Market

3.2 Market characteristics

Chart on Market characteristics analysis

3.3 Value chain analysis

Chart on Value chain analysis

4. Market Sizing

4.1 Market definition

Data Table on Offerings of companies included in the market definition

4.2 Market segment analysis

Market segments

4.3 Market size 2024

4.4 Market outlook: Forecast for 2024-2029

Chart on Global - Market size and forecast 2024-2029 ($ million)
Data Table on Global - Market size and forecast 2024-2029 ($ million)
Chart on Global Market: Year-over-year growth 2024-2029 (%)
Data Table on Global Market: Year-over-year growth 2024-2029 (%)

5. Historic Market Size

5.1 Global AI In Vision Market 2019 - 2023

Historic Market Size - Data Table on Global AI In Vision Market 2019 - 2023 ($ million)

5.2 Component segment analysis 2019 - 2023

Historic Market Size - Component Segment 2019 - 2023 ($ million)

5.3 Technology segment analysis 2019 - 2023

Historic Market Size - Technology Segment 2019 - 2023 ($ million)

5.4 End-user segment analysis 2019 - 2023

Historic Market Size - End-user Segment 2019 - 2023 ($ million)

5.5 Geography segment analysis 2019 - 2023

Historic Market Size - Geography Segment 2019 - 2023 ($ million)

5.6 Country segment analysis 2019 - 2023

Historic Market Size - Country Segment 2019 - 2023 ($ million)

6. Five Forces Analysis

6.1 Five forces summary

Five forces analysis - Comparison between 2024 and 2029

6.2 Bargaining power of buyers

Bargaining power of buyers - Impact of key factors 2024 and 2029

6.3 Bargaining power of suppliers

Bargaining power of suppliers - Impact of key factors in 2024 and 2029

6.4 Threat of new entrants

Threat of new entrants - Impact of key factors in 2024 and 2029

6.5 Threat of substitutes

Threat of substitutes - Impact of key factors in 2024 and 2029

6.6 Threat of rivalry

Threat of rivalry - Impact of key factors in 2024 and 2029

6.7 Market condition

Chart on Market condition - Five forces 2024 and 2029

7. Market Segmentation by Component

7.1 Market segments

Chart on Component - Market share 2024-2029 (%)
Data Table on Component - Market share 2024-2029 (%)

7.2 Comparison by Component

Chart on Comparison by Component
Data Table on Comparison by Component

7.3 Hardware - Market size and forecast 2024-2029

Chart on Hardware - Market size and forecast 2024-2029 ($ million)
Data Table on Hardware - Market size and forecast 2024-2029 ($ million)
Chart on Hardware - Year-over-year growth 2024-2029 (%)
Data Table on Hardware - Year-over-year growth 2024-2029 (%)

7.4 Software - Market size and forecast 2024-2029

Chart on Software - Market size and forecast 2024-2029 ($ million)
Data Table on Software - Market size and forecast 2024-2029 ($ million)
Chart on Software - Year-over-year growth 2024-2029 (%)
Data Table on Software - Year-over-year growth 2024-2029 (%)

7.5 Services - Market size and forecast 2024-2029

Chart on Services - Market size and forecast 2024-2029 ($ million)
Data Table on Services - Market size and forecast 2024-2029 ($ million)
Chart on Services - Year-over-year growth 2024-2029 (%)
Data Table on Services - Year-over-year growth 2024-2029 (%)

7.6 Market opportunity by Component

Market opportunity by Component ($ million)
Data Table on Market opportunity by Component ($ million)

8. Market Segmentation by Technology

8.1 Market segments

Chart on Technology - Market share 2024-2029 (%)
Data Table on Technology - Market share 2024-2029 (%)

8.2 Comparison by Technology

Chart on Comparison by Technology
Data Table on Comparison by Technology

8.3 Computer vision - Market size and forecast 2024-2029

Chart on Computer vision - Market size and forecast 2024-2029 ($ million)
Data Table on Computer vision - Market size and forecast 2024-2029 ($ million)
Chart on Computer vision - Year-over-year growth 2024-2029 (%)
Data Table on Computer vision - Year-over-year growth 2024-2029 (%)

8.4 Virtual reality - Market size and forecast 2024-2029

Chart on Virtual reality - Market size and forecast 2024-2029 ($ million)
Data Table on Virtual reality - Market size and forecast 2024-2029 ($ million)
Chart on Virtual reality - Year-over-year growth 2024-2029 (%)
Data Table on Virtual reality - Year-over-year growth 2024-2029 (%)

8.5 Augmented reality - Market size and forecast 2024-2029

Chart on Augmented reality - Market size and forecast 2024-2029 ($ million)
Data Table on Augmented reality - Market size and forecast 2024-2029 ($ million)
Chart on Augmented reality - Year-over-year growth 2024-2029 (%)
Data Table on Augmented reality - Year-over-year growth 2024-2029 (%)

8.6 Mixed reality - Market size and forecast 2024-2029

Chart on Mixed reality - Market size and forecast 2024-2029 ($ million)
Data Table on Mixed reality - Market size and forecast 2024-2029 ($ million)
Chart on Mixed reality - Year-over-year growth 2024-2029 (%)
Data Table on Mixed reality - Year-over-year growth 2024-2029 (%)

8.7 Market opportunity by Technology

Market opportunity by Technology ($ million)
Data Table on Market opportunity by Technology ($ million)

9. Market Segmentation by End-user

9.1 Market segments

Chart on End-user - Market share 2024-2029 (%)
Data Table on End-user - Market share 2024-2029 (%)

9.2 Comparison by End-user

Chart on Comparison by End-user
Data Table on Comparison by End-user

9.3 Manufacturing - Market size and forecast 2024-2029

Chart on Manufacturing - Market size and forecast 2024-2029 ($ million)
Data Table on Manufacturing - Market size and forecast 2024-2029 ($ million)
Chart on Manufacturing - Year-over-year growth 2024-2029 (%)
Data Table on Manufacturing - Year-over-year growth 2024-2029 (%)

9.4 Healthcare and life sciences - Market size and forecast 2024-2029

Chart on Healthcare and life sciences - Market size and forecast 2024-2029 ($ million)
Data Table on Healthcare and life sciences - Market size and forecast 2024-2029 ($ million)
Chart on Healthcare and life sciences - Year-over-year growth 2024-2029 (%)
Data Table on Healthcare and life sciences - Year-over-year growth 2024-2029 (%)

9.5 Automotive - Market size and forecast 2024-2029

Chart on Automotive - Market size and forecast 2024-2029 ($ million)
Data Table on Automotive - Market size and forecast 2024-2029 ($ million)
Chart on Automotive - Year-over-year growth 2024-2029 (%)
Data Table on Automotive - Year-over-year growth 2024-2029 (%)

9.6 Retail and e-commerce - Market size and forecast 2024-2029

Chart on Retail and e-commerce - Market size and forecast 2024-2029 ($ million)
Data Table on Retail and e-commerce - Market size and forecast 2024-2029 ($ million)
Chart on Retail and e-commerce - Year-over-year growth 2024-2029 (%)
Data Table on Retail and e-commerce - Year-over-year growth 2024-2029 (%)

9.7 Others - Market size and forecast 2024-2029

Chart on Others - Market size and forecast 2024-2029 ($ million)
Data Table on Others - Market size and forecast 2024-2029 ($ million)
Chart on Others - Year-over-year growth 2024-2029 (%)
Data Table on Others - Year-over-year growth 2024-2029 (%)

9.8 Market opportunity by End-user

Market opportunity by End-user ($ million)
Data Table on Market opportunity by End-user ($ million)

10. Customer Landscape

10.1 Customer landscape overview

Analysis of price sensitivity, lifecycle, customer purchase basket, adoption rates, and purchase criteria

11. Geographic Landscape

11.1 Geographic segmentation

Chart on Market share by geography 2024-2029 (%)
Data Table on Market share by geography 2024-2029 (%)

11.2 Geographic comparison

Chart on Geographic comparison
Data Table on Geographic comparison

11.3 North America - Market size and forecast 2024-2029

Chart on North America - Market size and forecast 2024-2029 ($ million)
Data Table on North America - Market size and forecast 2024-2029 ($ million)
Chart on North America - Year-over-year growth 2024-2029 (%)
Data Table on North America - Year-over-year growth 2024-2029 (%)
Chart on Regional Comparison - North America
Data Table on Regional Comparison - North America

11.3.1 US - Market size and forecast 2024-2029

Chart on US - Market size and forecast 2024-2029 ($ million)
Data Table on US - Market size and forecast 2024-2029 ($ million)
Chart on US - Year-over-year growth 2024-2029 (%)
Data Table on US - Year-over-year growth 2024-2029 (%)

11.3.2 Canada - Market size and forecast 2024-2029

Chart on Canada - Market size and forecast 2024-2029 ($ million)
Data Table on Canada - Market size and forecast 2024-2029 ($ million)
Chart on Canada - Year-over-year growth 2024-2029 (%)
Data Table on Canada - Year-over-year growth 2024-2029 (%)

11.3.3 Mexico - Market size and forecast 2024-2029

Chart on Mexico - Market size and forecast 2024-2029 ($ million)
Data Table on Mexico - Market size and forecast 2024-2029 ($ million)
Chart on Mexico - Year-over-year growth 2024-2029 (%)
Data Table on Mexico - Year-over-year growth 2024-2029 (%)

11.4 APAC - Market size and forecast 2024-2029

Chart on APAC - Market size and forecast 2024-2029 ($ million)
Data Table on APAC - Market size and forecast 2024-2029 ($ million)
Chart on APAC - Year-over-year growth 2024-2029 (%)
Data Table on APAC - Year-over-year growth 2024-2029 (%)
Chart on Regional Comparison - APAC
Data Table on Regional Comparison - APAC

11.4.1 China - Market size and forecast 2024-2029

Chart on China - Market size and forecast 2024-2029 ($ million)
Data Table on China - Market size and forecast 2024-2029 ($ million)
Chart on China - Year-over-year growth 2024-2029 (%)
Data Table on China - Year-over-year growth 2024-2029 (%)

11.4.2 Japan - Market size and forecast 2024-2029

Chart on Japan - Market size and forecast 2024-2029 ($ million)
Data Table on Japan - Market size and forecast 2024-2029 ($ million)
Chart on Japan - Year-over-year growth 2024-2029 (%)
Data Table on Japan - Year-over-year growth 2024-2029 (%)

11.4.3 South Korea - Market size and forecast 2024-2029

Chart on South Korea - Market size and forecast 2024-2029 ($ million)
Data Table on South Korea - Market size and forecast 2024-2029 ($ million)
Chart on South Korea - Year-over-year growth 2024-2029 (%)
Data Table on South Korea - Year-over-year growth 2024-2029 (%)

11.4.4 India - Market size and forecast 2024-2029

Chart on India - Market size and forecast 2024-2029 ($ million)
Data Table on India - Market size and forecast 2024-2029 ($ million)
Chart on India - Year-over-year growth 2024-2029 (%)
Data Table on India - Year-over-year growth 2024-2029 (%)

11.4.5 Australia - Market size and forecast 2024-2029

Chart on Australia - Market size and forecast 2024-2029 ($ million)
Data Table on Australia - Market size and forecast 2024-2029 ($ million)
Chart on Australia - Year-over-year growth 2024-2029 (%)
Data Table on Australia - Year-over-year growth 2024-2029 (%)

11.4.6 Indonesia - Market size and forecast 2024-2029

Chart on Indonesia - Market size and forecast 2024-2029 ($ million)
Data Table on Indonesia - Market size and forecast 2024-2029 ($ million)
Chart on Indonesia - Year-over-year growth 2024-2029 (%)
Data Table on Indonesia - Year-over-year growth 2024-2029 (%)

11.5 Europe - Market size and forecast 2024-2029

Chart on Europe - Market size and forecast 2024-2029 ($ million)
Data Table on Europe - Market size and forecast 2024-2029 ($ million)
Chart on Europe - Year-over-year growth 2024-2029 (%)
Data Table on Europe - Year-over-year growth 2024-2029 (%)
Chart on Regional Comparison - Europe
Data Table on Regional Comparison - Europe

11.5.1 Germany - Market size and forecast 2024-2029

Chart on Germany - Market size and forecast 2024-2029 ($ million)
Data Table on Germany - Market size and forecast 2024-2029 ($ million)
Chart on Germany - Year-over-year growth 2024-2029 (%)
Data Table on Germany - Year-over-year growth 2024-2029 (%)

11.5.2 UK - Market size and forecast 2024-2029

Chart on UK - Market size and forecast 2024-2029 ($ million)
Data Table on UK - Market size and forecast 2024-2029 ($ million)
Chart on UK - Year-over-year growth 2024-2029 (%)
Data Table on UK - Year-over-year growth 2024-2029 (%)

11.5.3 France - Market size and forecast 2024-2029

Chart on France - Market size and forecast 2024-2029 ($ million)
Data Table on France - Market size and forecast 2024-2029 ($ million)
Chart on France - Year-over-year growth 2024-2029 (%)
Data Table on France - Year-over-year growth 2024-2029 (%)

11.5.4 Italy - Market size and forecast 2024-2029

Chart on Italy - Market size and forecast 2024-2029 ($ million)
Data Table on Italy - Market size and forecast 2024-2029 ($ million)
Chart on Italy - Year-over-year growth 2024-2029 (%)
Data Table on Italy - Year-over-year growth 2024-2029 (%)

11.5.5 Spain - Market size and forecast 2024-2029

Chart on Spain - Market size and forecast 2024-2029 ($ million)
Data Table on Spain - Market size and forecast 2024-2029 ($ million)
Chart on Spain - Year-over-year growth 2024-2029 (%)
Data Table on Spain - Year-over-year growth 2024-2029 (%)

11.5.6 The Netherlands - Market size and forecast 2024-2029

Chart on The Netherlands - Market size and forecast 2024-2029 ($ million)
Data Table on The Netherlands - Market size and forecast 2024-2029 ($ million)
Chart on The Netherlands - Year-over-year growth 2024-2029 (%)
Data Table on The Netherlands - Year-over-year growth 2024-2029 (%)

11.6 Middle East and Africa - Market size and forecast 2024-2029

Chart on Middle East and Africa - Market size and forecast 2024-2029 ($ million)
Data Table on Middle East and Africa - Market size and forecast 2024-2029 ($ million)
Chart on Middle East and Africa - Year-over-year growth 2024-2029 (%)
Data Table on Middle East and Africa - Year-over-year growth 2024-2029 (%)
Chart on Regional Comparison - Middle East and Africa
Data Table on Regional Comparison - Middle East and Africa

11.6.1 UAE - Market size and forecast 2024-2029

Chart on UAE - Market size and forecast 2024-2029 ($ million)
Data Table on UAE - Market size and forecast 2024-2029 ($ million)
Chart on UAE - Year-over-year growth 2024-2029 (%)
Data Table on UAE - Year-over-year growth 2024-2029 (%)

11.6.2 Saudi Arabia - Market size and forecast 2024-2029

Chart on Saudi Arabia - Market size and forecast 2024-2029 ($ million)
Data Table on Saudi Arabia - Market size and forecast 2024-2029 ($ million)
Chart on Saudi Arabia - Year-over-year growth 2024-2029 (%)
Data Table on Saudi Arabia - Year-over-year growth 2024-2029 (%)

11.6.3 South Africa - Market size and forecast 2024-2029

Chart on South Africa - Market size and forecast 2024-2029 ($ million)
Data Table on South Africa - Market size and forecast 2024-2029 ($ million)
Chart on South Africa - Year-over-year growth 2024-2029 (%)
Data Table on South Africa - Year-over-year growth 2024-2029 (%)

11.6.4 Israel - Market size and forecast 2024-2029

Chart on Israel - Market size and forecast 2024-2029 ($ million)
Data Table on Israel - Market size and forecast 2024-2029 ($ million)
Chart on Israel - Year-over-year growth 2024-2029 (%)
Data Table on Israel - Year-over-year growth 2024-2029 (%)

11.6.5 Turkey - Market size and forecast 2024-2029

Chart on Turkey - Market size and forecast 2024-2029 ($ million)
Data Table on Turkey - Market size and forecast 2024-2029 ($ million)
Chart on Turkey - Year-over-year growth 2024-2029 (%)
Data Table on Turkey - Year-over-year growth 2024-2029 (%)

11.7 South America - Market size and forecast 2024-2029

Chart on South America - Market size and forecast 2024-2029 ($ million)
Data Table on South America - Market size and forecast 2024-2029 ($ million)
Chart on South America - Year-over-year growth 2024-2029 (%)
Data Table on South America - Year-over-year growth 2024-2029 (%)
Chart on Regional Comparison - South America
Data Table on Regional Comparison - South America

11.7.1 Brazil - Market size and forecast 2024-2029

Chart on Brazil - Market size and forecast 2024-2029 ($ million)
Data Table on Brazil - Market size and forecast 2024-2029 ($ million)
Chart on Brazil - Year-over-year growth 2024-2029 (%)
Data Table on Brazil - Year-over-year growth 2024-2029 (%)

11.7.2 Argentina - Market size and forecast 2024-2029

Chart on Argentina - Market size and forecast 2024-2029 ($ million)
Data Table on Argentina - Market size and forecast 2024-2029 ($ million)
Chart on Argentina - Year-over-year growth 2024-2029 (%)
Data Table on Argentina - Year-over-year growth 2024-2029 (%)

11.7.3 Colombia - Market size and forecast 2024-2029

Chart on Colombia - Market size and forecast 2024-2029 ($ million)
Data Table on Colombia - Market size and forecast 2024-2029 ($ million)
Chart on Colombia - Year-over-year growth 2024-2029 (%)
Data Table on Colombia - Year-over-year growth 2024-2029 (%)

11.8 Market opportunity by geography

Market opportunity by geography ($ million)
Data Tables on Market opportunity by geography ($ million)

12. Drivers, Challenges, and Opportunity

12.1 Market drivers

Increasing demand for automation and Industry 4.0 integration
Synergistic advancements in AI algorithms and enabling hardware
Escalating demand for enhanced safety and security applications

12.2 Market challenges

Data privacy, security, and ethical concerns
High implementation costs and system complexity
Algorithmic bias and reliability issues

12.3 Impact of drivers and challenges

Impact of drivers and challenges in 2024 and 2029

12.4 Market opportunities

Proliferation of generative AI in vision applications
Accelerated shift from cloud-centric processing to edge AI
Rapid adoption of multimodal AI and vision-language foundation models

13. Competitive Landscape

13.1 Overview

13.2

Overview on criticality of inputs and factors of differentiation

13.3 Landscape disruption

Overview on factors of disruption

13.4 Industry risks

Impact of key risks on business

14. Competitive Analysis

14.1 Companies profiled

Companies covered

14.2 Company ranking index

14.3 Market positioning of companies

Matrix on companies position and classification

14.4 Amazon.com Inc.

Amazon.com Inc. - Overview
Amazon.com Inc. - Business segments
Amazon.com Inc. - Key news
Amazon.com Inc. - Key offerings
Amazon.com Inc. - Segment focus
SWOT

14.5 Cipia Vision Ltd.

Cipia Vision Ltd. - Overview
Cipia Vision Ltd. - Product / Service
Cipia Vision Ltd. - Key offerings
SWOT

14.6 Clarifai Inc.

Clarifai Inc. - Overview
Clarifai Inc. - Product / Service
Clarifai Inc. - Key offerings
SWOT

14.7 Google LLC

Google LLC - Overview
Google LLC - Product / Service
Google LLC - Key offerings
SWOT

14.8 Imagga Technologies Ltd.

Imagga Technologies Ltd. - Overview
Imagga Technologies Ltd. - Product / Service
Imagga Technologies Ltd. - Key offerings
SWOT

14.9 Intel Corp.

Intel Corp. - Overview
Intel Corp. - Business segments
Intel Corp. - Key news
Intel Corp. - Key offerings
Intel Corp. - Segment focus
SWOT

14.10 Matterport Inc.

Matterport Inc. - Overview
Matterport Inc. - Product / Service
Matterport Inc. - Key offerings
SWOT

14.11 Meta Platforms Inc.

Meta Platforms Inc. - Overview
Meta Platforms Inc. - Business segments
Meta Platforms Inc. - Key offerings
Meta Platforms Inc. - Segment focus
SWOT

14.12 Microsoft Corp.

Microsoft Corp. - Overview
Microsoft Corp. - Business segments
Microsoft Corp. - Key news
Microsoft Corp. - Key offerings
Microsoft Corp. - Segment focus
SWOT

14.13 NVIDIA Corp.

NVIDIA Corp. - Overview
NVIDIA Corp. - Business segments
NVIDIA Corp. - Key news
NVIDIA Corp. - Key offerings
NVIDIA Corp. - Segment focus
SWOT

14.14 Opencv.ai

Opencv.ai - Overview
Opencv.ai - Product / Service
Opencv.ai - Key offerings
SWOT

14.15 Qualcomm Inc.

Qualcomm Inc. - Overview
Qualcomm Inc. - Business segments
Qualcomm Inc. - Key news
Qualcomm Inc. - Key offerings
Qualcomm Inc. - Segment focus
SWOT

14.16 SenseTime Group Inc.

SenseTime Group Inc. - Overview
SenseTime Group Inc. - Product / Service
SenseTime Group Inc. - Key offerings
SWOT

14.17 Trigo Vision Ltd.

Trigo Vision Ltd. - Overview
Trigo Vision Ltd. - Product / Service
Trigo Vision Ltd. - Key offerings
SWOT

14.18 viso.ai

viso.ai - Overview
viso.ai - Product / Service
viso.ai - Key offerings
SWOT

15. Appendix

15.1 Scope of the report

Market definition
Objectives
Notes and caveats

15.2 Inclusions and exclusions checklist

Inclusions checklist
Exclusions checklist

15.3 Currency conversion rates for US$

15.4 Research methodology

15.5 Data procurement

Information sources

15.6 Data validation

15.7 Validation techniques employed for market sizing

15.8 Data synthesis

15.9 360 degree market analysis

15.10 List of abbreviations

Research Methodology

Technavio presents a detailed picture of the market by way of study, synthesis, and summation of data from multiple sources. The analysts have presented the various facets of the market with a particular focus on identifying the key industry influencers. The data thus presented is comprehensive, reliable, and the result of extensive research, both primary and secondary.

INFORMATION SOURCES

Primary sources

  • Manufacturers and suppliers
  • Channel partners
  • Industry experts
  • Strategic decision makers

Secondary sources

  • Industry journals and periodicals
  • Government data
  • Financial reports of key industry players
  • Historical data
  • Press releases

DATA ANALYSIS

Data Synthesis

  • Collation of data
  • Estimation of key figures
  • Analysis of derived insights

Data Validation

  • Triangulation with data models
  • Reference against proprietary databases
  • Corroboration with industry experts

REPORT WRITING

Qualitative

  • Market drivers
  • Market challenges
  • Market trends
  • Five forces analysis

Quantitative

  • Market size and forecast
  • Market segmentation
  • Geographical insights
  • Competitive landscape

Interested in this report?

Get your sample now to see our research methodology and insights!

Download Now

Frequently Asked Questions

AI In Vision market growth will increase by USD 34802.5 million during 2025-2029.

The AI In Vision market is expected to grow at a CAGR of 17.6% during 2025-2029.

AI In Vision market is segmented by Component (Hardware, Software, Services) Technology (Computer vision, Virtual reality, Augmented reality, Mixed reality) End-user (Manufacturing, Healthcare and life sciences, Automotive, Retail and e-commerce, Others)

Amazon.com Inc., Apptronik Inc., Cipia Vision Ltd., Clarifai Inc., Google LLC, Hawk Eye Innovations Ltd., Imagga Technologies Ltd., Intel Corp., Magic Leap Inc., Matterport Inc., Meta Platforms Inc., Microsoft Corp., NVIDIA Corp., Opencv.ai, Qualcomm Inc., SenseTime Group Inc., Trigo Vision Ltd., viso.ai are a few of the key vendors in the AI In Vision market.

North America will register the highest growth rate of 31% among the other regions. Therefore, the AI In Vision market in North America is expected to garner significant business opportunities for the vendors during the forecast period.

US, Canada, Mexico, China, Japan, South Korea, India, Australia, Indonesia, Germany, UK, France, Italy, Spain, The Netherlands, UAE, Saudi Arabia, South Africa, Israel, Turkey, Brazil, Argentina, Colombia

  • Increasing demand for automation and Industry 4.0 integration is the driving factor this market.

The AI In Vision market vendors should focus on grabbing business opportunities from the Component segment as it accounted for the largest market share in the base year.