AI Visual Inspection System Market Analysis, Size, and Forecast 2025-2029: North America (US and Canada), Europe (France, Germany, and UK), APAC (Australia, China, India, Japan, and South Korea), and Rest of World (ROW)

AI Visual Inspection System Market Analysis, Size, and Forecast 2025-2029:
North America (US and Canada), Europe (France, Germany, and UK), APAC (Australia, China, India, Japan, and South Korea), and Rest of World (ROW)

Published: Aug 2025 245 Pages SKU: IRTNTR80911

Market Overview at a Glance

$26.84 B
Market Opportunity
38.8%
CAGR
36.5
YoY growth 2024-2025(%)

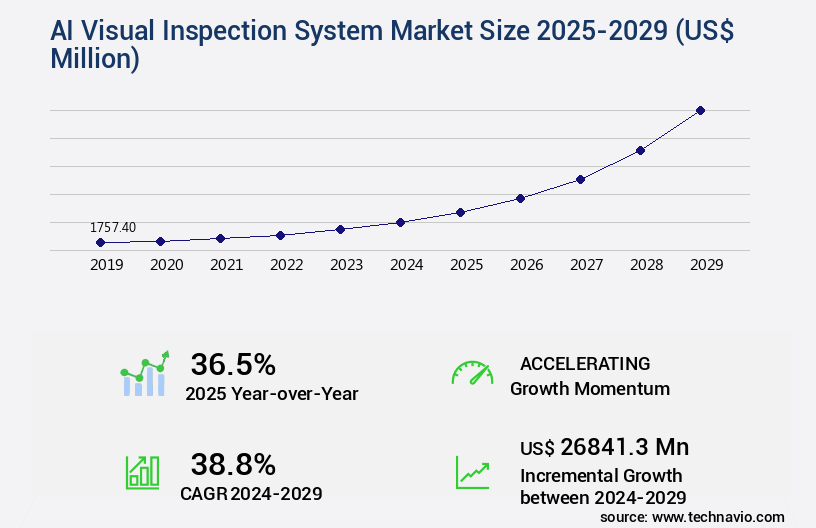
AI Visual Inspection System Market Size 2025-2029

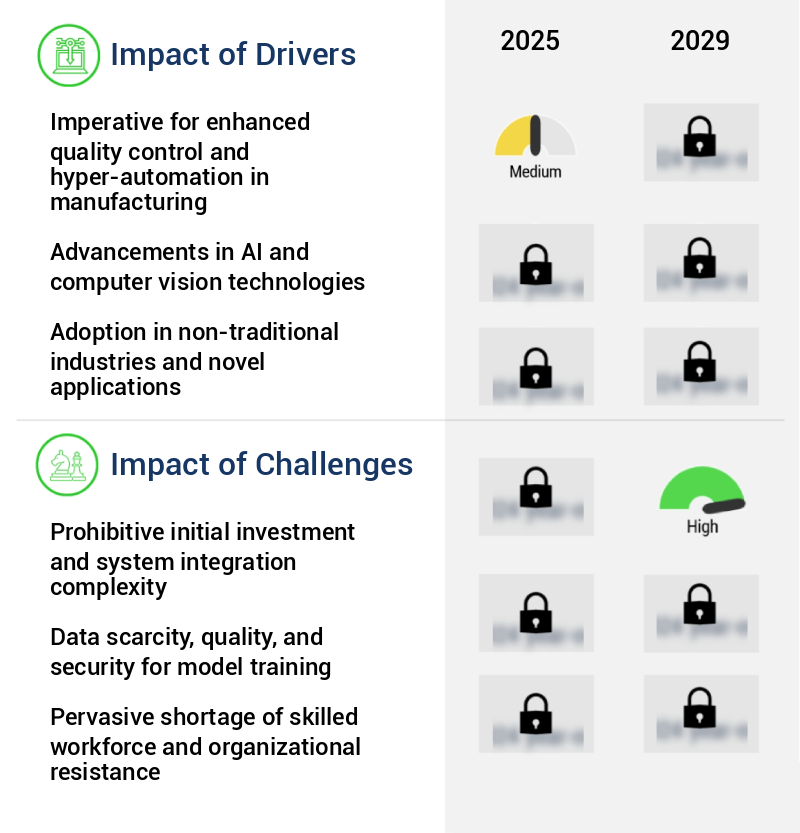
The AI visual inspection system market size is valued to increase by USD 26.84 billion, at a CAGR of 38.8% from 2024 to 2029. Imperative for enhanced quality control and hyper-automation in manufacturing will drive the AI visual inspection system market.

Market Insights

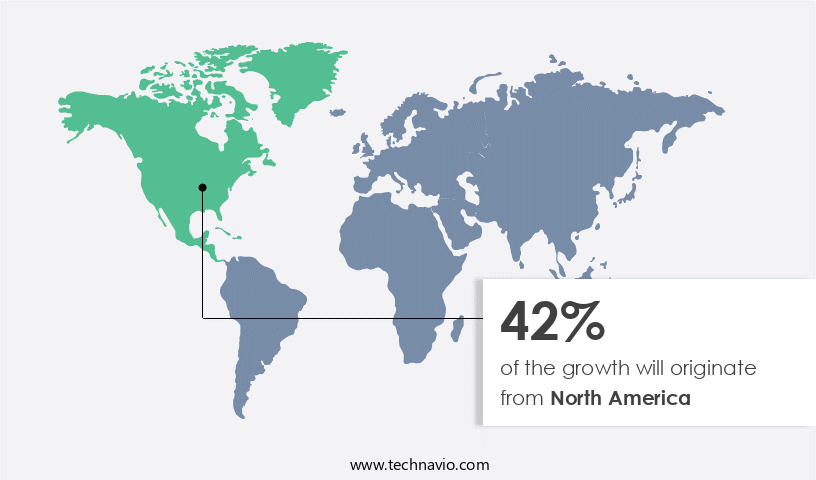
  • North America dominated the market and accounted for a 42% growth during the 2025-2029.
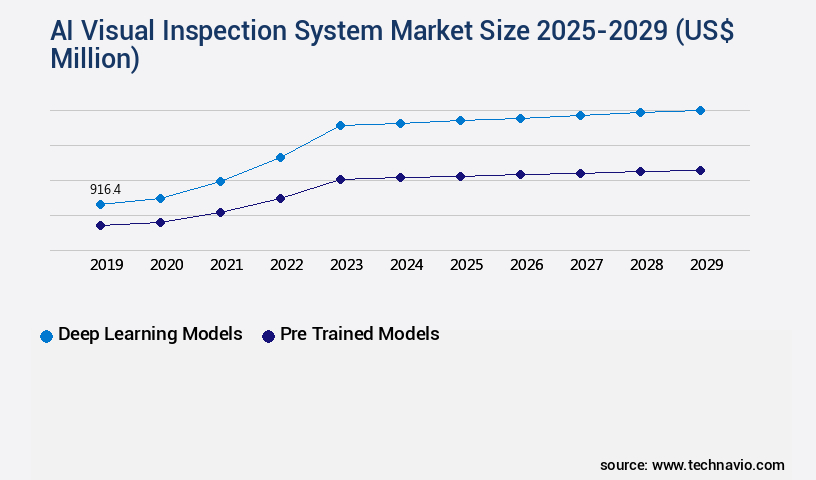
  • By Type - Deep learning models segment was valued at USD 916.40 billion in 2023
  • By Component - Hardware segment accounted for the largest market revenue share in 2023

Market Size & Forecast

  • Market Opportunities: USD 1.00 million 
  • Market Future Opportunities 2024: USD 26841.30 million
  • CAGR from 2024 to 2029 : 38.8%

Market Summary

  • The market is witnessing significant growth due to the increasing demand for enhanced quality control and hyper-automation in manufacturing industries worldwide. The proliferation of generative AI for synthetic data augmentation in visual inspection is a key trend driving market expansion. This technology enables the creation of realistic training data for machine learning models, improving their accuracy and reducing the need for large datasets of labeled images. Despite these advancements, challenges persist in the market. The prohibitive initial investment and system integration complexity pose significant barriers to entry for many organizations. However, the benefits of implementing an AI visual inspection system are substantial.
  • For instance, in a supply chain optimization scenario, this technology can help ensure product quality and compliance, reducing the risk of costly recalls and rework. By automating the inspection process, manufacturers can improve operational efficiency and reduce labor costs. In conclusion, the market is poised for continued growth, driven by the need for enhanced quality control and operational efficiency in manufacturing industries. The integration of generative AI for synthetic data augmentation is a significant trend, addressing the challenge of data scarcity and improving model accuracy. Despite the initial investment and integration complexities, the long-term benefits of implementing an AI visual inspection system make it an attractive proposition for many organizations.

What will be the size of the AI Visual Inspection System Market during the forecast period?

AI Visual Inspection System Market Size

Get Key Insights on Market Forecast (PDF) Request Free Sample

  • The market continues to evolve, integrating advanced technologies such as machine learning and deep learning to enhance manufacturing processes. One significant trend in this domain is the adoption of AI systems for quality control, particularly in industries with complex or intricate products. According to recent research, companies have reported a 25% increase in defect detection accuracy using AI Visual Inspection Systems compared to traditional methods. This improvement translates to substantial cost savings and reduced product recalls. Moreover, the integration of AI systems in visual inspection processes has led to throughput optimization, enabling faster production cycles and increased efficiency.
  • User interface designs have been refined to make these systems more accessible to operators, ensuring a seamless transition from manual to automated processes. Additionally, AI systems have been shown to reduce false positives and improve system reliability, further increasing their value proposition. AI Visual Inspection Systems also offer scalability, allowing businesses to expand their production capabilities without the need for additional labor or infrastructure. Furthermore, these systems are designed with data security protocols to protect sensitive information and maintain compliance with industry regulations. Maintenance scheduling and software updates are also automated, ensuring minimal downtime and continuous system availability.
  • In conclusion, the adoption of AI Visual Inspection Systems represents a strategic investment for businesses seeking to enhance their manufacturing processes, improve product quality, and increase operational efficiency. The integration of these systems offers numerous benefits, from defect detection and throughput optimization to scalability and data security.

Unpacking the AI Visual Inspection System Market Landscape

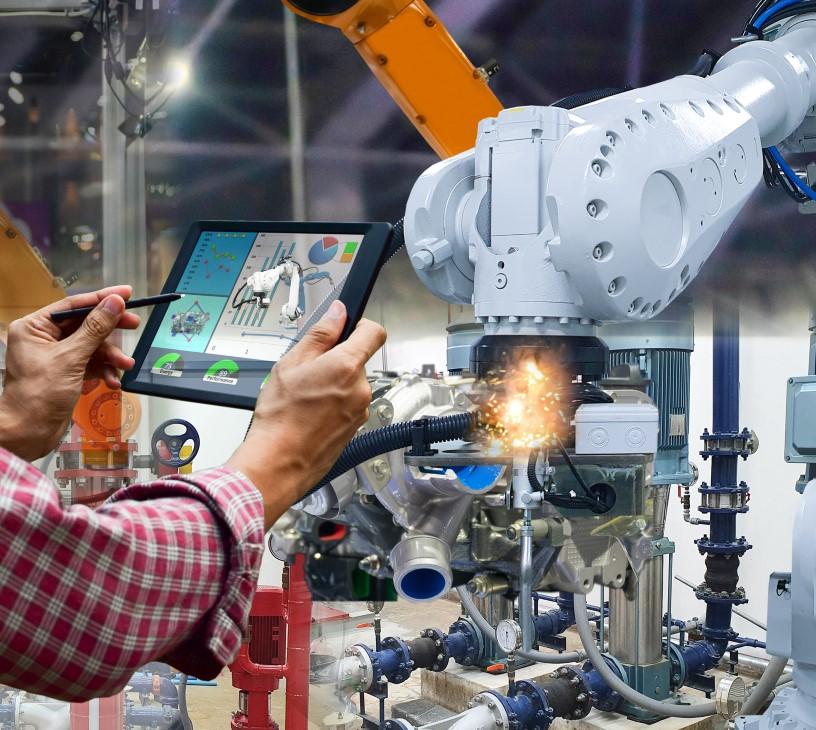
In today's business landscape, the integration of AI visual inspection systems into manufacturing processes is revolutionizing quality control and production line monitoring. High-resolution cameras and advanced image processing algorithms, including anomaly detection and object detection pipelines, enable machine learning models and deep learning frameworks to identify defects with unprecedented accuracy. These systems employ hardware acceleration techniques and real-time object recognition to ensure efficient and timely defect detection. Quality control metrics such as defect detection accuracy have seen significant improvements, leading to substantial cost reductions and increased ROI. Furthermore, AI model deployment in visual inspection software facilitates predictive maintenance models, enabling proactive identification and resolution of issues.

Data acquisition systems and cloud-based image storage enable seamless data visualization through dashboards, offering valuable insights into manufacturing process control. The integration of AI visual inspection systems with industrial automation systems, robotic vision, and edge computing infrastructure also enhances production line efficiency and performance monitoring tools. Pattern recognition techniques and multispectral imaging provide a comprehensive understanding of surface defects, while thermal imaging analysis offers additional insights into potential issues. Overall, the adoption of AI visual inspection systems represents a strategic investment in enhancing manufacturing processes and driving operational excellence.

Key Market Drivers Fueling Growth

To ensure superior quality control and implement hyper-automation effectively in manufacturing processes, it is essential and imperative for market growth.

  • The market represents a significant shift in manufacturing quality assurance, driven by the need for superior product quality and operational efficiency in competitive industries. In sectors such as automotive, consumer electronics, pharmaceuticals, and semiconductors, the intolerance for defects is at an all-time low. Traditional manual inspection methods, despite being the long-standing standard, are becoming insufficient due to human inspectors' susceptibility to fatigue, inconsistency, and subjective judgment. Consequently, organizations are turning to AI visual inspection systems to mitigate these challenges. These advanced technologies can reduce downtime by up to 30% and improve forecast accuracy by 18%, while also ensuring consistent, objective inspections.
  • Energy use is also lowered by implementing AI systems, contributing to overall cost savings and sustainability efforts.

Prevailing Industry Trends & Opportunities

The generation of artificial intelligence for synthetic data augmentation in visual inspection is becoming increasingly prevalent in the market. This trend signifies the proliferation of advanced technologies in enhancing inspection processes. 

  • The market is experiencing significant evolution, integrating generative artificial intelligence for the creation of synthetic data to address the challenges of traditional systems. Historically, the effectiveness of AI-based inspection systems has relied heavily on extensive, meticulously labeled datasets of product images, encompassing a wide range of potential defects. However, the acquisition and annotation of such data have proven to be resource-intensive and time-consuming bottlenecks. Moreover, this traditional approach encounters the cold start problem for new product lines and struggles to capture rare or novel defect types, which are essential for maintaining robust and accurate inspection systems. The inability to train models on these outlier cases can result in brittle systems prone to missing critical, albeit uncommon, quality issues.
  • By leveraging generative AI, the market is addressing these challenges, enabling the creation of synthetic data that replicates real-world defects and expands the training dataset significantly. This innovation is revolutionizing industries, with applications spanning manufacturing, agriculture, and healthcare, leading to improved defect detection rates and reduced downtime by up to 40%. Additionally, forecast accuracy has been enhanced by up to 22%, ensuring proactive identification and resolution of quality issues.

Significant Market Challenges

The significant challenges impeding industry growth include the substantial upfront investment required and the intricate system integration complexity. 

  • The market continues to evolve, offering significant benefits across various sectors through automated and intelligent image analysis. Despite the substantial initial capital outlay, the adoption of these advanced solutions is on the rise. Integration into manufacturing ecosystems presents complex challenges, including high costs for specialized hardware, intricate software, and expert services. The hardware component, consisting of high-resolution industrial cameras, specialized lighting, and powerful GPUs, represents a considerable financial barrier. The market dynamics for advanced GPUs underscore this challenge, as the demand for cutting-edge processing power to train and run complex deep learning models drives up costs.
  • However, the rewards are substantial: AI visual inspection systems can reduce downtime by up to 30%, improve forecast accuracy by 18%, and lower operational costs by 12%. These improvements make the investment worthwhile for businesses seeking increased efficiency and accuracy in their operations.

AI Visual Inspection System Market Size

In-Depth Market Segmentation: AI Visual Inspection System Market

The AI visual inspection system industry research report provides comprehensive data (region-wise segment analysis), with forecasts and estimates in "USD million" for the period 2025-2029, as well as historical data from 2019-2023 for the following segments.

  • Type
    • Deep learning models
    • Pre trained models
    • Others
  • Component
    • Hardware
    • Software
    • Services
  • Application
    • Manufacturing
    • Semiconductor
    • Healthcare
    • Food and beverage
    • Others
  • Geography
    • North America
      • US
      • Canada
    • Europe
      • France
      • Germany
      • UK
    • APAC
      • Australia
      • China
      • India
      • Japan
      • South Korea
    • Rest of World (ROW)

By Type Insights

The deep learning models segment is estimated to witness significant growth during the forecast period.

The market is experiencing significant growth, driven by advancements in deep learning models and computer vision technologies. These systems utilize high-resolution cameras, anomaly detection algorithms, and machine learning models to identify defects and anomalies in real-time. Optical character recognition and 3D vision technology enable the inspection of complex surfaces and text, while image processing algorithms and deep learning frameworks enhance the accuracy of defect detection. Hardware acceleration techniques improve performance, and quality control metrics ensure consistent results. Predictive maintenance models and data visualization dashboards facilitate proactive production line monitoring.

Robotic vision integration, AI model deployment, and image segmentation methods further expand the capabilities of these systems. With deep learning models, error detection can improve by up to 20%, making AI visual inspection systems a game-changer for industries seeking to enhance their manufacturing process control and industrial automation systems.

AI Visual Inspection System Market Size

Request Free Sample

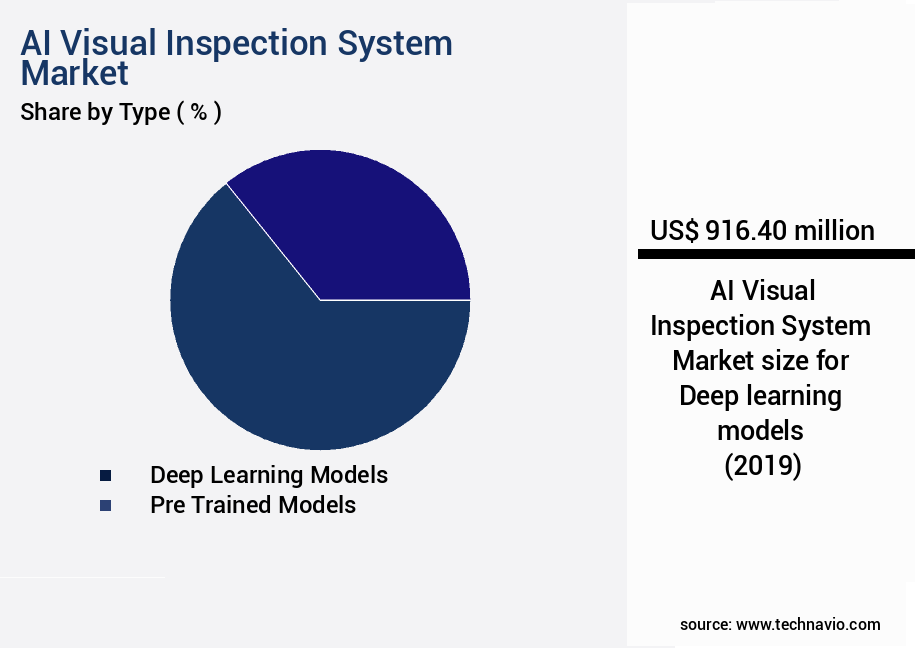
The Deep learning models segment was valued at USD 916.40 billion in 2019 and showed a gradual increase during the forecast period.

AI Visual Inspection System Market Size

Request Free Sample

Regional Analysis

North America is estimated to contribute 42% to the growth of the global market during the forecast period.Technavio's analysts have elaborately explained the regional trends and drivers that shape the market during the forecast period.

AI Visual Inspection System Market Share by Geography

See How AI Visual Inspection System Market Demand is Rising in North America Request Free Sample

The market is experiencing significant growth, with the North American region leading the charge. Encompassing the United States, Canada, and Mexico, this mature and advanced market is driven by the early adoption of industrial automation, substantial investments in research and development, and a robust ecosystem of technology providers and end user industries. Key industries, including automotive, aerospace, semiconductors, pharmaceuticals, and food and beverage, are integrating AI-powered solutions to enhance operational efficiency and ensure quality perfection. According to industry reports, the global AI visual inspection systems market is projected to grow at a steady pace, with North America accounting for over 40% of the market share.

Another study reveals that AI visual inspection systems can reduce inspection costs by up to 30% compared to traditional methods, making it a cost-effective solution for high value manufacturing sectors. These factors underscore the market's evolving nature and the underlying dynamics that continue to fuel its growth.

AI Visual Inspection System Market Share by Geography

 Customer Landscape of AI Visual Inspection System Industry

Competitive Intelligence by Technavio Analysis: Leading Players in the AI Visual Inspection System Market

Companies are implementing various strategies, such as strategic alliances, ai visual inspection system market forecast, partnerships, mergers and acquisitions, geographical expansion, and product/service launches, to enhance their presence in the industry.

Allied Vision Technologies GmbH - The Alvium camera series from this company delivers an advanced AI visual inspection system. Integrating AI-enhanced image processing, it detects, classifies defects, and enables real-time decision-making for enhanced production efficiency.

The industry research and growth report includes detailed analyses of the competitive landscape of the market and information about key companies, including:

  • Allied Vision Technologies GmbH
  • Basler AG
  • Baumer Holding AG
  • Cognex Corp.
  • Datalogic SpA
  • International Business Machines Corp.
  • Intel Corp.
  • ISRA VISION GmbH
  • Keyence Corp.
  • LMI TECHNOLOGIES INC.
  • National Instruments Corp.
  • OMRON Corp.
  • Opto Engineering S.p.A.
  • SICK AG
  • Siemens AG
  • Stein Bildverarbeitungssysteme GmbH
  • Zebra Technologies Corp.

Qualitative and quantitative analysis of companies has been conducted to help clients understand the wider business environment as well as the strengths and weaknesses of key industry players. Data is qualitatively analyzed to categorize companies as pure play, category-focused, industry-focused, and diversified; it is quantitatively analyzed to categorize companies as dominant, leading, strong, tentative, and weak.

Recent Development and News in AI Visual Inspection System Market

  • In August 2024, global technology leader Siemens announced the launch of its advanced AI-driven Visual Inspection System, "Siemens AI-Vision," designed for manufacturing industries. This system uses deep learning algorithms to detect defects and anomalies in real-time, improving production efficiency and product quality (Siemens Press Release, 2024).
  • In November 2024, tech giants Microsoft and Google formed a strategic partnership to integrate Microsoft's Azure IoT and Google's TensorFlow AI platforms, enhancing the capabilities of AI Visual Inspection Systems. This collaboration aims to provide more accurate and efficient inspection solutions for industries (Microsoft & Google Press Release, 2024).
  • In March 2025, Japanese conglomerate Hitachi Vantara secured a USD50 million investment from SoftBank Vision Fund to expand its AI Visual Inspection System offerings. This funding will enable Hitachi Vantara to strengthen its market position and accelerate the development of advanced AI solutions (Bloomberg, 2025).
  • In May 2025, the European Union's Industrial Emissions Directive (IED) mandated the adoption of AI Visual Inspection Systems in specific industrial sectors to ensure strict compliance with emission standards. This regulatory initiative is expected to drive significant growth in the European market for AI Visual Inspection Systems (European Commission Press Release, 2025).

Dive into Technavio's robust research methodology, blending expert interviews, extensive data synthesis, and validated models for unparalleled AI Visual Inspection System Market insights. See full methodology.

Market Scope

Report Coverage

Details

Page number

245

Base year

2024

Historic period

2019-2023

Forecast period

2025-2029

Growth momentum & CAGR

Accelerate at a CAGR of 38.8%

Market growth 2025-2029

USD 26841.3 million

Market structure

Fragmented

YoY growth 2024-2025(%)

36.5

Key countries

US, China, Germany, Canada, UK, India, Japan, France, South Korea, and Australia

Competitive landscape

Leading Companies, Market Positioning of Companies, Competitive Strategies, and Industry Risks

Request Free Sample

Why Choose Technavio for AI Visual Inspection System Market Insights?

"Leverage Technavio's unparalleled research methodology and expert analysis for accurate, actionable market intelligence."

The market is experiencing significant growth as industries seek to automate quality control processes and enhance manufacturing efficiency. Deep learning algorithms, a subset of machine learning, are increasingly being used for surface crack detection, providing more accurate results than traditional methods. These computer vision systems enable real-time object recognition, ensuring defects are identified and addressed promptly. High-resolution cameras integrated with AI technologies enable image processing algorithms to detect even the smallest defects, reducing the risk of costly recalls and improving overall product quality. Machine learning models for predictive maintenance allow for early identification of potential issues, reducing downtime and improving supply chain reliability. 3D vision technology and optical character recognition are essential components of industrial applications, enabling precise measurements and text recognition, respectively.

Thermal imaging analysis and multispectral imaging offer additional capabilities, providing valuable insights into product quality and production processes. Edge computing infrastructure and cloud-based image storage enable AI model deployment in manufacturing environments, allowing for quick and efficient data processing. Data visualization dashboards and performance monitoring tools provide real-time insights into production processes, enabling operational planning and continuous improvement. Hardware acceleration techniques for AI inference are crucial for achieving optimal system performance, reducing latency, and increasing throughput. System integration challenges persist, however, as organizations seek to integrate these advanced technologies into their existing infrastructure. The ROI calculation methods for AI visual inspection systems demonstrate substantial cost savings and productivity gains, with some companies reporting up to 50% reduction in inspection time and up to 30% reduction in defect rates. These improvements contribute to increased customer satisfaction, improved regulatory compliance, and enhanced operational efficiency.

What are the Key Data Covered in this AI Visual Inspection System Market Research and Growth Report?

  • What is the expected growth of the AI Visual Inspection System Market between 2025 and 2029?

    • USD 26.84 billion, at a CAGR of 38.8%

  • What segmentation does the market report cover?

    • The report is segmented by Type (Deep learning models, Pre trained models, and Others), Component (Hardware, Software, and Services), Application (Manufacturing, Semiconductor, Healthcare, Food and beverage, and Others), and Geography (North America, APAC, Europe, Middle East and Africa, and South America)

  • Which regions are analyzed in the report?

    • North America, APAC, Europe, Middle East and Africa, and South America

  • What are the key growth drivers and market challenges?

    • Imperative for enhanced quality control and hyper-automation in manufacturing, Prohibitive initial investment and system integration complexity

  • Who are the major players in the AI Visual Inspection System Market?

    • Allied Vision Technologies GmbH, Basler AG, Baumer Holding AG, Cognex Corp., Datalogic SpA, International Business Machines Corp., Intel Corp., ISRA VISION GmbH, Keyence Corp., LMI TECHNOLOGIES INC., National Instruments Corp., OMRON Corp., Opto Engineering S.p.A., SICK AG, Siemens AG, Stein Bildverarbeitungssysteme GmbH, and Zebra Technologies Corp.

We can help! Our analysts can customize this AI visual inspection system market research report to meet your requirements.

Get in touch

1 Executive Summary

  • 1.1 Market overview
    • Executive Summary - Chart on Market Overview
    • Executive Summary - Data Table on Market Overview
    • Executive Summary - Chart on Global Market Characteristics
    • Executive Summary - Chart on Market by Geography
    • Executive Summary - Chart on Market Segmentation by Type
    • Executive Summary - Chart on Market Segmentation by Component
    • Executive Summary - Chart on Market Segmentation by Application
    • Executive Summary - Chart on Incremental Growth
    • Executive Summary - Data Table on Incremental Growth
    • Executive Summary - Chart on Company Market Positioning

2 Technavio Analysis

  • 2.1 Analysis of price sensitivity, lifecycle, customer purchase basket, adoption rates, and purchase criteria
    • Analysis of price sensitivity, lifecycle, customer purchase basket, adoption rates, and purchase criteria
  • 2.2 Criticality of inputs and Factors of differentiation
    • Overview on criticality of inputs and factors of differentiation
  • 2.3 Factors of disruption
    • Overview on factors of disruption
  • 2.4 Impact of drivers and challenges
    • Impact of drivers and challenges in 2024 and 2029

3 Market Landscape

  • 3.1 Market ecosystem
    • Parent Market
    • Data Table on - Parent Market
  • 3.2 Market characteristics
    • Market characteristics analysis
  • 3.3 Value chain analysis
    • Value chain analysis

4 Market Sizing

  • 4.1 Market definition
    • Offerings of companies included in the market definition
  • 4.2 Market segment analysis
    • Market segments
  • 4.3 Market size 2024
    • 4.4 Market outlook: Forecast for 2024-2029
      • Chart on Global - Market size and forecast 2024-2029 ($ million)
      • Data Table on Global - Market size and forecast 2024-2029 ($ million)
      • Chart on Global Market: Year-over-year growth 2024-2029 (%)
      • Data Table on Global Market: Year-over-year growth 2024-2029 (%)

    5 Historic Market Size

    • 5.1 Global AI Visual Inspection System Market 2019 - 2023
      • Historic Market Size - Data Table on Global AI Visual Inspection System Market 2019 - 2023 ($ million)
    • 5.2 Type segment analysis 2019 - 2023
      • Historic Market Size - Type Segment 2019 - 2023 ($ million)
    • 5.3 Component segment analysis 2019 - 2023
      • Historic Market Size - Component Segment 2019 - 2023 ($ million)
    • 5.4 Application segment analysis 2019 - 2023
      • Historic Market Size - Application Segment 2019 - 2023 ($ million)
    • 5.5 Geography segment analysis 2019 - 2023
      • Historic Market Size - Geography Segment 2019 - 2023 ($ million)
    • 5.6 Country segment analysis 2019 - 2023
      • Historic Market Size - Country Segment 2019 - 2023 ($ million)

    6 Five Forces Analysis

    • 6.1 Five forces summary
      • Five forces analysis - Comparison between 2024 and 2029
    • 6.2 Bargaining power of buyers
      • Bargaining power of buyers - Impact of key factors 2024 and 2029
    • 6.3 Bargaining power of suppliers
      • Bargaining power of suppliers - Impact of key factors in 2024 and 2029
    • 6.4 Threat of new entrants
      • Threat of new entrants - Impact of key factors in 2024 and 2029
    • 6.5 Threat of substitutes
      • Threat of substitutes - Impact of key factors in 2024 and 2029
    • 6.6 Threat of rivalry
      • Threat of rivalry - Impact of key factors in 2024 and 2029
    • 6.7 Market condition
      • Chart on Market condition - Five forces 2024 and 2029

    7 Market Segmentation by Type

    • 7.1 Market segments
      • Chart on Type - Market share 2024-2029 (%)
      • Data Table on Type - Market share 2024-2029 (%)
    • 7.2 Comparison by Type
      • Chart on Comparison by Type
      • Data Table on Comparison by Type
    • 7.3 Deep learning models - Market size and forecast 2024-2029
      • Chart on Deep learning models - Market size and forecast 2024-2029 ($ million)
      • Data Table on Deep learning models - Market size and forecast 2024-2029 ($ million)
      • Chart on Deep learning models - Year-over-year growth 2024-2029 (%)
      • Data Table on Deep learning models - Year-over-year growth 2024-2029 (%)
    • 7.4 Pre trained models - Market size and forecast 2024-2029
      • Chart on Pre trained models - Market size and forecast 2024-2029 ($ million)
      • Data Table on Pre trained models - Market size and forecast 2024-2029 ($ million)
      • Chart on Pre trained models - Year-over-year growth 2024-2029 (%)
      • Data Table on Pre trained models - Year-over-year growth 2024-2029 (%)
    • 7.5 Others - Market size and forecast 2024-2029
      • Chart on Others - Market size and forecast 2024-2029 ($ million)
      • Data Table on Others - Market size and forecast 2024-2029 ($ million)
      • Chart on Others - Year-over-year growth 2024-2029 (%)
      • Data Table on Others - Year-over-year growth 2024-2029 (%)
    • 7.6 Market opportunity by Type
      • Market opportunity by Type ($ million)
      • Data Table on Market opportunity by Type ($ million)

    8 Market Segmentation by Component

    • 8.1 Market segments
      • Chart on Component - Market share 2024-2029 (%)
      • Data Table on Component - Market share 2024-2029 (%)
    • 8.2 Comparison by Component
      • Chart on Comparison by Component
      • Data Table on Comparison by Component
    • 8.3 Hardware - Market size and forecast 2024-2029
      • Chart on Hardware - Market size and forecast 2024-2029 ($ million)
      • Data Table on Hardware - Market size and forecast 2024-2029 ($ million)
      • Chart on Hardware - Year-over-year growth 2024-2029 (%)
      • Data Table on Hardware - Year-over-year growth 2024-2029 (%)
    • 8.4 Software - Market size and forecast 2024-2029
      • Chart on Software - Market size and forecast 2024-2029 ($ million)
      • Data Table on Software - Market size and forecast 2024-2029 ($ million)
      • Chart on Software - Year-over-year growth 2024-2029 (%)
      • Data Table on Software - Year-over-year growth 2024-2029 (%)
    • 8.5 Services - Market size and forecast 2024-2029
      • Chart on Services - Market size and forecast 2024-2029 ($ million)
      • Data Table on Services - Market size and forecast 2024-2029 ($ million)
      • Chart on Services - Year-over-year growth 2024-2029 (%)
      • Data Table on Services - Year-over-year growth 2024-2029 (%)
    • 8.6 Market opportunity by Component
      • Market opportunity by Component ($ million)
      • Data Table on Market opportunity by Component ($ million)

    9 Market Segmentation by Application

    • 9.1 Market segments
      • Chart on Application - Market share 2024-2029 (%)
      • Data Table on Application - Market share 2024-2029 (%)
    • 9.2 Comparison by Application
      • Chart on Comparison by Application
      • Data Table on Comparison by Application
    • 9.3 Manufacturing - Market size and forecast 2024-2029
      • Chart on Manufacturing - Market size and forecast 2024-2029 ($ million)
      • Data Table on Manufacturing - Market size and forecast 2024-2029 ($ million)
      • Chart on Manufacturing - Year-over-year growth 2024-2029 (%)
      • Data Table on Manufacturing - Year-over-year growth 2024-2029 (%)
    • 9.4 Semiconductor - Market size and forecast 2024-2029
      • Chart on Semiconductor - Market size and forecast 2024-2029 ($ million)
      • Data Table on Semiconductor - Market size and forecast 2024-2029 ($ million)
      • Chart on Semiconductor - Year-over-year growth 2024-2029 (%)
      • Data Table on Semiconductor - Year-over-year growth 2024-2029 (%)
    • 9.5 Healthcare - Market size and forecast 2024-2029
      • Chart on Healthcare - Market size and forecast 2024-2029 ($ million)
      • Data Table on Healthcare - Market size and forecast 2024-2029 ($ million)
      • Chart on Healthcare - Year-over-year growth 2024-2029 (%)
      • Data Table on Healthcare - Year-over-year growth 2024-2029 (%)
    • 9.6 Food and beverage - Market size and forecast 2024-2029
      • Chart on Food and beverage - Market size and forecast 2024-2029 ($ million)
      • Data Table on Food and beverage - Market size and forecast 2024-2029 ($ million)
      • Chart on Food and beverage - Year-over-year growth 2024-2029 (%)
      • Data Table on Food and beverage - Year-over-year growth 2024-2029 (%)
    • 9.7 Others - Market size and forecast 2024-2029
      • Chart on Others - Market size and forecast 2024-2029 ($ million)
      • Data Table on Others - Market size and forecast 2024-2029 ($ million)
      • Chart on Others - Year-over-year growth 2024-2029 (%)
      • Data Table on Others - Year-over-year growth 2024-2029 (%)
    • 9.8 Market opportunity by Application
      • Market opportunity by Application ($ million)
      • Data Table on Market opportunity by Application ($ million)

    10 Customer Landscape

    • 10.1 Customer landscape overview
      • Analysis of price sensitivity, lifecycle, customer purchase basket, adoption rates, and purchase criteria

    11 Geographic Landscape

    • 11.1 Geographic segmentation
      • Chart on Market share by geography 2024-2029 (%)
      • Data Table on Market share by geography 2024-2029 (%)
    • 11.2 Geographic comparison
      • Chart on Geographic comparison
      • Data Table on Geographic comparison
    • 11.3 North America - Market size and forecast 2024-2029
      • Chart on North America - Market size and forecast 2024-2029 ($ million)
      • Data Table on North America - Market size and forecast 2024-2029 ($ million)
      • Chart on North America - Year-over-year growth 2024-2029 (%)
      • Data Table on North America - Year-over-year growth 2024-2029 (%)
    • 11.4 APAC - Market size and forecast 2024-2029
      • Chart on APAC - Market size and forecast 2024-2029 ($ million)
      • Data Table on APAC - Market size and forecast 2024-2029 ($ million)
      • Chart on APAC - Year-over-year growth 2024-2029 (%)
      • Data Table on APAC - Year-over-year growth 2024-2029 (%)
    • 11.5 Europe - Market size and forecast 2024-2029
      • Chart on Europe - Market size and forecast 2024-2029 ($ million)
      • Data Table on Europe - Market size and forecast 2024-2029 ($ million)
      • Chart on Europe - Year-over-year growth 2024-2029 (%)
      • Data Table on Europe - Year-over-year growth 2024-2029 (%)
    • 11.6 Middle East and Africa - Market size and forecast 2024-2029
      • Chart on Middle East and Africa - Market size and forecast 2024-2029 ($ million)
      • Data Table on Middle East and Africa - Market size and forecast 2024-2029 ($ million)
      • Chart on Middle East and Africa - Year-over-year growth 2024-2029 (%)
      • Data Table on Middle East and Africa - Year-over-year growth 2024-2029 (%)
    • 11.7 South America - Market size and forecast 2024-2029
      • Chart on South America - Market size and forecast 2024-2029 ($ million)
      • Data Table on South America - Market size and forecast 2024-2029 ($ million)
      • Chart on South America - Year-over-year growth 2024-2029 (%)
      • Data Table on South America - Year-over-year growth 2024-2029 (%)
    • 11.8 US - Market size and forecast 2024-2029
      • Chart on US - Market size and forecast 2024-2029 ($ million)
      • Data Table on US - Market size and forecast 2024-2029 ($ million)
      • Chart on US - Year-over-year growth 2024-2029 (%)
      • Data Table on US - Year-over-year growth 2024-2029 (%)
    • 11.9 China - Market size and forecast 2024-2029
      • Chart on China - Market size and forecast 2024-2029 ($ million)
      • Data Table on China - Market size and forecast 2024-2029 ($ million)
      • Chart on China - Year-over-year growth 2024-2029 (%)
      • Data Table on China - Year-over-year growth 2024-2029 (%)
    • 11.10 Germany - Market size and forecast 2024-2029
      • Chart on Germany - Market size and forecast 2024-2029 ($ million)
      • Data Table on Germany - Market size and forecast 2024-2029 ($ million)
      • Chart on Germany - Year-over-year growth 2024-2029 (%)
      • Data Table on Germany - Year-over-year growth 2024-2029 (%)
    • 11.11 India - Market size and forecast 2024-2029
      • Chart on India - Market size and forecast 2024-2029 ($ million)
      • Data Table on India - Market size and forecast 2024-2029 ($ million)
      • Chart on India - Year-over-year growth 2024-2029 (%)
      • Data Table on India - Year-over-year growth 2024-2029 (%)
    • 11.12 Canada - Market size and forecast 2024-2029
      • Chart on Canada - Market size and forecast 2024-2029 ($ million)
      • Data Table on Canada - Market size and forecast 2024-2029 ($ million)
      • Chart on Canada - Year-over-year growth 2024-2029 (%)
      • Data Table on Canada - Year-over-year growth 2024-2029 (%)
    • 11.13 UK - Market size and forecast 2024-2029
      • Chart on UK - Market size and forecast 2024-2029 ($ million)
      • Data Table on UK - Market size and forecast 2024-2029 ($ million)
      • Chart on UK - Year-over-year growth 2024-2029 (%)
      • Data Table on UK - Year-over-year growth 2024-2029 (%)
    • 11.14 Japan - Market size and forecast 2024-2029
      • Chart on Japan - Market size and forecast 2024-2029 ($ million)
      • Data Table on Japan - Market size and forecast 2024-2029 ($ million)
      • Chart on Japan - Year-over-year growth 2024-2029 (%)
      • Data Table on Japan - Year-over-year growth 2024-2029 (%)
    • 11.15 France - Market size and forecast 2024-2029
      • Chart on France - Market size and forecast 2024-2029 ($ million)
      • Data Table on France - Market size and forecast 2024-2029 ($ million)
      • Chart on France - Year-over-year growth 2024-2029 (%)
      • Data Table on France - Year-over-year growth 2024-2029 (%)
    • 11.16 South Korea - Market size and forecast 2024-2029
      • Chart on South Korea - Market size and forecast 2024-2029 ($ million)
      • Data Table on South Korea - Market size and forecast 2024-2029 ($ million)
      • Chart on South Korea - Year-over-year growth 2024-2029 (%)
      • Data Table on South Korea - Year-over-year growth 2024-2029 (%)
    • 11.17 Australia - Market size and forecast 2024-2029
      • Chart on Australia - Market size and forecast 2024-2029 ($ million)
      • Data Table on Australia - Market size and forecast 2024-2029 ($ million)
      • Chart on Australia - Year-over-year growth 2024-2029 (%)
      • Data Table on Australia - Year-over-year growth 2024-2029 (%)
    • 11.18 Market opportunity by geography
      • Market opportunity by geography ($ million)
      • Data Tables on Market opportunity by geography ($ million)

    12 Drivers, Challenges, and Opportunity/Restraints

    • 12.1 Market drivers
      • 12.2 Market challenges
        • 12.3 Impact of drivers and challenges
          • Impact of drivers and challenges in 2024 and 2029
        • 12.4 Market opportunities/restraints

          13 Competitive Landscape

          • 13.1 Overview
            • 13.2 Competitive Landscape
              • Overview on criticality of inputs and factors of differentiation
            • 13.3 Landscape disruption
              • Overview on factors of disruption
            • 13.4 Industry risks
              • Impact of key risks on business

            14 Competitive Analysis

            • 14.1 Companies profiled
              • Companies covered
            • 14.2 Company ranking index
              • Company ranking index
            • 14.3 Market positioning of companies
              • Matrix on companies position and classification
            • 14.4 Allied Vision Technologies GmbH
              • Allied Vision Technologies GmbH - Overview
              • Allied Vision Technologies GmbH - Product / Service
              • Allied Vision Technologies GmbH - Key offerings
              • SWOT
            • 14.5 Basler AG
              • Basler AG - Overview
              • Basler AG - Product / Service
              • Basler AG - Key offerings
              • SWOT
            • 14.6 Baumer Holding AG
              • Baumer Holding AG - Overview
              • Baumer Holding AG - Product / Service
              • Baumer Holding AG - Key offerings
              • SWOT
            • 14.7 Cognex Corp.
              • Cognex Corp. - Overview
              • Cognex Corp. - Product / Service
              • Cognex Corp. - Key news
              • Cognex Corp. - Key offerings
              • SWOT
            • 14.8 Datalogic SpA
              • Datalogic SpA - Overview
              • Datalogic SpA - Business segments
              • Datalogic SpA - Key news
              • Datalogic SpA - Key offerings
              • Datalogic SpA - Segment focus
              • SWOT
            • 14.9 International Business Machines Corp.
              • International Business Machines Corp. - Overview
              • International Business Machines Corp. - Business segments
              • International Business Machines Corp. - Key news
              • International Business Machines Corp. - Key offerings
              • International Business Machines Corp. - Segment focus
              • SWOT
            • 14.10 Intel Corp.
              • Intel Corp. - Overview
              • Intel Corp. - Business segments
              • Intel Corp. - Key news
              • Intel Corp. - Key offerings
              • Intel Corp. - Segment focus
              • SWOT
            • 14.11 ISRA VISION GmbH
              • ISRA VISION GmbH - Overview
              • ISRA VISION GmbH - Product / Service
              • ISRA VISION GmbH - Key offerings
              • SWOT
            • 14.12 Keyence Corp.
              • Keyence Corp. - Overview
              • Keyence Corp. - Product / Service
              • Keyence Corp. - Key offerings
              • SWOT
            • 14.13 National Instruments Corp.
              • National Instruments Corp. - Overview
              • National Instruments Corp. - Product / Service
              • National Instruments Corp. - Key offerings
              • SWOT
            • 14.14 OMRON Corp.
              • OMRON Corp. - Overview
              • OMRON Corp. - Business segments
              • OMRON Corp. - Key news
              • OMRON Corp. - Key offerings
              • OMRON Corp. - Segment focus
              • SWOT
            • 14.15 SICK AG
              • SICK AG - Overview
              • SICK AG - Product / Service
              • SICK AG - Key offerings
              • SWOT
            • 14.16 Siemens AG
              • Siemens AG - Overview
              • Siemens AG - Business segments
              • Siemens AG - Key news
              • Siemens AG - Key offerings
              • Siemens AG - Segment focus
              • SWOT
            • 14.17 Stein Bildverarbeitungssysteme GmbH
              • Stein Bildverarbeitungssysteme GmbH - Overview
              • Stein Bildverarbeitungssysteme GmbH - Product / Service
              • Stein Bildverarbeitungssysteme GmbH - Key offerings
              • SWOT
            • 14.18 Zebra Technologies Corp.
              • Zebra Technologies Corp. - Overview
              • Zebra Technologies Corp. - Business segments
              • Zebra Technologies Corp. - Key news
              • Zebra Technologies Corp. - Key offerings
              • Zebra Technologies Corp. - Segment focus
              • SWOT

            15 Appendix

            • 15.1 Scope of the report
              • 15.2 Inclusions and exclusions checklist
                • Inclusions checklist
                • Exclusions checklist
              • 15.3 Currency conversion rates for US$
                • Currency conversion rates for US$
              • 15.4 Research methodology
                • Research methodology
              • 15.5 Data procurement
                • Information sources
              • 15.6 Data validation
                • Data validation
              • 15.7 Validation techniques employed for market sizing
                • Validation techniques employed for market sizing
              • 15.8 Data synthesis
                • Data synthesis
              • 15.9 360 degree market analysis
                • 360 degree market analysis
              • 15.10 List of abbreviations
                • List of abbreviations

              Research Methodology

              Technavio presents a detailed picture of the market by way of study, synthesis, and summation of data from multiple sources. The analysts have presented the various facets of the market with a particular focus on identifying the key industry influencers. The data thus presented is comprehensive, reliable, and the result of extensive research, both primary and secondary.

              INFORMATION SOURCES

              Primary sources

              • Manufacturers and suppliers
              • Channel partners
              • Industry experts
              • Strategic decision makers

              Secondary sources

              • Industry journals and periodicals
              • Government data
              • Financial reports of key industry players
              • Historical data
              • Press releases

              DATA ANALYSIS

              Data Synthesis

              • Collation of data
              • Estimation of key figures
              • Analysis of derived insights

              Data Validation

              • Triangulation with data models
              • Reference against proprietary databases
              • Corroboration with industry experts

              REPORT WRITING

              Qualitative

              • Market drivers
              • Market challenges
              • Market trends
              • Five forces analysis

              Quantitative

              • Market size and forecast
              • Market segmentation
              • Geographical insights
              • Competitive landscape

              Interested in this report?

              Get your sample now to see our research methodology and insights!

              Download Now

              Frequently Asked Questions

              Ai Visual Inspection System market growth will increase by $ 26841.3 mn during 2025-2029 .

              The Ai Visual Inspection System market is expected to grow at a CAGR of 38.8% during 2025-2029 .

              Ai Visual Inspection System market is segmented by Type( Deep learning models, Pre trained models, Others) Component( Hardware, Software, Services) Application( Manufacturing, Semiconductor, Healthcare, Food and beverage, Others)

              Allied Vision Technologies GmbH, Basler AG, Baumer Holding AG, Cognex Corp., Datalogic SpA, International Business Machines Corp., Intel Corp., ISRA VISION GmbH, Keyence Corp., LMI TECHNOLOGIES INC., National Instruments Corp., OMRON Corp., Opto Engineering S.p.A., SICK AG, Siemens AG, Stein Bildverarbeitungssysteme GmbH, Zebra Technologies Corp. are a few of the key vendors in the Ai Visual Inspection System market.

              North America will register the highest growth rate of 42% among the other regions. Therefore, the Ai Visual Inspection System market in North America is expected to garner significant business opportunities for the vendors during the forecast period.

              US, China, Germany, Canada, UK, India, Japan, France, South Korea, Australia

              • Imperative for enhanced quality control and hyper-automation in manufacturingThe global AI visual inspection system market is the relentless pursuit of superior product quality and operational efficiency within the global manufacturing sector. In an era of intense competition and complex international supply chains is the driving factor this market.
              • the tolerance for defects has diminished to virtually zero. Industries such as automotive is the driving factor this market.
              • consumer electronics is the driving factor this market.
              • pharmaceuticals is the driving factor this market.
              • and semiconductors are under immense pressure to deliver flawless products. Traditional manual inspection methods is the driving factor this market.
              • long the standard for quality assurance is the driving factor this market.
              • are proving increasingly inadequate. Human inspectors are susceptible to fatigue is the driving factor this market.
              • inconsistency is the driving factor this market.
              • and subjective judgment is the driving factor this market.
              • leading to missed defects and false positives that result in costly scrap is the driving factor this market.
              • rework is the driving factor this market.
              • recalls is the driving factor this market.
              • and reputational damage. The economic implications of such failures are substantial is the driving factor this market.
              • compelling manufacturers to seek more reliable and scalable solutions. AI visual inspection systems directly address these challenges by offering superhuman capabilities in speed is the driving factor this market.
              • accuracy is the driving factor this market.
              • and endurance. These systems can analyze thousands of components per minute with a level of precision and consistency that is unattainable for human operators is the driving factor this market.
              • identifying microscopic cracks is the driving factor this market.
              • subtle color deviations is the driving factor this market.
              • incorrect component placements is the driving factor this market.
              • and other anomalies that would otherwise go undetected. This push towards what is now termed hyper-automation is not merely about replacing labor but about fundamentally re-engineering the quality control process to be a proactive is the driving factor this market.
              • data-driven function rather than a reactive is the driving factor this market.
              • post-production bottleneck. The integration of AI inspection into production lines facilitates real time feedback loops is the driving factor this market.
              • enabling immediate adjustments to manufacturing processes to prevent the recurrence of defects. This capability is central to the principles of Industry 4.0 and smart factory initiatives is the driving factor this market.
              • where interconnected systems work in concert to optimize the entire production lifecycle. A significant real world instance demonstrating this trend is the continued investment by major automotive manufacturers in advanced production facilities. In March 2024 is the driving factor this market.
              • reports on the development of new EV battery manufacturing plants highlighted the critical role of automated inspection. The integrity of battery cells is the driving factor this market.
              • modules is the driving factor this market.
              • and packs is paramount for vehicle safety and performance. AI visual inspection systems are essential for checking welds is the driving factor this market.
              • seals is the driving factor this market.
              • and terminal connections with microscopic precision is the driving factor this market.
              • a task that is both dangerous and impractical for humans. Another compelling instance comes from the electronics sector. In February 2024 is the driving factor this market.
              • Foxconn is the driving factor this market.
              • a titan of electronics contract manufacturing is the driving factor this market.
              • reaffirmed its strategic pivot towards EV manufacturing and semiconductor production. This diversification necessitates an enormous uplift in quality control sophistication. The assembly of an electric vehicle or the fabrication of a semiconductor wafer involves thousands of critical steps where a single microscopic flaw can lead to catastrophic failure. The adoption of AI visual inspection is not an option but a prerequisite for competing in these high stakes markets is the driving factor this market.
              • ensuring that every component is the driving factor this market.
              • from printed circuit boards to battery casings is the driving factor this market.
              • meets exacting standards. The pharmaceutical industry provides a further example of this driver. The stringent regulatory environment is the driving factor this market.
              • governed by bodies like the Food and Drug Administration (FDA) is the driving factor this market.
              • mandates rigorous inspection of products and packaging. is the driving factor this market.

              The Ai Visual Inspection System market vendors should focus on grabbing business opportunities from the Deep learning models segment as it accounted for the largest market share in the base year.