
AI In Workplace Market Size 2025-2029
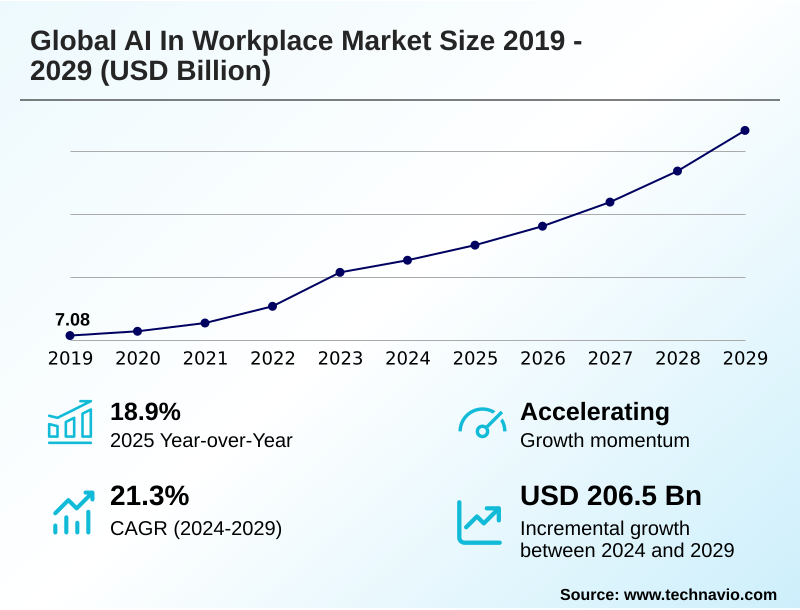
The ai in workplace market size is valued to increase by USD 206.50 billion, at a CAGR of 21.3% from 2024 to 2029. Unrelenting pursuit of productivity and operational efficiency will drive the ai in workplace market.
Major Market Trends & Insights
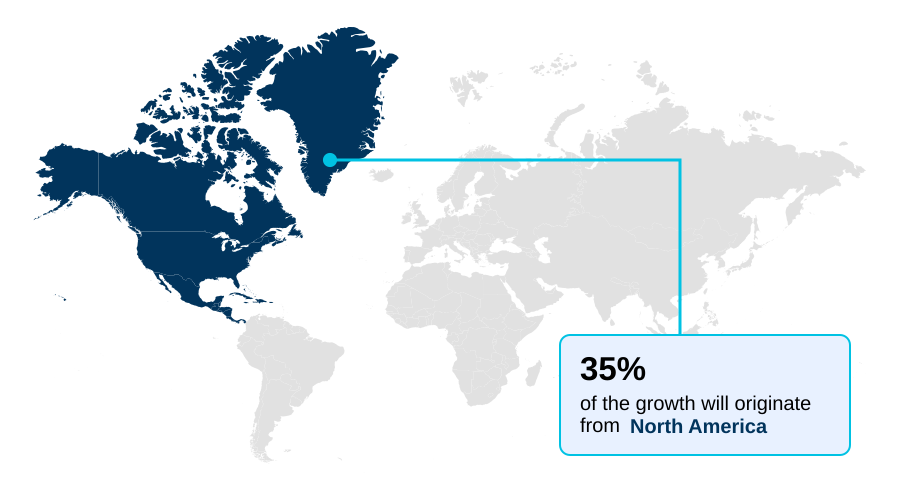
- North America dominated the market and accounted for a 35.1% growth during the forecast period.
- By Technology - Computer vision segment was valued at USD 38.71 billion in 2023
- By Application - Workflow automation segment accounted for the largest market revenue share in 2023
Market Size & Forecast
- Market Opportunities: USD 326.32 billion
- Market Future Opportunities: USD 206.50 billion
- CAGR from 2024 to 2029 : 21.3%
Market Summary
- The AI in workplace market is undergoing a significant transformation, driven by the need for enhanced operational efficiency and data-driven insights. The integration of intelligent technologies is moving beyond simple task automation to augment human capabilities across various business functions.
- Key technologies such as machine learning and natural language processing are at the core of this evolution, enabling sophisticated applications like predictive analytics for sales forecasting and sentiment analysis for gauging employee engagement.
- In a practical business scenario, a logistics company can utilize AI to optimize delivery routes in real time by analyzing traffic patterns, weather conditions, and delivery priorities, resulting in substantial fuel savings and improved customer satisfaction. This shift toward intelligent automation is creating more agile and resilient enterprises.
- However, the market also faces challenges related to data privacy, the high cost of implementation, and the critical need for a skilled workforce capable of managing and leveraging these advanced systems. As organizations increasingly recognize the competitive advantage offered by AI, the focus is shifting towards creating ethical frameworks and ensuring a positive return on investment.
What will be the Size of the AI In Workplace Market during the forecast period?
Get Key Insights on Market Forecast (PDF) Get Free Sample
How is the AI In Workplace Market Segmented?
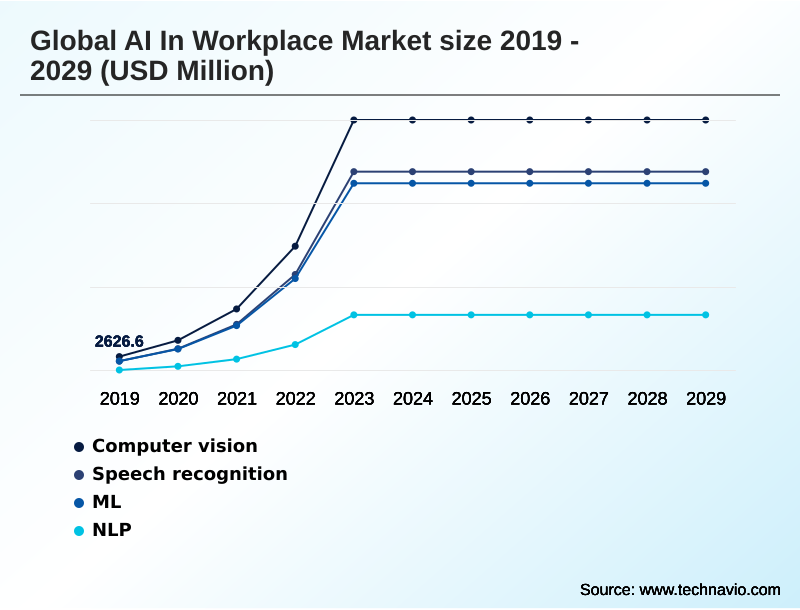
The ai in workplace industry research report provides comprehensive data (region-wise segment analysis), with forecasts and estimates in "USD million" for the period 2025-2029, as well as historical data from 2019-2023 for the following segments.
- Technology
- Computer vision
- Speech recognition
- ML
- NLP
- Application
- Workflow automation
- Predictive analytics
- Employee engagement
- Deployment
- Cloud based
- On premises
- Geography
- North America
- US
- Canada
- Mexico
- Europe
- Germany
- UK
- France
- APAC
- China
- Japan
- India
- South America
- Brazil
- Argentina
- Colombia
- Middle East and Africa
- Saudi Arabia
- UAE
- South Africa
- Rest of World (ROW)
- North America
By Technology Insights
The computer vision segment is estimated to witness significant growth during the forecast period.
Computer vision is transforming workplace operations by enabling machines to interpret and act on visual data, achieving over 90% accuracy in quality control tasks. This technology is foundational to intelligent business process management and AI-augmented human capabilities.
Its integration into workflow automation enhances safety monitoring and asset tracking, leveraging deep learning algorithms. As a core component of AI-driven productivity tools, computer vision supports automated decision-making systems.
Its use in intelligent process automation is driven by the need for ai for operational efficiency, with applications from production lines to retail analytics.
This technology, part of the broader trend of cognitive computing, is vital for creating more efficient and responsive business environments, showcasing significant advancements in machine learning (ml).
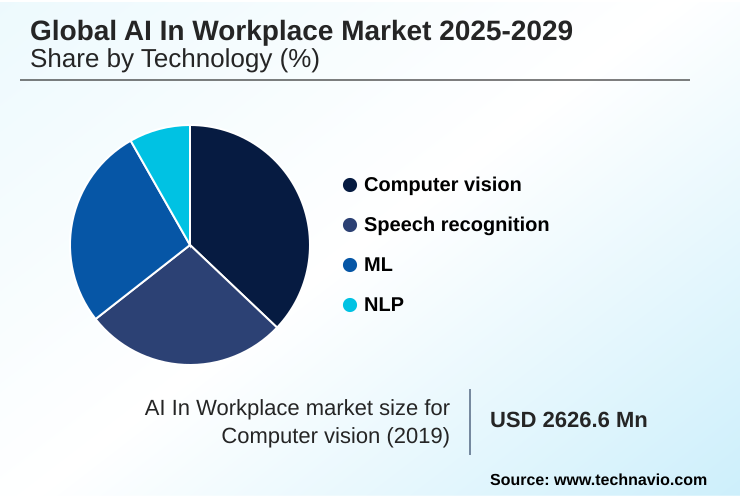
The Computer vision segment was valued at USD 38.71 billion in 2023 and showed a gradual increase during the forecast period.
Regional Analysis
North America is estimated to contribute 35.1% to the growth of the global market during the forecast period.Technavio’s analysts have elaborately explained the regional trends and drivers that shape the market during the forecast period.
See How AI In Workplace Market Demand is Rising in North America Get Free Sample
The geographic landscape of the market is characterized by distinct regional dynamics, with North America leading adoption due to its concentration of technology firms and venture capital.
The region accounts for over 35% of the market's incremental growth, driven by the relentless pursuit of heightened productivity.
Europe is distinguished by its strong regulatory focus on ethical AI frameworks and data privacy, fostering a market for trustworthy AI solutions.
Meanwhile, the APAC region is experiencing rapid growth, fueled by government-led digitalization initiatives and a massive consumer base, contributing over 22% of market expansion. AI-integrated workflows and intelligent communication tools are seeing high adoption in this region.
South America and the Middle East and Africa are emerging markets, with increasing investments in AI infrastructure to support sectors like finance and smart cities, driven by AI-powered business insights.
Market Dynamics
Our researchers analyzed the data with 2024 as the base year, along with the key drivers, trends, and challenges. A holistic analysis of drivers will help companies refine their marketing strategies to gain a competitive advantage.
- Strategic implementation across enterprises now focuses on specific, high-impact applications. The use of generative AI in core enterprise workflows is redefining content and code creation, while machine learning for predictive sales forecasting allows businesses to anticipate revenue streams with greater accuracy. Simultaneously, AI platforms for employee engagement analytics provide leadership with real-time insights into workforce sentiment.
- In operational contexts, computer vision for workplace safety monitoring is reducing incidents in industrial environments, a field where predictive maintenance in industrial settings also minimizes downtime. The application of natural language processing for customer support automates responses and improves service quality, complemented by conversational AI for employee self-service.
- For complex processes, hyperautomation for end-to-end process optimization is becoming critical, often combining hyperautomation using RPA and AI. Industries are also leveraging specialized tools; natural language processing for legal document review accelerates contract analysis, and intelligent document processing for invoices streamlines financial operations.
- Similarly, speech recognition for clinical documentation is reducing administrative burdens in healthcare, while AI-driven workflow automation in finance enhances accuracy. The ability to use AI for supply chain demand forecasting and machine learning models for fraud detection provides a significant competitive advantage.
- This is further supported by computer vision in manufacturing quality control and the establishment of ethical AI governance in HR processes. Organizations are also deploying generative AI for software code generation and AI-powered tools for personalized learning, moving toward a more adaptive and intelligent operational model.
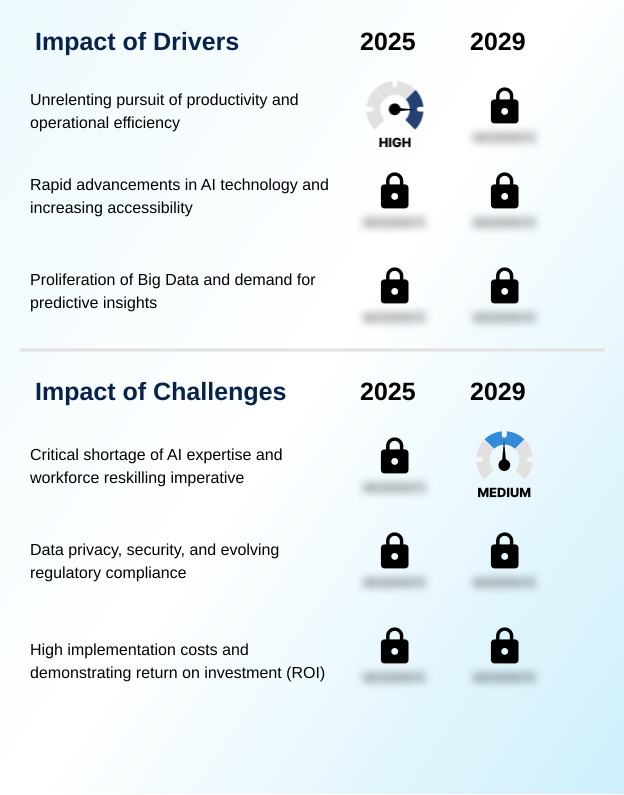
What are the key market drivers leading to the rise in the adoption of AI In Workplace Industry?
- The unrelenting pursuit of enhanced productivity and greater operational efficiency serves as a key driver for the adoption of AI in the workplace.
- The unrelenting pursuit of operational efficiency is a primary driver, with businesses leveraging AI-driven productivity tools to automate routine tasks and optimize resource allocation.
- The rapid pace of innovation, particularly in large language models (LLMs), has made sophisticated AI more accessible, enabling widespread use of automated decision-making systems.
- The proliferation of big data provides the fuel for machine learning algorithms, which underpin predictive analytics and AI-powered business insights.
- For instance, companies utilizing AI for supply chain optimization have reported a reduction in forecasting errors by as much as 50%. The integration of AI in enterprise applications is streamlining processes, leading to significant cost reductions and improved decision-making.
- This democratization of AI, facilitated by cloud platforms, is enabling even smaller enterprises to compete by harnessing powerful analytical capabilities.
What are the market trends shaping the AI In Workplace Industry?
- A significant trend shaping the market is the proliferation of generative AI and its increasing integration into core enterprise workflows. This development is fundamentally reshaping business processes and productivity standards.
- The market is increasingly shaped by the adoption of hyperautomation and AI governance frameworks. Organizations are moving beyond simple robotic process automation (RPA) to implement more holistic strategies combining process mining and intelligent business process management (iBPM). This approach allows businesses to automate complex, end-to-end workflows, with some achieving a 60% improvement in process cycle times.
- Concurrently, the focus on responsible AI has intensified, driving the adoption of solutions that ensure fairness and transparency. The deployment of AI for workforce automation is helping organizations address labor shortages and enhance productivity.
- The use of intelligent process automation and predictive HR solutions has become a key differentiator, helping businesses forecast talent needs with up to 30% greater accuracy than traditional methods. This strategic shift underscores the market's maturation toward scalable and ethical AI integration.
What challenges does the AI In Workplace Industry face during its growth?
- A critical challenge affecting industry growth is the significant shortage of specialized AI expertise, compounded by the imperative for comprehensive workforce reskilling.
- A significant challenge restraining market growth is the acute shortage of skilled AI talent, which hinders the development and management of complex systems like those used for talent analytics and decision intelligence. This scarcity creates an expensive and competitive hiring landscape, making it difficult for organizations to build proficient in-house teams.
- Furthermore, concerns regarding data privacy and security are paramount, with the need for robust AI model risk management and compliance with evolving regulations such as the EU AI Act. The high initial cost of implementation and the difficulty in demonstrating a clear return on investment (ROI) also present major hurdles.
- Many businesses struggle to quantify the benefits of AI, with some reporting that less than 50% of their AI projects deliver the expected financial returns, which can lead to executive hesitation and underfunded initiatives.
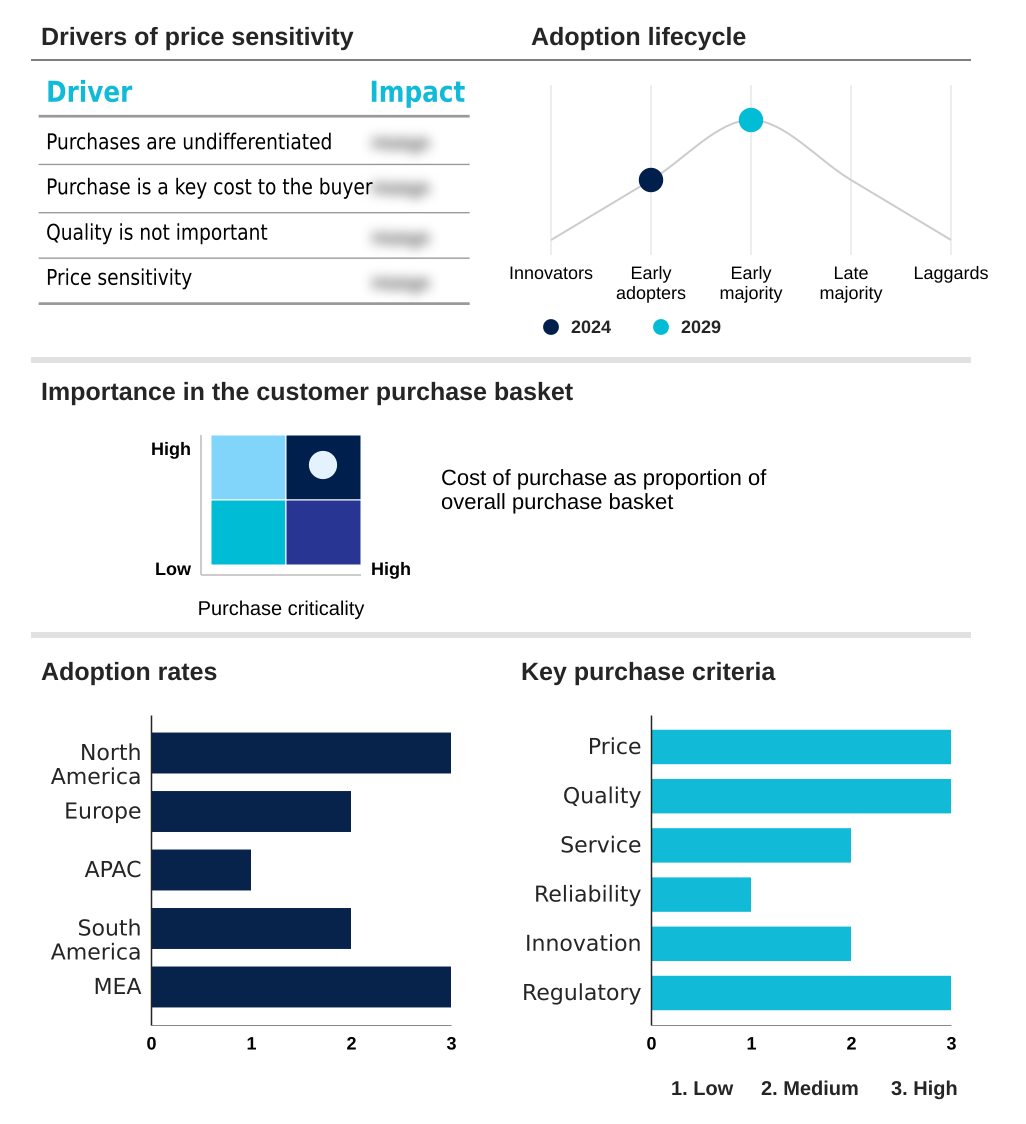
Exclusive Technavio Analysis on Customer Landscape
The ai in workplace market forecasting report includes the adoption lifecycle of the market, covering from the innovator’s stage to the laggard’s stage. It focuses on adoption rates in different regions based on penetration. Furthermore, the ai in workplace market report also includes key purchase criteria and drivers of price sensitivity to help companies evaluate and develop their market growth analysis strategies.
Customer Landscape of AI In Workplace Industry
Competitive Landscape
Companies are implementing various strategies, such as strategic alliances, ai in workplace market forecast, partnerships, mergers and acquisitions, geographical expansion, and product/service launches, to enhance their presence in the industry.
Alibaba Group Holding Ltd. - The company provides intelligent analytics, conversational AI, and machine learning-driven productivity solutions to enhance workplace effectiveness and support data-centric decision-making.
The industry research and growth report includes detailed analyses of the competitive landscape of the market and information about key companies, including:
- Alibaba Group Holding Ltd.
- Amazon Web Services Inc.
- Atos SE
- Baidu Inc.
- Google LLC
- Infosys Ltd.
- IBM Corp.
- Meta Platforms Inc.
- Microsoft Corp.
- NEC Corp.
- Oracle Corp.
- Sage Group Plc
- Salesforce Inc.
- SAP SE
- ServiceNow Inc.
- Slack Technologies LLC
- Tata Consultancy Services
- UiPath Inc.
- Workday Inc.
- Zoom Video Communications Inc.
Qualitative and quantitative analysis of companies has been conducted to help clients understand the wider business environment as well as the strengths and weaknesses of key industry players. Data is qualitatively analyzed to categorize companies as pure play, category-focused, industry-focused, and diversified; it is quantitatively analyzed to categorize companies as dominant, leading, strong, tentative, and weak.
Recent Development and News in Ai in workplace market
- In October 2024, IBM Corp. introduced a new set of AI-powered automation capabilities for its Apptio portfolio, designed to help business leaders automate financial management processes and optimize their IT spending across hybrid and multi-cloud environments.
- In December 2024, Baidu Inc. reported that its AI chatbot, Ernie Bot, surpassed 100 million users and was being increasingly integrated into enterprise software and workplace collaboration tools through its Qianfan platform.
- In January 2025, Salesforce Inc. announced the expansion of its Einstein 1 Platform with new generative AI features for its Data Cloud, enabling organizations to unify customer data and deliver more personalized employee and customer experiences.
- In March 2025, Amazon Web Services Inc. launched a new suite of enterprise-grade AI services aimed at accelerating hyperautomation, providing tools for intelligent document processing, advanced conversational AI, and no-code machine learning model development.
Dive into Technavio’s robust research methodology, blending expert interviews, extensive data synthesis, and validated models for unparalleled AI In Workplace Market insights. See full methodology.
| Market Scope | |
|---|---|
| Page number | 316 |
| Base year | 2024 |
| Historic period | 2019-2023 |
| Forecast period | 2025-2029 |
| Growth momentum & CAGR | Accelerate at a CAGR of 21.3% |
| Market growth 2025-2029 | USD 206501.4 million |
| Market structure | Fragmented |
| YoY growth 2024-2025(%) | 18.9% |
| Key countries | US, Canada, Mexico, Germany, UK, France, Italy, The Netherlands, Spain, China, Japan, India, South Korea, Australia, Indonesia, Brazil, Argentina, Colombia, Saudi Arabia, UAE, South Africa, Israel and Turkey |
| Competitive landscape | Leading Companies, Market Positioning of Companies, Competitive Strategies, and Industry Risks |
Research Analyst Overview
- The market is defined by a rapid evolution from standalone tools to deeply embedded intelligent systems. At the core are technologies like machine learning (ML), natural language processing (NLP), and computer vision, which are the engines of modern workflow automation and predictive analytics.
- The rise of generative AI and large language models (LLMs) has introduced new paradigms for employee engagement and productivity, enabling sophisticated applications such as real-time transcription and meeting intelligence. This technological shift compels boardroom-level decisions regarding AI governance and investment in hyperautomation strategies, which integrate robotic process automation (RPA), process mining, and intelligent business process management (iBPM).
- Enterprises are deploying intelligent document processing for efficiency gains and leveraging sentiment analysis for deeper insights. The push for decision intelligence is supported by cognitive computing and predictive maintenance, while talent management is being reshaped by AI-powered recruitment and talent analytics.
- The result is a workplace where intelligent communication is standard, with companies reporting up to a 40% reduction in time spent on repetitive administrative tasks, freeing employees for higher-value strategic work.
What are the Key Data Covered in this AI In Workplace Market Research and Growth Report?
-
What is the expected growth of the AI In Workplace Market between 2025 and 2029?
-
USD 206.50 billion, at a CAGR of 21.3%
-
-
What segmentation does the market report cover?
-
The report is segmented by Technology (Computer vision, Speech recognition, ML, NLP), Application (Workflow automation, Predictive analytics, Employee engagement), Deployment (Cloud based, On premises) and Geography (North America, Europe, APAC, South America, Middle East and Africa)
-
-
Which regions are analyzed in the report?
-
North America, Europe, APAC, South America and Middle East and Africa
-
-
What are the key growth drivers and market challenges?
-
Unrelenting pursuit of productivity and operational efficiency , Critical shortage of AI expertise and workforce reskilling imperative
-
-
Who are the major players in the AI In Workplace Market?
-
Alibaba Group Holding Ltd., Amazon Web Services Inc., Atos SE, Baidu Inc., Google LLC, Infosys Ltd., IBM Corp., Meta Platforms Inc., Microsoft Corp., NEC Corp., Oracle Corp., Sage Group Plc, Salesforce Inc., SAP SE, ServiceNow Inc., Slack Technologies LLC, Tata Consultancy Services, UiPath Inc., Workday Inc. and Zoom Video Communications Inc.
-
Market Research Insights
- The market's momentum is sustained by AI-driven productivity tools and automated decision-making systems that are reshaping enterprise operations. Organizations leveraging AI for operational efficiency see workforce productivity gains of up to 40%. The adoption of AI-augmented human capabilities through intelligent process automation and AI in enterprise applications is becoming standard.
- For instance, predictive HR solutions and AI for workforce automation are improving talent retention by over 25% compared to legacy methods. Smart digital assistants and conversational AI platforms handle a significant volume of internal and customer-facing inquiries. Adherence to ethical AI frameworks and explainable AI (XAI) is critical, as is robust AI model risk management for compliance.
- This is supported by data-driven decision support and AI-powered business insights, which are delivered through AI-integrated workflows. These cognitive tools for the workplace, especially AI for customer relationship management, are pivotal for automated content creation and AI in supply chain optimization, driving measurable performance improvements.
We can help! Our analysts can customize this ai in workplace market research report to meet your requirements.
 RIA -
RIA - 
