
AI Inference-as-a-service Market Size 2026-2030
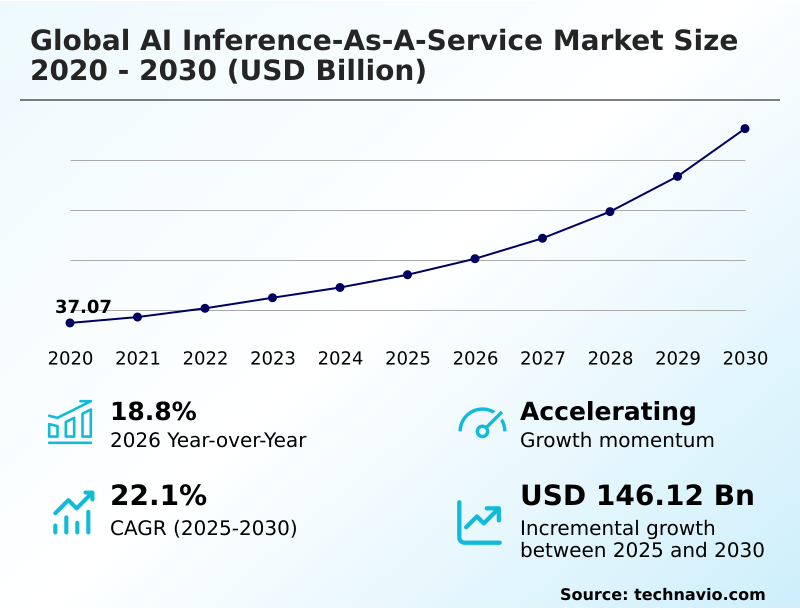
The AI Inference-as-a-service Market size was valued at USD 85.25 billion in 2025, growing at a CAGR of 22.1% during the forecast period 2026-2030.
Major Market Trends & Insights
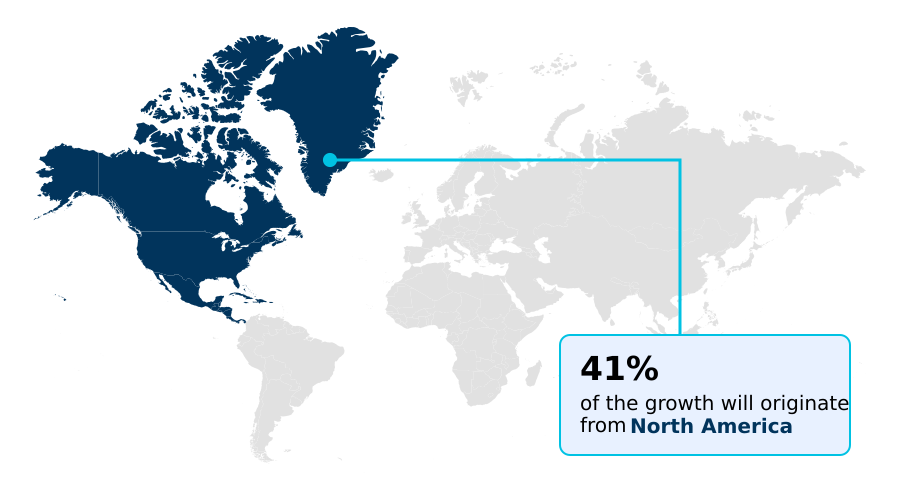
- North America dominated the market and accounted for a 41.1% growth during the forecast period.
- By Component - GPU segment was valued at USD 42.28 billion in 2024
- By Type - HBM segment accounted for the largest market revenue share in 2024
Market Size & Forecast
- Historic Market Opportunities 2020-2024: USD 194.30 billion
- Market Future Opportunities 2025-2030: USD 146.12 billion
- CAGR from 2025 to 2030 : 22.1%
Market Summary
- The AI inference-as-a-service market is rapidly transitioning from a specialized offering to a core enterprise utility, with adoption increasing by over 18% year-over-year. This shift is driven by the economic imperative for businesses to move from capital-intensive hardware procurement to a more flexible operational expense model, allowing them to leverage state-of-the-art AI capabilities without massive upfront investment.
- For instance, a retail company can use a service to process real-time sales data, optimizing inventory with 25% greater accuracy than traditional forecasting methods. While the increasing complexity of AI models fuels demand, the market faces significant challenges from hardware supply chain constraints, which can inflate costs and limit the availability of high-performance computing resources.
- As a result, providers are focused on delivering scalable, cost-effective solutions for deploying and managing machine learning models, enabling businesses to accelerate innovation and maintain a competitive edge.
What will be the Size of the AI Inference-as-a-service Market during the forecast period?
Get Key Insights on Market Forecast (PDF) Request Free Sample
How is the AI Inference-as-a-service Market Segmented?
The ai inference-as-a-service industry research report provides comprehensive data (region-wise segment analysis), with forecasts and analysis for the period 2026-2030, as well as historical data from 2020-2024 for the following segments.
- Component
- GPU
- ASIC
- CPU
- FPGA
- Type
- HBM
- DDR
- Application
- Machine learning models
- Generative AI
- Natural language processing
- Computer vision
- Deployment
- Cloud
- Edge
- Geography
- North America
- US
- Canada
- Mexico
- APAC
- China
- Japan
- India
- Europe
- Germany
- UK
- France
- South America
- Brazil
- Colombia
- Argentina
- Middle East and Africa
- Saudi Arabia
- UAE
- South Africa
- Rest of World (ROW)
- North America
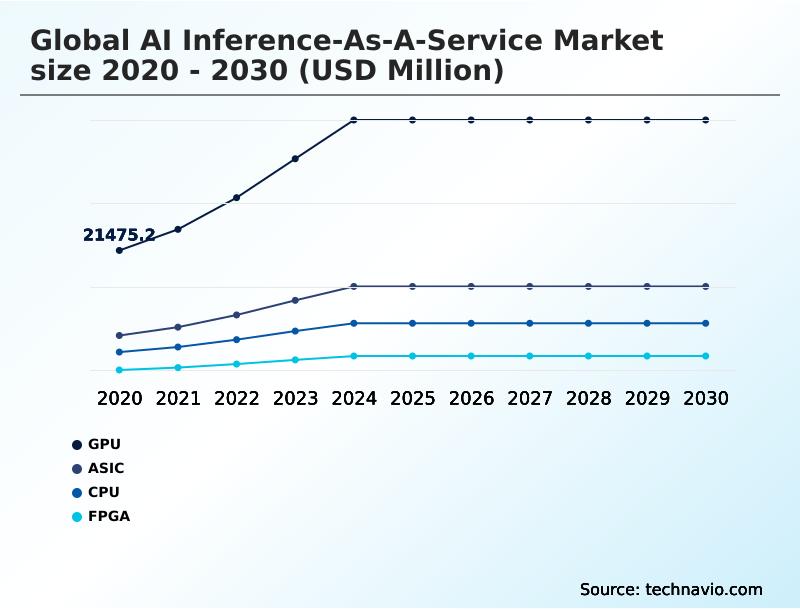
How is the AI Inference-as-a-service Market Segmented by Component?
The gpu segment is estimated to witness significant growth during the forecast period.
The global AI inference-as-a-service market is segmented by component, type, application, deployment, and geography. The GPU segment accounts for over 58% of the market, driven by its parallel processing capabilities for neural network execution.
However, the ASIC segment is the fastest-growing, with custom silicon designs from major cloud providers delivering a 30% improvement in energy-efficient model deployment for compute-intensive workloads.
Applications are segmented into machine learning models, generative AI, natural language processing, and computer vision, with generative AI seeing the most rapid adoption.
Deployment is split between cloud and edge, with cloud-based delivery models dominating due to the need for automated scaling and resource allocation. Geographically, North America leads, but APAC is closing the gap, supported by a strong hardware supply chain.
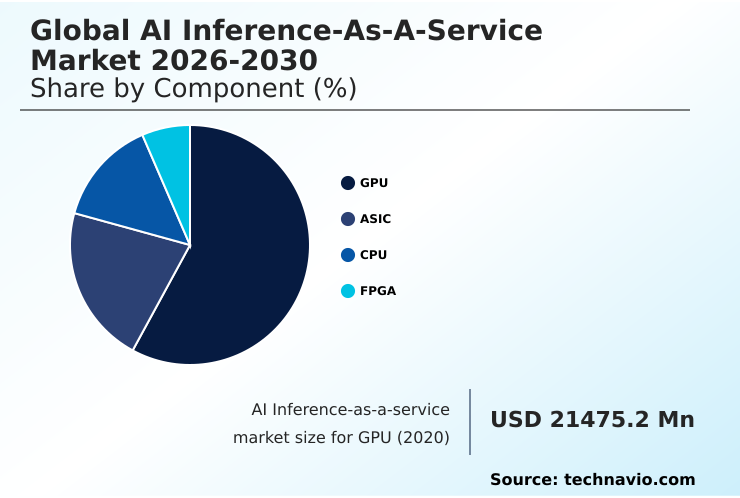
The GPU segment was valued at USD 42.28 billion in 2024 and showed a gradual increase during the forecast period.
How demand for the AI Inference-as-a-service market is rising in the leading region?
North America is estimated to contribute 41.1% to the growth of the global market during the forecast period.Technavio’s analysts have elaborately explained the regional trends and drivers that shape the market during the forecast period.
See How AI Inference-as-a-service Market demand is rising in North America Request Free Sample
The geographic landscape of the AI inference-as-a-service market is led by North America, which accounts for over 41% of the market's incremental growth, driven by the high concentration of hyperscale data centers and a mature enterprise adoption cycle in the US.
In contrast, the APAC region, which holds a 28.75% share of growth opportunity, is experiencing the fastest expansion, fueled by massive digital transformation initiatives and a strong domestic hardware supply chain in countries like China and South Korea.
This regional difference in adoption is significant; for example, enterprises in North America prioritize multi-cloud strategies to avoid vendor lock-in, while businesses in APAC are often leapfrogging directly to cloud-native, serverless inference models.
The US market alone is approximately 3.5 times larger than China's, reflecting the deep integration of AI into its economic infrastructure, while Europe focuses heavily on data sovereignty compliance, shaping its unique market dynamics.
What are the key Drivers, Trends, and Challenges in the AI Inference-as-a-service Market?
Our researchers analyzed the data with 2025 as the base year, along with the key drivers, trends, and challenges. A holistic analysis of drivers will help companies refine their marketing strategies to gain a competitive advantage.
- As organizations evaluate AI inference-as-a-service cost optimization techniques, understanding the trade-offs between different deployment models becomes critical. A key consideration in real-time vs batch processing for AI models is the impact on total cost of ownership, where batch jobs can reduce costs by over 30% by utilizing off-peak compute capacity.
- For applications requiring immediate responses, the focus shifts to how to reduce latency in AI inference, often involving a comparison of GPU vs ASIC for model inference. While GPUs offer flexibility for varied workloads, ASICs are purpose-built for specific tasks, delivering superior performance for high-volume, standardized models.
- The decision-making process is further complicated by the rise of large language models, prompting many to explore serverless inference for large language models to manage unpredictable loads without over-provisioning resources. Ultimately, developing effective multi-cloud AI inference deployment strategies is essential for building resilient and cost-efficient AI-powered applications that can scale globally.
What are the key market drivers leading to the rise in the adoption of AI Inference-as-a-service Industry?
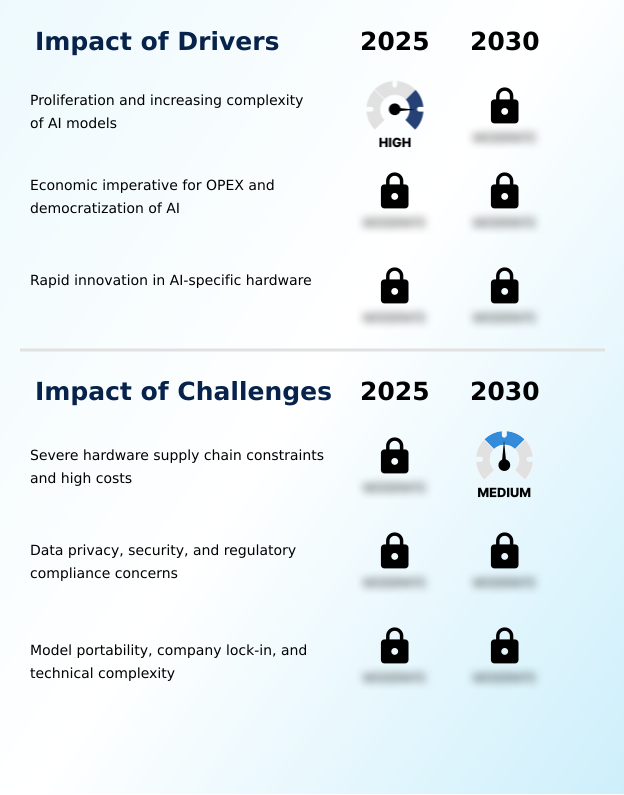
- The proliferation and increasing complexity of AI models, which now contain billions of parameters, necessitates the use of scalable, high-performance compute resources that are primarily available through service-based models.
- The primary driver for the AI inference-as-a-service market is the exponential growth in the complexity of AI models, which can now exceed a trillion parameters, making in-house deployment financially unviable for most organizations.
- This complexity necessitates the use of high-performance computing clusters available only through cloud services.
- A second key driver is the economic shift toward an operational expense (OPEX) model, which reduces the upfront capital investment for hardware by as much as 90% for startups.
- This democratization of AI allows smaller companies to access the same cutting-edge technology as large enterprises, fostering innovation across various sectors.
- By outsourcing infrastructure, businesses can focus on their core product development rather than on the complex and costly task of managing specialized hardware.
What are the market trends shaping the AI Inference-as-a-service Industry?
- The rise of serverless inference and higher-level abstractions is simplifying the deployment process for software developers. This trend makes the consumption of compute power as simple and reliable as calling a standard software function.
- A dominant trend in the AI inference-as-a-service market is the shift toward serverless inference, which improves developer productivity by over 40% by abstracting away infrastructure management. This approach allows users to deploy models without provisioning servers, as the platform automatically handles scaling and resource allocation, a critical factor for applications with unpredictable traffic.
- Consequently, this leads to a more efficient pay-as-you-go model. Another major trend is the emergence of hybrid and multi-cloud deployment patterns. Enterprises are increasingly distributing workloads across multiple providers to enhance resilience and avoid vendor lock-in.
- This strategy also allows them to leverage specific hardware advantages, such as using one provider for tensor processing units and another for superior edge network performance, optimizing for both cost and latency.
What challenges does the AI Inference-as-a-service Industry face during its growth?
- Severe hardware supply chain constraints and the high capital costs associated with cutting-edge accelerators present foundational barriers for service providers, impacting scalability and pricing.
- A foundational challenge for the AI inference-as-a-service market is the severe constraint and high cost of the hardware supply chain, with lead times for advanced GPUs increasing by over 50% in some cases. This scarcity inflates operational costs for service providers and creates a significant barrier to entry, favoring large hyperscalers. Another major hurdle is data privacy and regulatory compliance.
- Enterprises are often hesitant to transfer sensitive data to third-party clouds, and navigating complex regulations like GDPR can increase compliance overhead by up to 20%. The need for confidential computing and trusted execution environments adds another layer of technical complexity and cost, challenging providers to balance security with performance and affordability.
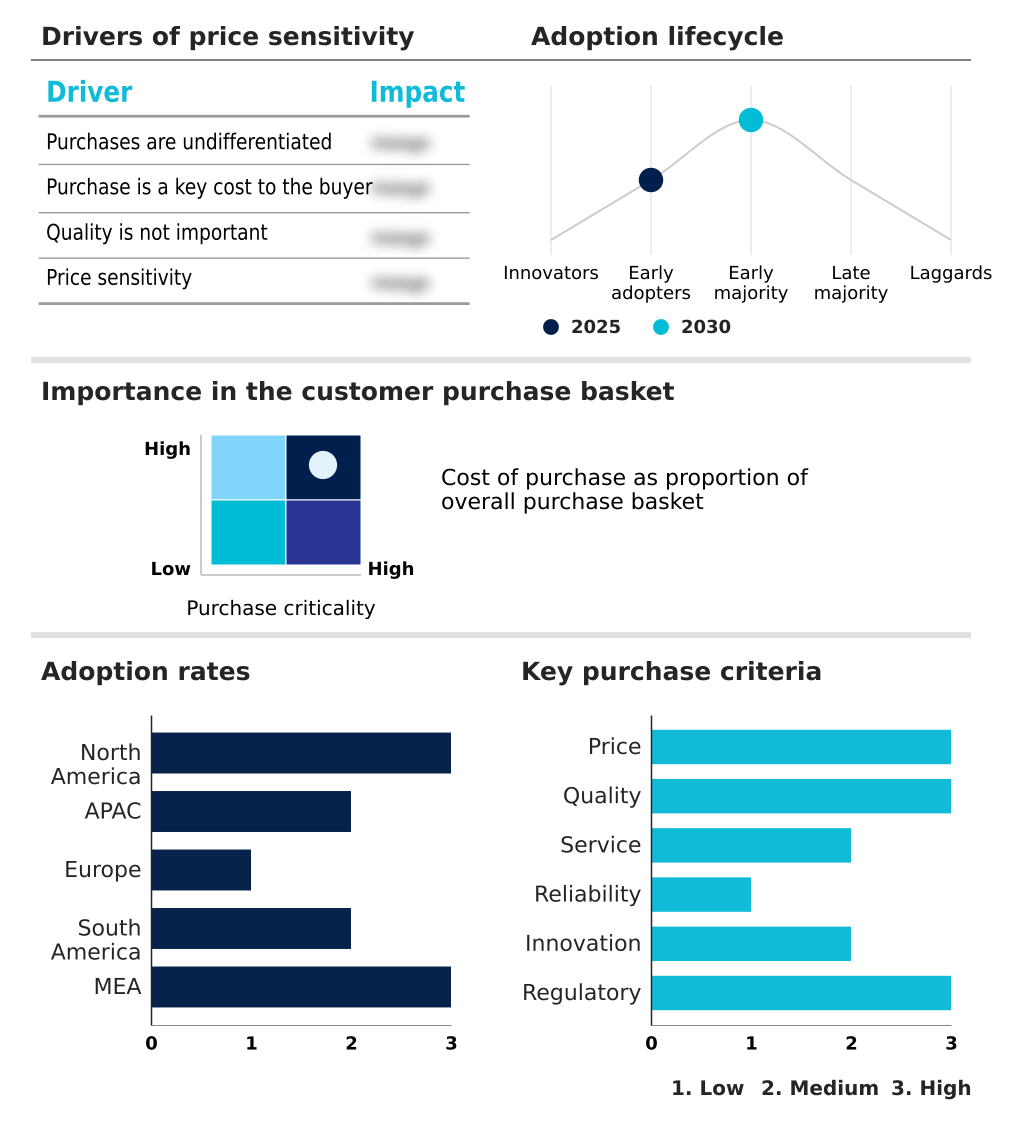
Exclusive Technavio Analysis on Customer Landscape
The ai inference-as-a-service market forecasting report includes the adoption lifecycle of the market, covering from the innovator’s stage to the laggard’s stage. It focuses on adoption rates in different regions based on penetration. Furthermore, the ai inference-as-a-service market report also includes key purchase criteria and drivers of price sensitivity to help companies evaluate and develop their market growth analysis strategies.
Customer Landscape of AI Inference-as-a-service Industry
Competitive Landscape
Companies are implementing various strategies, such as strategic alliances, ai inference-as-a-service market forecast, partnerships, mergers and acquisitions, geographical expansion, and product/service launches, to enhance their presence in the industry.
Amazon.com Inc. - Offerings center on providing scalable infrastructure for deploying machine learning models, simplifying model serving and production with low-latency APIs and optimized hardware.
The industry research and growth report includes detailed analyses of the competitive landscape of the market and information about key companies, including:
- Amazon.com Inc.
- Baseten
- BentoML
- Cerebras Systems Inc.
- CoreWeave Inc
- Databricks Inc.
- Deep Infra Inc.
- DigitalOcean Holdings Inc.
- Fireworks AI Inc.
- Google LLC
- Groq Inc.
- Hugging Face Inc.
- Lambda Labs Inc.
- Microsoft Corp.
- Modal Labs Inc.
- Nebius Group N.V
- NVIDIA Corp.
- Replicate Inc.
- RunPod Inc.
- SambaNova Systems Inc.
Qualitative and quantitative analysis of companies has been conducted to help clients understand the wider business environment as well as the strengths and weaknesses of key industry players. Data is qualitatively analyzed to categorize companies as pure play, category-focused, industry-focused, and diversified; it is quantitatively analyzed to categorize companies as dominant, leading, strong, tentative, and weak.
Market Intelligence Radar: High-Impact Developments & Growth Signals
- In the application software industry, the increasing adoption of cloud-based delivery models is reshaping how enterprises consume AI, driving demand for flexible, on-demand AI inference-as-a-service platforms that align with OPEX strategies.
- The enforcement of stringent data privacy regulations, such as GDPR, within the application software industry has spurred innovation in confidential computing and federated learning, directly influencing the architecture of secure AI inference-as-a-service offerings to ensure data sovereignty compliance.
- Shifts in the semiconductor supply chain are compelling application software providers to adopt more diverse AI-specific hardware, which in turn diversifies the AI inference-as-a-service landscape with multiple hardware options beyond standard GPUs.
- The growing demand for enterprise automation in sectors like finance and healthcare is creating a significant pull for specialized AI inference-as-a-service solutions that can be seamlessly integrated into existing application software workflows, improving efficiency and data-driven decision making.
Dive into Technavio’s robust research methodology, blending expert interviews, extensive data synthesis, and validated models for unparalleled AI Inference-as-a-service Market insights. See full methodology.
| Market Scope | |
|---|---|
| Page number | 316 |
| Base year | 2025 |
| Historic period | 2020-2024 |
| Forecast period | 2026-2030 |
| Growth momentum & CAGR | Accelerate at a CAGR of 22.1% |
| Market growth 2026-2030 | USD 146117.2 million |
| Market structure | Fragmented |
| YoY growth 2025-2026(%) | 18.8% |
| Key countries | US, Canada, Mexico, China, Japan, India, South Korea, Australia, Indonesia, Germany, UK, France, Italy, Spain, The Netherlands, Brazil, Colombia, Argentina, Saudi Arabia, UAE, South Africa, Israel and Turkey |
| Competitive landscape | Leading Companies, Market Positioning of Companies, Competitive Strategies, and Industry Risks |
Research Analyst Overview
- The AI inference-as-a-service market ecosystem is a multi-layered value chain, with the base layer comprising a concentrated group of semiconductor companies providing essential components like GPUs and high-bandwidth memory. These components are procured by a diverse set of cloud service providers, ranging from large hyperscalers, which command over 70% of the market, to specialized firms offering niche, high-performance solutions.
- These providers build and manage the infrastructure, offering AI inference capabilities through APIs and managed platforms. End-users, spanning industries from retail to finance, consume these services to deploy applications such as real-time fraud detection, which can improve accuracy by up to 15%, and generative AI.
- The ecosystem is supported by open-source communities and software companies that develop model optimization tools and deployment frameworks, facilitating the seamless integration of AI into business operations.
What are the Key Data Covered in this AI Inference-as-a-service Market Research and Growth Report?
-
What is the expected growth of the AI Inference-as-a-service Market between 2026 and 2030?
-
The AI Inference-as-a-service Market is expected to grow by USD 146.12 billion during 2026-2030, registering a CAGR of 22.1%. Year-over-year growth in 2026 is estimated at 18.8%%. This acceleration is shaped by proliferation and increasing complexity of ai models, which is intensifying demand across multiple end-use verticals covered in the report.
-
-
What segmentation does the market report cover?
-
The report is segmented by Component (GPU, ASIC, CPU, and FPGA), Type (HBM, and DDR), Application (Machine learning models, Generative AI, Natural language processing, and Computer vision), Deployment (Cloud, and Edge) and Geography (North America, APAC, Europe, South America, Middle East and Africa). Among these, the GPU segment is estimated to witness significant growth during the forecast period, driven by rising adoption across key application areas. Each segment includes detailed qualitative and quantitative analysis, along with historical data from 2020-2024 and forecasts through 2030 with year-over-year growth rates.
-
-
Which regions are analyzed in the report?
-
The report covers North America, APAC, Europe, South America and Middle East and Africa. North America is estimated to contribute 41.1% to market growth during the forecast period. Country-level analysis includes US, Canada, Mexico, China, Japan, India, South Korea, Australia, Indonesia, Germany, UK, France, Italy, Spain, The Netherlands, Brazil, Colombia, Argentina, Saudi Arabia, UAE, South Africa, Israel and Turkey, with dedicated market size tables and year-over-year growth for each.
-
-
What are the key growth drivers and market challenges?
-
The primary driver is proliferation and increasing complexity of ai models, which is accelerating investment and industry demand. The main challenge is severe hardware supply chain constraints and high costs, creating operational barriers for key market participants. The report quantifies the impact of each driver and challenge across 2026 and 2030 with comparative analysis.
-
-
Who are the major players in the AI Inference-as-a-service Market?
-
Key vendors include Amazon.com Inc., Baseten, BentoML, Cerebras Systems Inc., CoreWeave Inc, Databricks Inc., Deep Infra Inc., DigitalOcean Holdings Inc., Fireworks AI Inc., Google LLC, Groq Inc., Hugging Face Inc., Lambda Labs Inc., Microsoft Corp., Modal Labs Inc., Nebius Group N.V, NVIDIA Corp., Replicate Inc., RunPod Inc. and SambaNova Systems Inc.. The report provides qualitative and quantitative analysis categorizing companies as dominant, leading, strong, tentative, and weak based on their market positioning. Company profiles include business segment analysis, SWOT assessment, key offerings, and recent strategic developments.
-
Market Research Insights
- The competitive landscape of the AI inference-as-a-service market is defined by intense rivalry, with hyperscalers like Amazon.com Inc., Google LLC, and Microsoft Corp. leveraging their vast infrastructure to offer services at a scale that achieves up to 40% lower total cost of ownership for certain workloads.
- These established players are in a constant race for performance, developing their own custom silicon, such as Google's TPUs and AWS's Inferentia chips, to optimize neural network execution. Smaller, specialized firms like Groq Inc. and SambaNova Systems Inc. are disrupting the market by focusing on ultra-low-latency deployment for specific applications, a critical factor for industries like finance and autonomous systems.
- This innovation is a direct response to enterprise demand for more efficient and cost-effective ways to run increasingly complex models. However, all providers face the persistent challenge of severe hardware supply chain constraints, which can delay infrastructure expansion and impact service pricing.
We can help! Our analysts can customize this ai inference-as-a-service market research report to meet your requirements.
 RIA -
RIA - 
