
AI Investment Trends Market Size 2025-2029
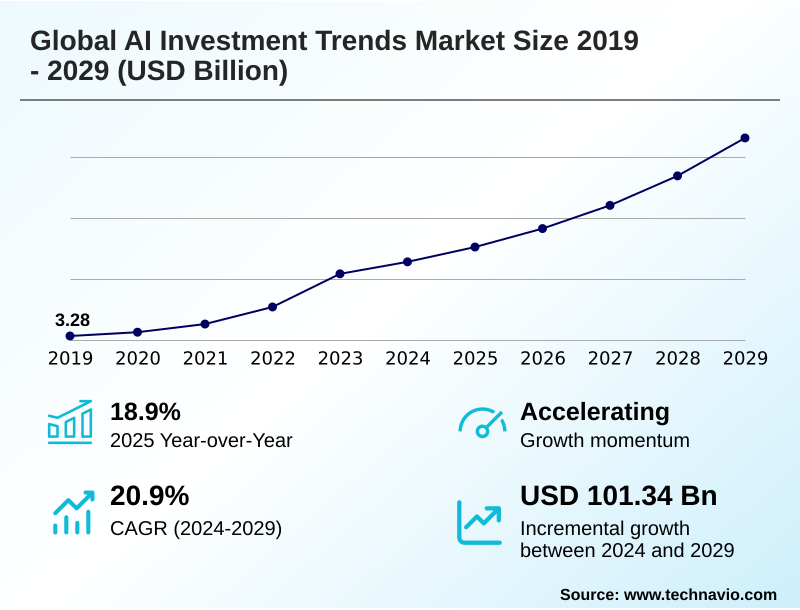
The ai investment trends market size is valued to increase by USD 101.34 billion, at a CAGR of 20.9% from 2024 to 2029. Proliferation of generative ai and large language models will drive the ai investment trends market.
Major Market Trends & Insights
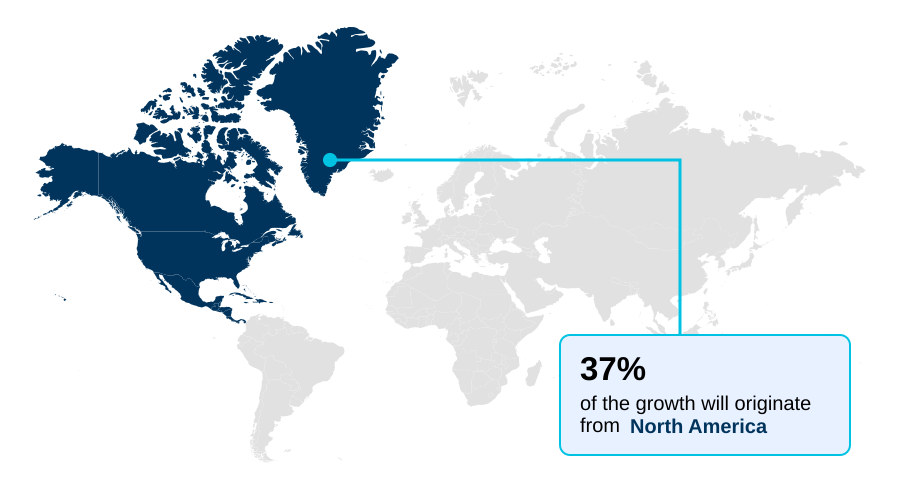
- North America dominated the market and accounted for a 37.4% growth during the forecast period.
- By Type - Venture capital segment was valued at USD 28.53 billion in 2023
- By Application - Algorithmic trading segment accounted for the largest market revenue share in 2023
Market Size & Forecast
- Market Opportunities: USD 162.02 billion
- Market Future Opportunities: USD 101.34 billion
- CAGR from 2024 to 2029 : 20.9%
Market Summary
- The AI investment trends market is defined by a strategic imperative compelling corporations and governments to secure a stake in next-generation technological infrastructure. The rapid utility of generative AI has shifted focus from theoretical potential to tangible economic value, igniting a global race for dominance.
- This has led to massive capital deployment into developing proprietary foundational models and the underlying hardware, creating a highly competitive landscape. Within this environment, a key business application involves using advanced AI for fraud detection in financial services.
- By analyzing millions of transactions in real-time, these systems can identify anomalous patterns indicative of sophisticated fraud with an accuracy that surpasses human capability, significantly reducing financial losses and enhancing security. However, this progress is tempered by challenges such as navigating divergent international regulations, the high cost of computational resources, and a persistent shortage of specialized talent.
- Success hinges on balancing aggressive investment in innovation with strategic management of these operational and regulatory risks.
What will be the Size of the AI Investment Trends Market during the forecast period?
Get Key Insights on Market Forecast (PDF) Get Free Sample
How is the AI Investment Trends Market Segmented?
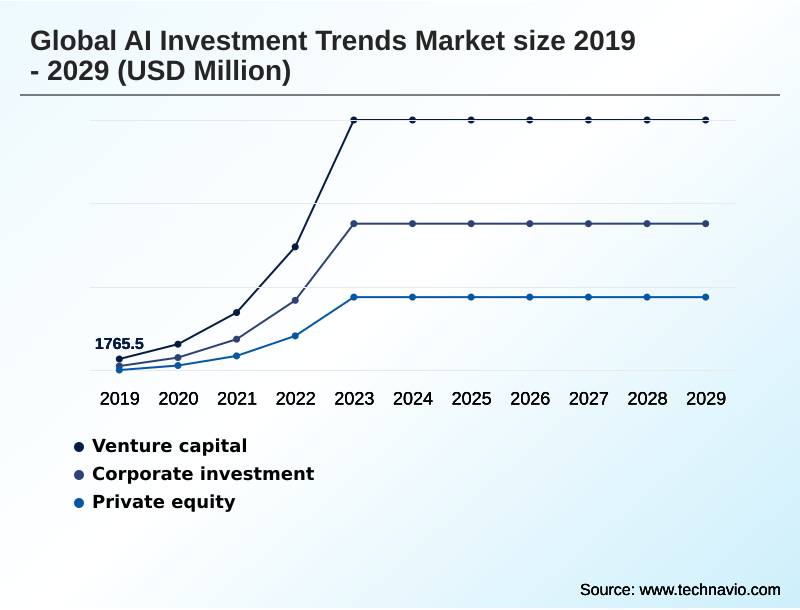
The ai investment trends industry research report provides comprehensive data (region-wise segment analysis), with forecasts and estimates in "USD million" for the period 2025-2029, as well as historical data from 2019-2023 for the following segments.
- Type
- Venture capital
- Corporate investment
- Private equity
- Application
- Algorithmic trading
- Fraud detection
- Portfolio optimization
- Technology
- Generative AI
- Natural language processing
- Predictive analytics
- Geography
- North America
- US
- Canada
- Mexico
- Europe
- UK
- Germany
- France
- APAC
- China
- India
- South Korea
- South America
- Brazil
- Argentina
- Colombia
- Middle East and Africa
- Israel
- UAE
- South Africa
- Rest of World (ROW)
- North America
By Type Insights
The venture capital segment is estimated to witness significant growth during the forecast period.
Venture capital remains a formative force in the AI investment trends market, characterized by a high-risk tolerance for funding early-stage companies with disruptive potential.
This segment's focus has sharply pivoted toward generative AI, with capital allocation in AI targeting foundational models and the specialized AI agents built upon them. The investment thesis centers on platform shifts, where AI-enabled workflows can redefine entire industries.
This aggressive strategy is driven by the pursuit of an AI-driven competitive advantage, compelling firms to make concentrated bets.
For instance, companies specializing in AI security firms have seen funding rounds increase by over 40% as investors back solutions for emerging threats like synthetic identity fraud, reflecting a clear trend in venture capital for foundational models.
This approach fuels enterprise AI adoption strategy by providing innovative tools for deep technology investment focus.
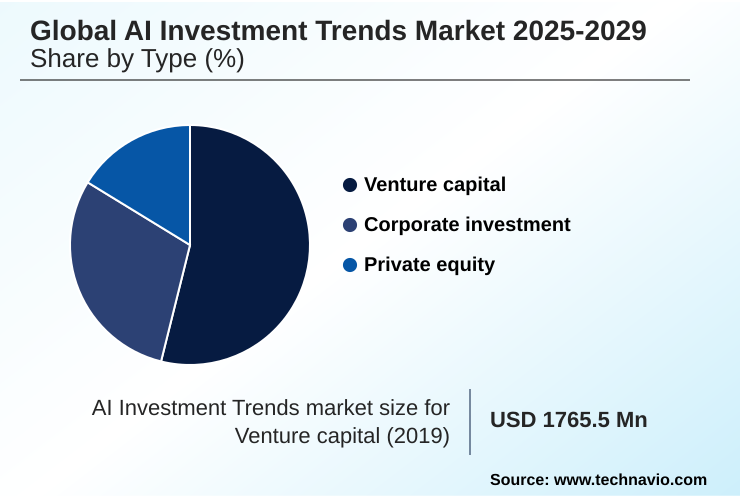
The Venture capital segment was valued at USD 28.53 billion in 2023 and showed a gradual increase during the forecast period.
Regional Analysis
North America is estimated to contribute 37.4% to the growth of the global market during the forecast period.Technavio’s analysts have elaborately explained the regional trends and drivers that shape the market during the forecast period.
See How AI Investment Trends Market Demand is Rising in North America Get Free Sample
The geographic landscape is defined by distinct regional strategies. North America leads in private equity AI consolidation and corporate investment, driven by a mature venture capital ecosystem focused on technologies like retrieval-augmented generation (RAG).
Its dominance is reflected in it accounting for over 37% of global AI startup ecosystem funding. In contrast, Europe prioritizes regulatory leadership and ethical AI development frameworks, focusing investment in industrial automation and explainable AI.
This has led to a 20% increase in funding for compliant-by-design AI platforms. APAC is characterized by the rapid rise of sovereign AI initiatives, particularly in China, aimed at achieving self-sufficiency in AI chip design and embodied AI.
Investment in AI compute in the region has grown substantially, with countries aiming to reduce technological dependence on foreign machine learning operations (MLOps) platforms.
Market Dynamics
Our researchers analyzed the data with 2024 as the base year, along with the key drivers, trends, and challenges. A holistic analysis of drivers will help companies refine their marketing strategies to gain a competitive advantage.
- Global investment strategies are increasingly nuanced, focusing on specific high-value applications and technologies. The impact of AI on portfolio optimization is a key area, as asset managers leverage advanced models to outperform benchmarks. Concurrently, the use of machine learning for fraud detection has become standard practice in financial technology, driving significant capital into security-focused AI.
- The integration of generative AI in enterprise workflows is another major theme, with corporate funding for AI research aimed at automating complex tasks. Natural language processing for document intelligence allows organizations to extract insights from vast unstructured data, improving operational efficiency.
- Similarly, the application of predictive analytics in supply chain management enhances forecasting accuracy by a margin that is double that of traditional statistical methods. Venture capital investment in AI startups continues to target disruptive technologies, while private equity acquisition of AI companies focuses on consolidating mature markets.
- The role of AI in industrial automation and using AI for algorithmic trading remain critical investment areas, alongside efforts to use AI to enhance customer experience.
- This is all set against a backdrop of a geopolitical race for AI supremacy, which fuels investment in developing sovereign AI capabilities and the strategic investment in AI infrastructure, though this is complicated by challenges of AI talent acquisition, regulatory compliance for AI systems, and evolving monetization strategies for AI models.
What are the key market drivers leading to the rise in the adoption of AI Investment Trends Industry?
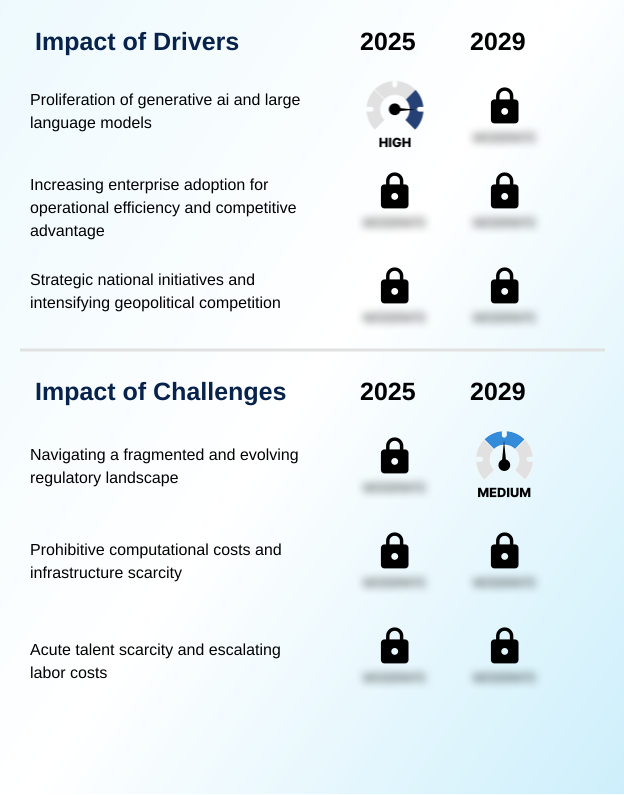
- The proliferation of generative AI and large language models is a primary driver fueling investment and innovation across the market.
- A primary driver is the demonstrable ROI from AI-powered software platforms, which facilitate superior data-driven decision making and unlock significant productivity gains. For example, deploying AI for non-diagnostic healthcare tasks has shown to reduce administrative workloads by over 35%.
- This push for operational efficiency is compelling broad enterprise adoption. The unprecedented proliferation of large language models (LLMs) and multimodal systems has also ignited a global investment race, fueling AI research and development funding.
- This is further amplified by strategic national imperatives, where governments view leadership in areas like high bandwidth memory (HBM) production and human-centric AI systems as crucial for economic security.
- Investment in the enterprise AI stack is surging, as companies that integrate AI achieve 15% higher risk-adjusted returns from AI compared to their peers.
What are the market trends shaping the AI Investment Trends Industry?
- The market is characterized by the accelerating proliferation and commercialization of advanced generative AI models. This trend is transitioning the technology from a research focus to a core driver of business value.
- The market is shaped by the proliferation of advanced generative AI models, which are now being commercialized for widespread use. This is driving an accelerated enterprise AI adoption strategy, with businesses integrating AI for operational transformation rather than just incremental improvements.
- The pursuit of tangible returns is evident, as the use of AI in supply chain optimization has reduced logistics errors by up to 22%. A parallel trend is the intensifying geopolitical AI competition, leading to strategic national initiatives for AI.
- This has given rise to sovereign AI infrastructure development, with some nations increasing public-private AI partnerships by 30% to build domestic AI compute capacity and reduce AI hardware dependency. These dynamics highlight a strategic shift toward securing technological leadership through vertical AI solutions and robust data governance solutions.
What challenges does the AI Investment Trends Industry face during its growth?
- Navigating a fragmented and evolving regulatory landscape presents a key challenge to sustained growth and global capital deployment in the industry.
- A significant challenge is navigating the fragmented and evolving regulatory AI fragmentation, which introduces compliance uncertainty and can increase time-to-market by up to 25%. This forces a regional, rather than global, investment strategy. Another major hurdle is the prohibitive cost and scarcity of computational infrastructure.
- The dependency on a few providers creates AI infrastructure bottlenecks, with the cost of training a state-of-the-art foundational model surpassing that of previous generations by a factor of ten. Compounding this is the acute AI talent scarcity, which ignites an intense and costly global war for prompt engineers and AI ethicists.
- This escalates labor costs and represents a significant operational risk, with AI talent acquisition and retention becoming a paramount factor in due diligence. Effective AI model monetization becomes difficult under these constraints.
Exclusive Technavio Analysis on Customer Landscape
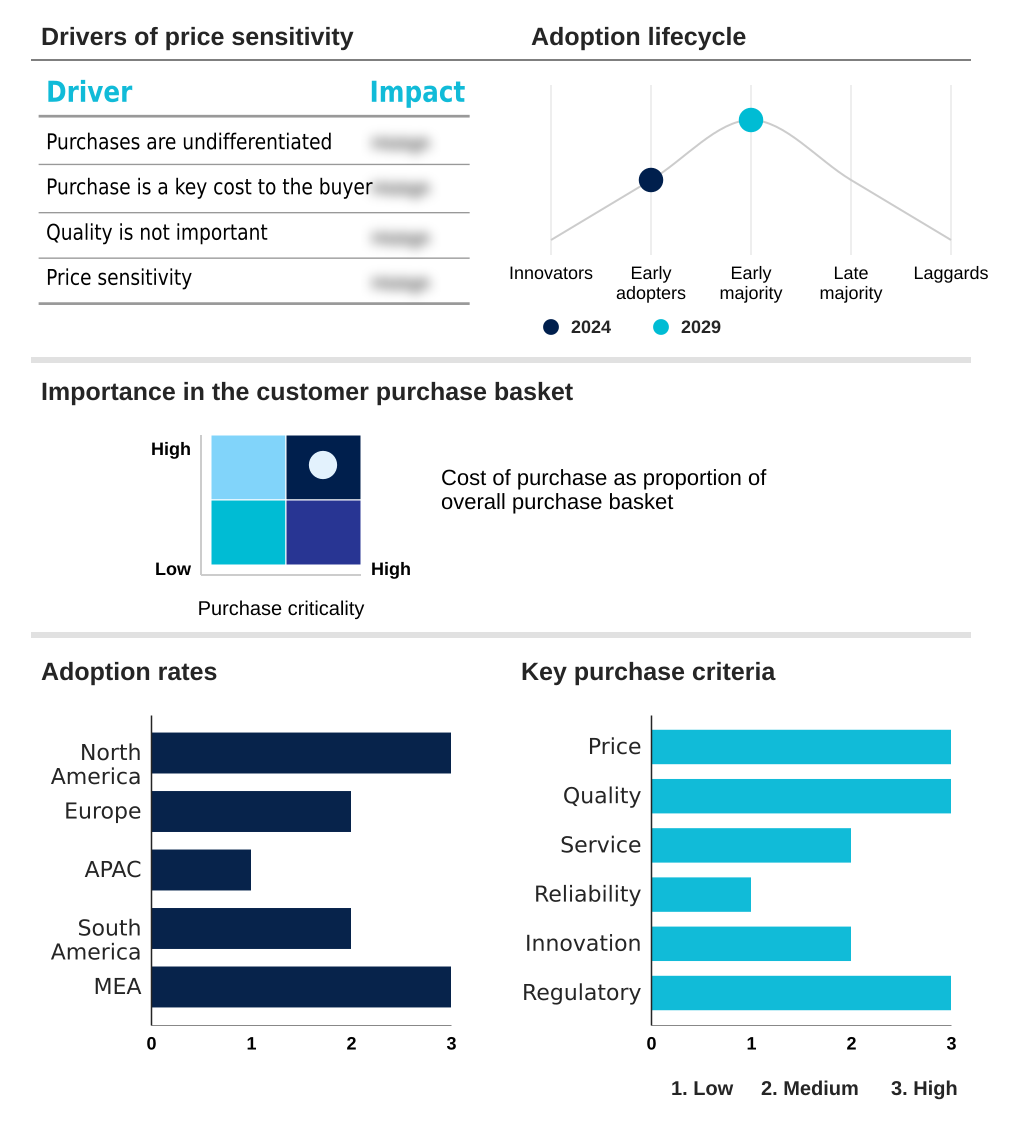
The ai investment trends market forecasting report includes the adoption lifecycle of the market, covering from the innovator’s stage to the laggard’s stage. It focuses on adoption rates in different regions based on penetration. Furthermore, the ai investment trends market report also includes key purchase criteria and drivers of price sensitivity to help companies evaluate and develop their market growth analysis strategies.
Customer Landscape of AI Investment Trends Industry
Competitive Landscape
Companies are implementing various strategies, such as strategic alliances, ai investment trends market forecast, partnerships, mergers and acquisitions, geographical expansion, and product/service launches, to enhance their presence in the industry.
Accel - Strategic capital allocation drives innovation in foundational AI and enterprise applications, enabling significant competitive advantages for adopters.
The industry research and growth report includes detailed analyses of the competitive landscape of the market and information about key companies, including:
- Accel
- AH Capital Management LLC
- Antler
- Baidu Inc.
- Databricks Inc.
- General Catalyst
- Intel Corp.
- Khosla Ventures
- Lakestar Advisors GmbH
- Lightspeed Management Co. LLC
- NVIDIA Corp.
- OpenAI
- Salesforce Inc.
- Samsung Electronics Co. Ltd.
- Sequoia Capital Operations LLC
- SoftBank Group Corp.
Qualitative and quantitative analysis of companies has been conducted to help clients understand the wider business environment as well as the strengths and weaknesses of key industry players. Data is qualitatively analyzed to categorize companies as pure play, category-focused, industry-focused, and diversified; it is quantitatively analyzed to categorize companies as dominant, leading, strong, tentative, and weak.
Recent Development and News in Ai investment trends market
- In May 2024, Hippocratic AI secured $53 million in a seed funding round to advance the development of a safety-oriented large language model specifically for non-diagnostic tasks within the healthcare sector.
- In April 2024, Microsoft announced a strategic partnership involving a $1.5 billion investment in G42, an Abu Dhabi-based AI company, to accelerate AI development and expand cloud infrastructure in the region.
- In March 2024, Nvidia unveiled its Blackwell platform, a new generation of powerful and costly GPU architecture designed to accelerate the training and deployment of large-scale AI models.
- In February 2024, Figure AI, a company developing humanoid robots, announced a significant funding round of $675 million from a consortium of venture capitalists and major corporate investors to advance its work in embodied AI.
Dive into Technavio’s robust research methodology, blending expert interviews, extensive data synthesis, and validated models for unparalleled AI Investment Trends Market insights. See full methodology.
| Market Scope | |
|---|---|
| Page number | 291 |
| Base year | 2024 |
| Historic period | 2019-2023 |
| Forecast period | 2025-2029 |
| Growth momentum & CAGR | Accelerate at a CAGR of 20.9% |
| Market growth 2025-2029 | USD 101341.4 million |
| Market structure | Fragmented |
| YoY growth 2024-2025(%) | 18.9% |
| Key countries | US, Canada, Mexico, UK, Germany, France, The Netherlands, Spain, Italy, China, India, South Korea, Japan, Australia, Indonesia, Brazil, Argentina, Colombia, Israel, UAE, South Africa, Saudi Arabia and Turkey |
| Competitive landscape | Leading Companies, Market Positioning of Companies, Competitive Strategies, and Industry Risks |
Research Analyst Overview
- Strategic capital allocation now defines the AI investment trends market, shifting from speculative bets to a focus on securing foundational technologies and infrastructure. A significant portion of private equity and corporate investment is directed toward the enterprise AI stack, including data governance solutions and cloud-based AI platforms essential for deploying large language models (LLMs).
- Investment in vertical AI solutions for sectors like finance and healthcare is surging, with a particular emphasis on algorithmic trading, portfolio optimization, and predictive analytics. The development of generative AI and multimodal systems remains a primary focus, requiring immense computational infrastructure and driving AI hardware dependency.
- The pursuit of sovereign AI capabilities and the high demand for machine learning operations (MLOps) platforms further underscore this trend.
- In boardroom discussions, the decision to invest in advanced AI is often justified by tangible outcomes; for example, the use of natural language processing has been shown to achieve a 30% reduction in error rates for document analysis, directly impacting compliance and operational budgets.
What are the Key Data Covered in this AI Investment Trends Market Research and Growth Report?
-
What is the expected growth of the AI Investment Trends Market between 2025 and 2029?
-
USD 101.34 billion, at a CAGR of 20.9%
-
-
What segmentation does the market report cover?
-
The report is segmented by Type (Venture capital, Corporate investment, Private equity), Application (Algorithmic trading, Fraud detection, Portfolio optimization), Technology (Generative AI, Natural language processing, Predictive analytics) and Geography (North America, Europe, APAC, South America, Middle East and Africa)
-
-
Which regions are analyzed in the report?
-
North America, Europe, APAC, South America and Middle East and Africa
-
-
What are the key growth drivers and market challenges?
-
Proliferation of generative ai and large language models , Navigating a fragmented and evolving regulatory landscape
-
-
Who are the major players in the AI Investment Trends Market?
-
Accel, AH Capital Management LLC, Antler, Baidu Inc., Databricks Inc., General Catalyst, Intel Corp., Khosla Ventures, Lakestar Advisors GmbH, Lightspeed Management Co. LLC, NVIDIA Corp., OpenAI, Salesforce Inc., Samsung Electronics Co. Ltd., Sequoia Capital Operations LLC and SoftBank Group Corp.
-
Market Research Insights
- The market's dynamics are influenced by a strategic shift toward practical, high-value AI deployment. The focus on AI-driven productivity gains is compelling organizations to rethink their operational frameworks, with the integration of AI into legacy systems showing a 20% improvement in processing efficiency.
- This enterprise AI adoption strategy prioritizes technologies that offer clear ROI, driving investment in AI for operational transformation. Consequently, solutions delivering hyper-personalized customer experiences are attracting significant capital, as they have been linked to a 15% increase in customer retention rates.
- The overarching goal is to achieve a sustainable AI-driven competitive advantage, pushing firms to explore everything from AI-powered digital forensics to optimizing complex supply chains. This pragmatic approach is shaping the flow of capital toward mature applications that promise immediate and measurable business impact.
We can help! Our analysts can customize this ai investment trends market research report to meet your requirements.
 RIA -
RIA - 
