AI Legal Tech Market Analysis, Size, and Forecast 2026-2030: North America (US, Canada, and Mexico), Europe (UK, Germany, and France), APAC (China, Japan, and Australia), South America (Brazil, Argentina, and Colombia), Middle East and Africa (UAE, Saudi Arabia, and Israel), and Rest of World (ROW)

AI Legal Tech Market Analysis, Size, and Forecast 2026-2030:
North America (US, Canada, and Mexico), Europe (UK, Germany, and France), APAC (China, Japan, and Australia), South America (Brazil, Argentina, and Colombia), Middle East and Africa (UAE, Saudi Arabia, and Israel), and Rest of World (ROW)

Published: May 2026 311 Pages SKU: IRTNTR80702

Market Overview at a Glance

$5.53 B
Market Opportunity
32.1%
CAGR 2025 - 2030
35.5%
North America Growth
$951.6 Mn
Solution segment 2024

AI Legal Tech Market Size 2026-2030

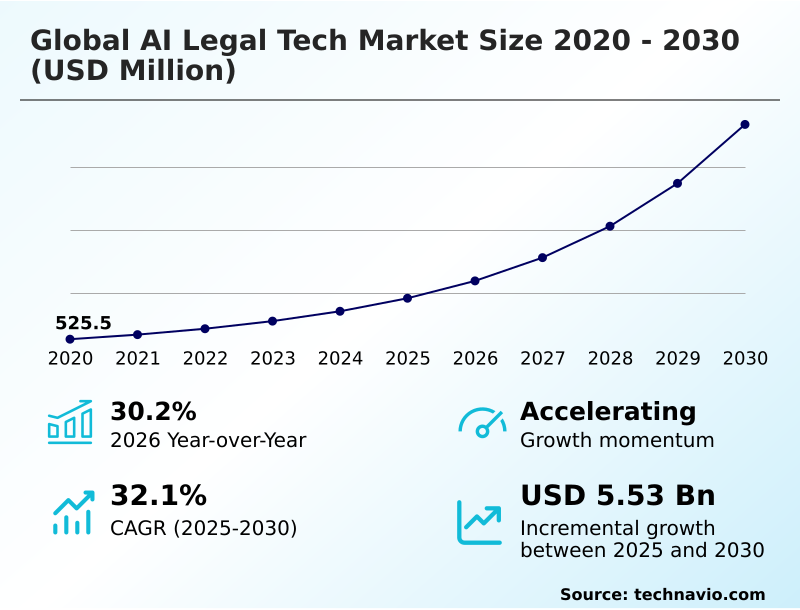
The AI Legal Tech Market size was valued at USD 1.83 billion in 2025, growing at a CAGR of 32.1% during the forecast period 2026-2030.

Major Market Trends & Insights

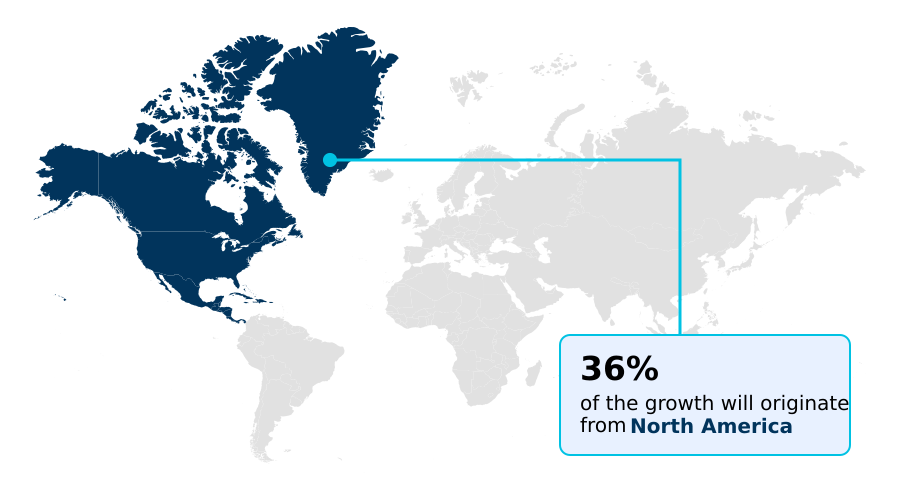
  • North America dominated the market and accounted for a 35.5% growth during the forecast period.
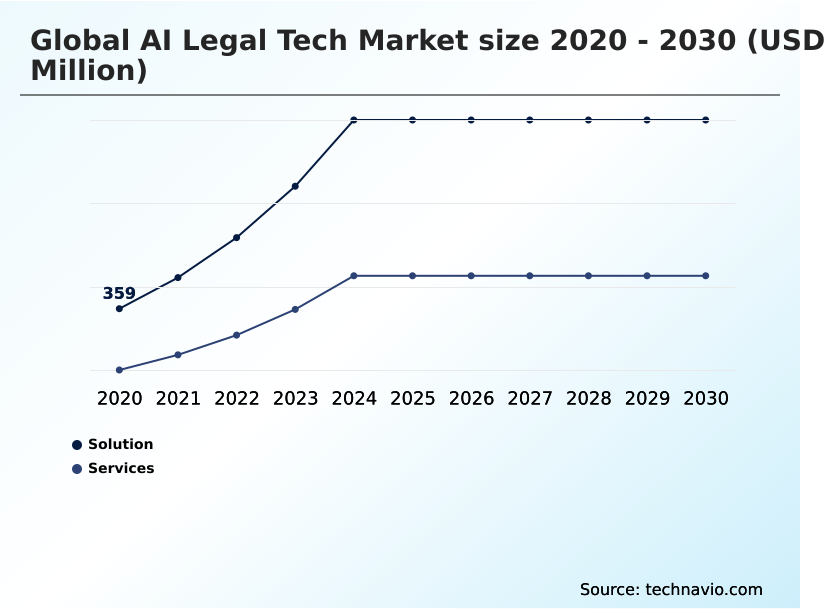
  • By Component - Solution segment was valued at USD 951.6 million in 2024
  • By Deployment - On-premises segment accounted for the largest market revenue share in 2024

Market Size & Forecast

  • Historic Market Opportunities 2020-2024: USD 6.83 billion
  • Market Future Opportunities 2025-2030: USD 5.53 billion
  • CAGR from 2025 to 2030 : 32.1%

Market Summary

  • The AI legal tech market is undergoing a profound structural evolution, with adoption rates for integrated solutions increasing by 30.2% year-over-year. This growth is driven by the shift from standalone tools to unified, intelligent ecosystems that embed AI directly into daily legal workflows.
  • For instance, a large law firm can leverage AI for e-discovery to review documents, reducing manual labor by over 60% and accelerating case preparation. The primary driver for this adoption is the escalating demand for cost efficiency, compelling firms to automate routine tasks to remain competitive.
  • However, this transition is challenged by the persistent issue of data privacy and the need for robust AI governance to prevent model hallucinations and maintain attorney-client privilege. Consequently, the market is characterized by a dual focus on advancing autonomous capabilities while ensuring the technology is secure, traceable, and ethically sound.

What will be the Size of the AI Legal Tech Market during the forecast period?

Get Key Insights on Market Forecast (PDF) Request Free Sample

How is the AI Legal Tech Market Segmented?

The ai legal tech industry research report provides comprehensive data (region-wise segment analysis), with forecasts and analysis for the period 2026-2030, as well as historical data from 2020-2024 for the following segments.

  • Component
    • Solution
    • Services
  • Deployment
    • On-premises
    • Cloud-based
  • Technology
    • Machine learning
    • Deep learning
    • Natural language processing
  • End-user
    • Law firms
    • Corporate departments
    • Government bodies
    • Others
  • Geography
    • North America
      • US
      • Canada
      • Mexico
    • Europe
      • UK
      • Germany
      • France
    • APAC
      • China
      • Japan
      • Australia
    • South America
      • Brazil
      • Argentina
      • Colombia
    • Middle East and Africa
      • UAE
      • Saudi Arabia
      • Israel
    • Rest of World (ROW)

How is the AI Legal Tech Market Segmented by Component?

The solution segment is estimated to witness significant growth during the forecast period.

The solution segment of the AI legal tech market, which accounts for 67% of the total revenue, is shifting from standalone applications to integrated platforms featuring agentic AI and legal reasoning.

These systems are not just tools but core infrastructure, with cloud-based deployment enabling a 30% faster rollout of updates compared to on-premises versions.

The adoption of workflow native intelligence and natural language processing is crucial, as it allows for the automation of complex tasks like e-discovery and contract lifecycle management. This integration supports alternative fee arrangements by providing predictable outcomes.

Solutions that incorporate generative AI and legal research automation are seeing higher demand, driven by the need for efficiency and the ability to handle large-scale document automation.

Request Free Sample

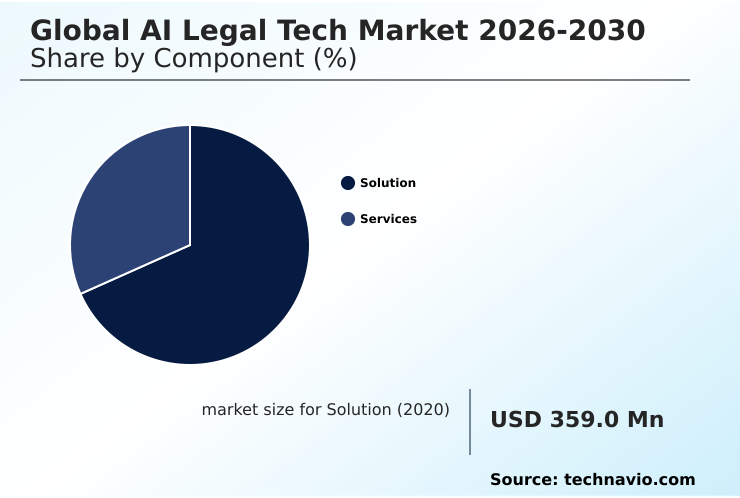
The Solution segment was valued at USD 951.6 million in 2024 and showed a gradual increase during the forecast period.

Request Free Sample

How demand for the AI Legal Tech market is rising in the leading region?

North America is estimated to contribute 35.5% to the growth of the global market during the forecast period.Technavio’s analysts have elaborately explained the regional trends and drivers that shape the market during the forecast period.

See How AI Legal Tech Market demand is rising in North America Request Free Sample

North America leads the AI legal tech market, commanding 35.5% of the incremental growth, driven by a mature legal sector that aggressively pursues digitization to enhance efficiency.

The US accounts for over 80% of the region's market, with law firms leveraging agentic AI for complex litigation and contract lifecycle management.

In contrast, the APAC market, with a CAGR of 33.1%, is the fastest-growing region, fueled by government-led initiatives to modernize judiciary systems and improve access to justice.

This geographic divergence is shaped by differing regulatory environments and adoption drivers; North America focuses on optimizing established workflows, while APAC prioritizes building digital-first legal infrastructure.

This dynamic requires providers to tailor their sovereign AI and data sovereignty solutions to meet distinct regional needs for data privacy regulations and legal reasoning.

What are the key Drivers, Trends, and Challenges in the AI Legal Tech Market?

Our researchers analyzed the data with 2025 as the base year, along with the key drivers, trends, and challenges. A holistic analysis of drivers will help companies refine their marketing strategies to gain a competitive advantage.

  • The strategic implementation of artificial intelligence within the legal sector is fundamentally reshaping operational paradigms, with a clear focus on enhancing efficiency and accuracy. Firms are increasingly exploring agentic AI for legal research, moving beyond simple keyword searches to sophisticated, context-aware inquiries that can synthesize information from vast legal corpora.
  • This is complemented by the growing use of AI legal tech contract analysis, which automates the review of complex agreements, identifies risks, and ensures compliance with internal playbooks. The role of natural language processing in law is central to these advancements, enabling machines to understand the nuance and intent of legal text.
  • For example, AI for legal document automation has streamlined the creation of everything from simple motions to complex transactional documents, reducing drafting time by over 50% in some use cases. However, this rapid adoption brings the challenge of AI governance in legal practice to the forefront.
  • Ensuring that these autonomous systems are transparent, auditable, and free from bias is a critical concern, demanding robust ethical AI frameworks.
  • The development of these technologies is not happening in a vacuum; it is a direct response to the need to manage escalating data volumes and client demands for more predictable, value-based pricing, a stark difference from firms still relying on a 100% manual review process.

What are the key market drivers leading to the rise in the adoption of AI Legal Tech Industry?

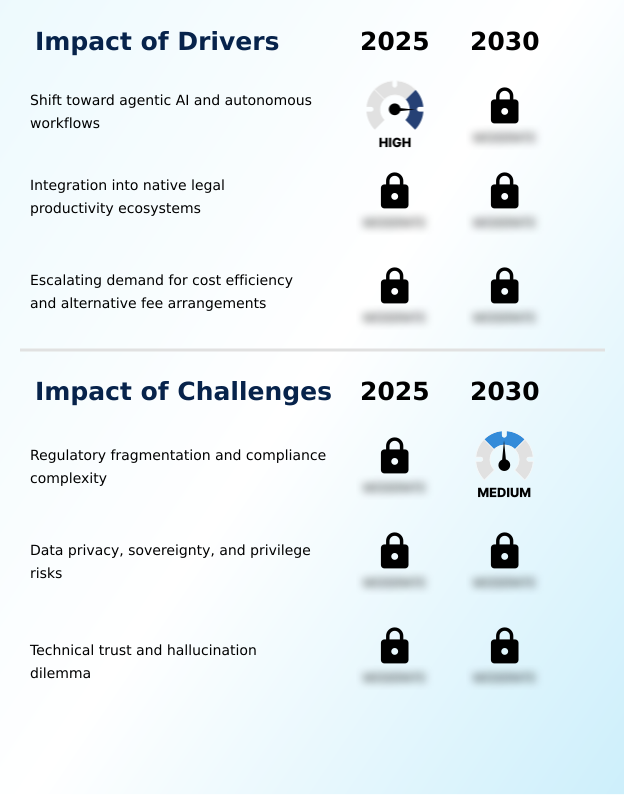
  • A key market driver is the fundamental shift toward agentic AI and autonomous workflows, which redefines legal process efficiency and enhances professional productivity.

  • The primary driver for the AI legal tech market is the intense economic pressure on law firms and corporate legal departments to deliver more value at a lower cost, which has accelerated the shift toward alternative fee arrangements.
  • Automating routine tasks such as document review and legal research automation can reduce operational costs by over 30%, a crucial factor in maintaining profitability.
  • This economic imperative is fueling the adoption of agentic AI, which can conduct initial case assessments and draft transaction documents, increasing legal operations productivity by up to 40%.
  • The deep integration of AI into native software ecosystems removes adoption friction, making advanced predictive litigation analytics and document automation accessible to firms of all sizes. This digital transformation enables a more strategic allocation of human resources.

What are the market trends shaping the AI Legal Tech Industry?

  • The market is undergoing a significant transition from reactive, prompt-based assistants toward proactive agentic AI. This evolution facilitates the autonomous execution of complex, multi-step legal workflows without constant human intervention.

  • The AI legal tech market is rapidly shifting from reactive chatbots to proactive, agentic AI systems that can execute multi-step workflows with over 90% autonomy. This trend toward autonomous workflows is not just about efficiency; it is a strategic move to free up legal professionals for higher-value advisory work.
  • For example, integrated systems are seeing 25% higher adoption rates than standalone tools because they embed legal reasoning and generative AI capabilities directly into existing document management platforms. This workflow-native intelligence minimizes disruption and accelerates the return on investment.
  • The focus on retrieval-augmented generation ensures that all AI-generated outputs are linked to citable authority, addressing the critical need for accuracy and reliability in legal practice.

What challenges does the AI Legal Tech Industry face during its growth?

  • Regulatory fragmentation and the escalating complexity of compliance across multiple jurisdictions present a primary challenge, hindering streamlined market growth and increasing operational costs.

  • A significant challenge hindering the AI legal tech market is the fragmented and evolving regulatory landscape, which can increase compliance overhead for technology providers by up to 20%. Navigating differing data privacy regulations and AI governance mandates across jurisdictions like North America and Europe creates significant development friction.
  • Furthermore, the inherent risk of AI model 'hallucination' poses a serious threat to the precision required in legal work, where a single error can have major consequences.
  • This technical trust deficit is compounded by data sovereignty concerns, forcing a difficult trade-off between leveraging powerful cloud-based large language models and maintaining attorney-client privilege through less powerful on-premises solutions, where processing latency can be 15% higher.

Exclusive Technavio Analysis on Customer Landscape

The ai legal tech market forecasting report includes the adoption lifecycle of the market, covering from the innovator’s stage to the laggard’s stage. It focuses on adoption rates in different regions based on penetration. Furthermore, the ai legal tech market report also includes key purchase criteria and drivers of price sensitivity to help companies evaluate and develop their market growth analysis strategies.

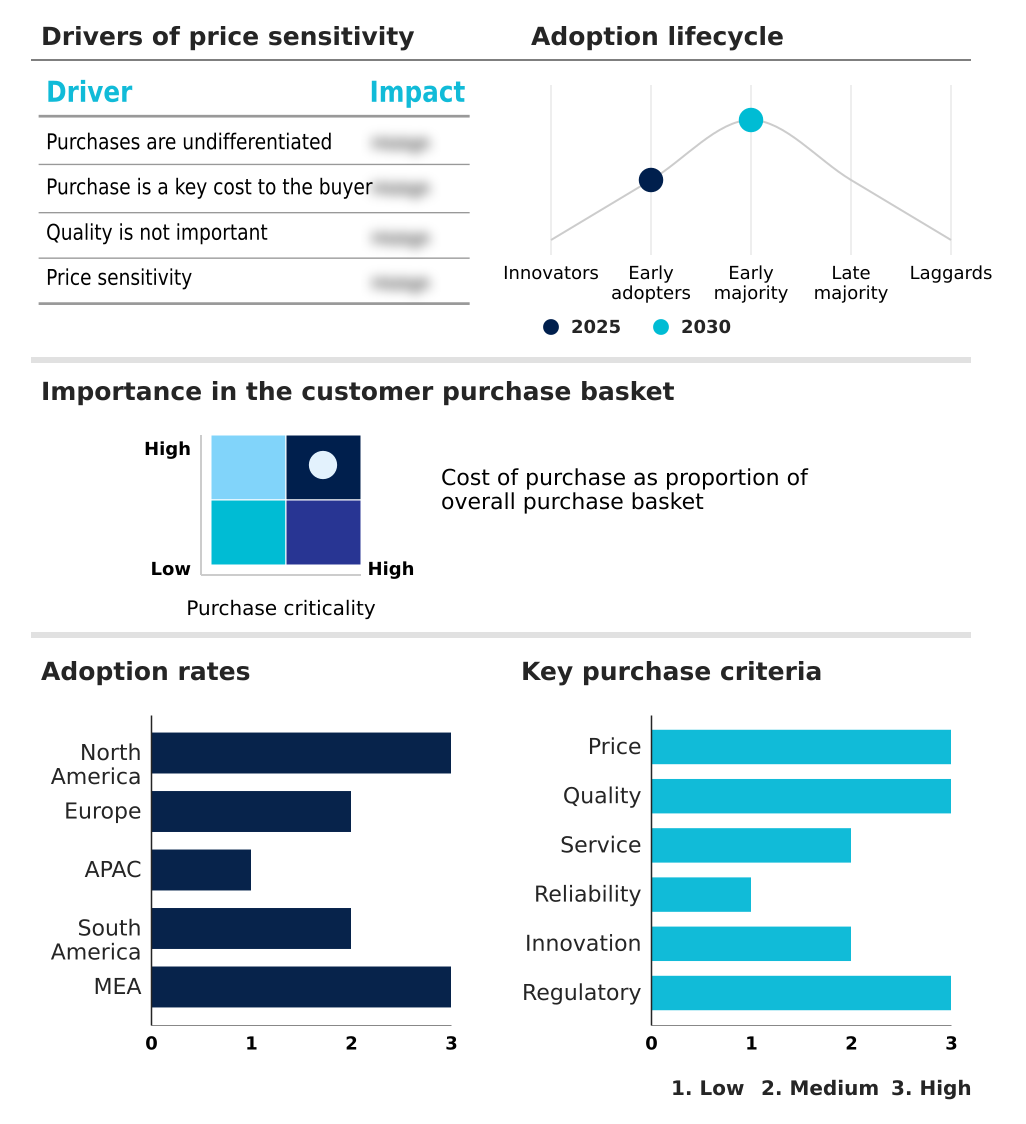
Customer Landscape of AI Legal Tech Industry

Competitive Landscape

Companies are implementing various strategies, such as strategic alliances, ai legal tech market forecast, partnerships, mergers and acquisitions, geographical expansion, and product/service launches, to enhance their presence in the industry.

Advanced Micro Devices Inc. - Vendors provide model inference optimization tools, enabling optimized deployment and acceleration of deep learning inference workloads on diverse hardware architectures, including CPUs, GPUs, and NPUs.

The industry research and growth report includes detailed analyses of the competitive landscape of the market and information about key companies, including:

  • Advanced Micro Devices Inc.
  • Alibaba Group Holding Ltd.
  • Amazon Web Services Inc.
  • Axelera AI
  • Cerebras Systems Inc.
  • Gcore
  • Google LLC
  • Graphcore Ltd.
  • Groq Inc.
  • Hugging Face Inc.
  • IBM Corp.
  • Intel Corp.
  • Microsoft Corp.
  • Modular Inc.
  • NVIDIA Corp.
  • Qualcomm Inc.
  • Recogni
  • Scaleway SAS
  • Tenstorrent Inc.

Qualitative and quantitative analysis of companies has been conducted to help clients understand the wider business environment as well as the strengths and weaknesses of key industry players. Data is qualitatively analyzed to categorize companies as pure play, category-focused, industry-focused, and diversified; it is quantitatively analyzed to categorize companies as dominant, leading, strong, tentative, and weak.

Market Intelligence Radar: High-Impact Developments & Growth Signals

  • In the Application Software industry, the widespread adoption of cloud-native platforms and SaaS delivery models has been pivotal, creating the necessary infrastructure for scalable, cloud-based AI legal tech solutions and enabling vendors to offer sophisticated capabilities through a subscription model, which enhances accessibility for smaller firms.
  • The increasing focus on data privacy regulations and security within the broader software market has directly impacted AI legal tech development, compelling providers to prioritize AI governance and data sovereignty, leading to innovations in sovereign AI and on-premises deployments to ensure compliance and protect attorney-client privilege.
  • A major trend in enterprise software is the embedding of intelligent automation and analytics directly into existing workflows, such as ERP and CRM systems. This has accelerated the demand for workflow-native intelligence in the legal field, where AI is integrated seamlessly into document management and communication tools.
  • The maturation of business process automation and robotic process automation (RPA) technologies has set a precedent for the adoption of more advanced autonomous systems. This has paved the way for the acceptance of agentic AI and autonomous workflows in the legal sector, shifting the focus from simple task automation to complex legal reasoning and multi-step workflow execution.

Dive into Technavio’s robust research methodology, blending expert interviews, extensive data synthesis, and validated models for unparalleled AI Legal Tech Market insights. See full methodology.

Market Scope
Page number 311
Base year 2025
Historic period 2020-2024
Forecast period 2026-2030
Growth momentum & CAGR Accelerate at a CAGR of 32.1%
Market growth 2026-2030 USD 5530.5 million
Market structure Fragmented
YoY growth 2025-2026(%) 30.2%
Key countries US, Canada, Mexico, UK, Germany, France, The Netherlands, Sweden, Italy, China, Japan, Australia, India, Singapore, Indonesia, Brazil, Argentina, Colombia, UAE, Saudi Arabia, Israel, South Africa and Nigeria
Competitive landscape Leading Companies, Market Positioning of Companies, Competitive Strategies, and Industry Risks

Request Free Sample

Research Analyst Overview

  • The AI legal tech market ecosystem is a complex network where technology providers, legal professionals, and regulatory bodies converge. Law firms and corporate legal departments represent the largest end-user segments, accounting for over 70% of the market, driven by the need to automate high-volume tasks and mitigate risk.
  • Foundational model providers and cloud infrastructure giants like AWS and Google form the base of the supply chain, offering the core computing power for model inference optimization. Solution providers build upon this foundation, creating specialized applications for e-discovery and contract lifecycle management.
  • Notably, on-premises deployment still holds a significant 59.5% market share, underscoring the paramount importance of data sovereignty and attorney-client privilege. This dynamic ecosystem is further shaped by regulatory bodies that are establishing AI governance frameworks, influencing the development of explainable AI and ethical AI frameworks to ensure accountability and trust.

What are the Key Data Covered in this AI Legal Tech Market Research and Growth Report?

  • What is the expected growth of the AI Legal Tech Market between 2026 and 2030?

    • The AI Legal Tech Market is expected to grow by USD 5.53 billion during 2026-2030, registering a CAGR of 32.1%. Year-over-year growth in 2026 is estimated at 30.2%%. This acceleration is shaped by shift toward agentic ai and autonomous workflows , which is intensifying demand across multiple end-use verticals covered in the report.

  • What segmentation does the market report cover?

    • The report is segmented by Component (Solution, and Services), Deployment (On-premises, and Cloud-based), Technology (Machine learning, Deep learning, and Natural language processing), End-user (Law firms, Corporate departments, Government bodies, and Others) and Geography (North America, Europe, APAC, South America, Middle East and Africa). Among these, the Solution segment is estimated to witness significant growth during the forecast period, driven by rising adoption across key application areas. Each segment includes detailed qualitative and quantitative analysis, along with historical data from 2020-2024 and forecasts through 2030 with year-over-year growth rates.

  • Which regions are analyzed in the report?

    • The report covers North America, Europe, APAC, South America and Middle East and Africa. North America is estimated to contribute 35.5% to market growth during the forecast period. Country-level analysis includes US, Canada, Mexico, UK, Germany, France, The Netherlands, Sweden, Italy, China, Japan, Australia, India, Singapore, Indonesia, Brazil, Argentina, Colombia, UAE, Saudi Arabia, Israel, South Africa and Nigeria, with dedicated market size tables and year-over-year growth for each.

  • What are the key growth drivers and market challenges?

    • The primary driver is shift toward agentic ai and autonomous workflows , which is accelerating investment and industry demand. The main challenge is regulatory fragmentation and compliance complexity , creating operational barriers for key market participants. The report quantifies the impact of each driver and challenge across 2026 and 2030 with comparative analysis.

  • Who are the major players in the AI Legal Tech Market?

    • Key vendors include Advanced Micro Devices Inc., Alibaba Group Holding Ltd., Amazon Web Services Inc., Axelera AI, Cerebras Systems Inc., Gcore, Google LLC, Graphcore Ltd., Groq Inc., Hugging Face Inc., IBM Corp., Intel Corp., Microsoft Corp., Modular Inc., NVIDIA Corp., Qualcomm Inc., Recogni, Scaleway SAS and Tenstorrent Inc.. The report provides qualitative and quantitative analysis categorizing companies as dominant, leading, strong, tentative, and weak based on their market positioning. Company profiles include business segment analysis, SWOT assessment, key offerings, and recent strategic developments.

Market Research Insights

  • The competitive landscape of the AI legal tech market, where North America accounts for over 35% of the incremental growth, is defined by a race to deliver autonomous, agentic systems. Key players like LexisNexis and Ironclad are pushing the envelope beyond simple automation. LexisNexis's global launch of its Protege AI assistant introduced sophisticated, citable workflows for disputes and case strategy.
  • Similarly, Ironclad's suite of contract intelligence agents aims to transform static documents into actionable business assets. These developments reflect a market-wide pivot from passive systems of record to dynamic systems of action. This transition is a direct response to enterprise demand for tools that can handle multi-step legal reasoning with minimal human oversight.
  • However, vendors face the persistent challenge of ensuring model reliability and mitigating the risks of AI hallucination, which requires significant investment in traceability and explainability features.

We can help! Our analysts can customize this ai legal tech market research report to meet your requirements.

Get in touch

1. Executive Summary

1.1 Market overview

Executive Summary - Chart on Market Overview
Executive Summary - Data Table on Market Overview
Executive Summary - Chart on Global Market Characteristics
Executive Summary - Chart on Market by Geography
Executive Summary - Chart on Market Segmentation by Component
Executive Summary - Chart on Market Segmentation by Deployment
Executive Summary - Chart on Market Segmentation by Technology
Executive Summary - Chart on Market Segmentation by End-user
Executive Summary - Chart on Incremental Growth
Executive Summary - Data Table on Incremental Growth
Executive Summary - Chart on Company Market Positioning

2. Technavio Analysis

2.1 Analysis of price sensitivity, lifecycle, customer purchase basket, adoption rates, and purchase criteria

2.2 Criticality of inputs and Factors of differentiation

Chart on Overview on criticality of inputs and factors of differentiation

2.3 Factors of disruption

Chart on Overview on factors of disruption

2.4 Impact of drivers and challenges

Chart on Impact of drivers and challenges in 2025 and 2030

3. Market Landscape

3.1 Market ecosystem

Chart on Parent Market
Data Table on - Parent Market

3.2 Market characteristics

Chart on Market characteristics analysis

3.3 Value chain analysis

Chart on Value chain analysis

4. Market Sizing

4.1 Market definition

Data Table on Offerings of companies included in the market definition

4.2 Market segment analysis

Market segments

4.3 Market size 2025

4.4 Market outlook: Forecast for 2025-2030

Chart on Global - Market size and forecast 2025-2030 ($ million)
Data Table on Global - Market size and forecast 2025-2030 ($ million)
Chart on Global Market: Year-over-year growth 2025-2030 (%)
Data Table on Global Market: Year-over-year growth 2025-2030 (%)

5. Historic Market Size

5.1 Global AI Legal Tech Market 2020 - 2024

Historic Market Size - Data Table on Global AI Legal Tech Market 2020 - 2024 ($ million)

5.2 Component segment analysis 2020 - 2024

Historic Market Size - Component Segment 2020 - 2024 ($ million)

5.3 Deployment segment analysis 2020 - 2024

Historic Market Size - Deployment Segment 2020 - 2024 ($ million)

5.4 Technology segment analysis 2020 - 2024

Historic Market Size - Technology Segment 2020 - 2024 ($ million)

5.5 End-user segment analysis 2020 - 2024

Historic Market Size - End-user Segment 2020 - 2024 ($ million)

5.6 Geography segment analysis 2020 - 2024

Historic Market Size - Geography Segment 2020 - 2024 ($ million)

5.7 Country segment analysis 2020 - 2024

Historic Market Size - Country Segment 2020 - 2024 ($ million)

6. Qualitative Analysis

6.1 Impact of geopolitical conflicts on global AI legal tech market

7. Five Forces Analysis

7.1 Five forces summary

Five forces analysis - Comparison between 2025 and 2030

7.2 Bargaining power of buyers

Bargaining power of buyers - Impact of key factors 2025 and 2030

7.3 Bargaining power of suppliers

Bargaining power of suppliers - Impact of key factors in 2025 and 2030

7.4 Threat of new entrants

Threat of new entrants - Impact of key factors in 2025 and 2030

7.5 Threat of substitutes

Threat of substitutes - Impact of key factors in 2025 and 2030

7.6 Threat of rivalry

Threat of rivalry - Impact of key factors in 2025 and 2030

7.7 Market condition

Chart on Market condition - Five forces 2025 and 2030

8. Market Segmentation by Component

8.1 Market segments

Chart on Component - Market share 2025-2030 (%)
Data Table on Component - Market share 2025-2030 (%)

8.2 Comparison by Component

Chart on Comparison by Component
Data Table on Comparison by Component

8.3 Solution - Market size and forecast 2025-2030

Chart on Solution - Market size and forecast 2025-2030 ($ million)
Data Table on Solution - Market size and forecast 2025-2030 ($ million)
Chart on Solution - Year-over-year growth 2025-2030 (%)
Data Table on Solution - Year-over-year growth 2025-2030 (%)

8.4 Services - Market size and forecast 2025-2030

Chart on Services - Market size and forecast 2025-2030 ($ million)
Data Table on Services - Market size and forecast 2025-2030 ($ million)
Chart on Services - Year-over-year growth 2025-2030 (%)
Data Table on Services - Year-over-year growth 2025-2030 (%)

8.5 Market opportunity by Component

Market opportunity by Component ($ million)
Data Table on Market opportunity by Component ($ million)

9. Market Segmentation by Deployment

9.1 Market segments

Chart on Deployment - Market share 2025-2030 (%)
Data Table on Deployment - Market share 2025-2030 (%)

9.2 Comparison by Deployment

Chart on Comparison by Deployment
Data Table on Comparison by Deployment

9.3 On-premises - Market size and forecast 2025-2030

Chart on On-premises - Market size and forecast 2025-2030 ($ million)
Data Table on On-premises - Market size and forecast 2025-2030 ($ million)
Chart on On-premises - Year-over-year growth 2025-2030 (%)
Data Table on On-premises - Year-over-year growth 2025-2030 (%)

9.4 Cloud-based - Market size and forecast 2025-2030

Chart on Cloud-based - Market size and forecast 2025-2030 ($ million)
Data Table on Cloud-based - Market size and forecast 2025-2030 ($ million)
Chart on Cloud-based - Year-over-year growth 2025-2030 (%)
Data Table on Cloud-based - Year-over-year growth 2025-2030 (%)

9.5 Market opportunity by Deployment

Market opportunity by Deployment ($ million)
Data Table on Market opportunity by Deployment ($ million)

10. Market Segmentation by Technology

10.1 Market segments

Chart on Technology - Market share 2025-2030 (%)
Data Table on Technology - Market share 2025-2030 (%)

10.2 Comparison by Technology

Chart on Comparison by Technology
Data Table on Comparison by Technology

10.3 Machine learning - Market size and forecast 2025-2030

Chart on Machine learning - Market size and forecast 2025-2030 ($ million)
Data Table on Machine learning - Market size and forecast 2025-2030 ($ million)
Chart on Machine learning - Year-over-year growth 2025-2030 (%)
Data Table on Machine learning - Year-over-year growth 2025-2030 (%)

10.4 Deep learning - Market size and forecast 2025-2030

Chart on Deep learning - Market size and forecast 2025-2030 ($ million)
Data Table on Deep learning - Market size and forecast 2025-2030 ($ million)
Chart on Deep learning - Year-over-year growth 2025-2030 (%)
Data Table on Deep learning - Year-over-year growth 2025-2030 (%)

10.5 Natural language processing - Market size and forecast 2025-2030

Chart on Natural language processing - Market size and forecast 2025-2030 ($ million)
Data Table on Natural language processing - Market size and forecast 2025-2030 ($ million)
Chart on Natural language processing - Year-over-year growth 2025-2030 (%)
Data Table on Natural language processing - Year-over-year growth 2025-2030 (%)

10.6 Market opportunity by Technology

Market opportunity by Technology ($ million)
Data Table on Market opportunity by Technology ($ million)

11. Market Segmentation by End-user

11.1 Market segments

Chart on End-user - Market share 2025-2030 (%)
Data Table on End-user - Market share 2025-2030 (%)

11.2 Comparison by End-user

Chart on Comparison by End-user
Data Table on Comparison by End-user

11.3 Law firms - Market size and forecast 2025-2030

Chart on Law firms - Market size and forecast 2025-2030 ($ million)
Data Table on Law firms - Market size and forecast 2025-2030 ($ million)
Chart on Law firms - Year-over-year growth 2025-2030 (%)
Data Table on Law firms - Year-over-year growth 2025-2030 (%)

11.4 Corporate departments - Market size and forecast 2025-2030

Chart on Corporate departments - Market size and forecast 2025-2030 ($ million)
Data Table on Corporate departments - Market size and forecast 2025-2030 ($ million)
Chart on Corporate departments - Year-over-year growth 2025-2030 (%)
Data Table on Corporate departments - Year-over-year growth 2025-2030 (%)

11.5 Government bodies - Market size and forecast 2025-2030

Chart on Government bodies - Market size and forecast 2025-2030 ($ million)
Data Table on Government bodies - Market size and forecast 2025-2030 ($ million)
Chart on Government bodies - Year-over-year growth 2025-2030 (%)
Data Table on Government bodies - Year-over-year growth 2025-2030 (%)

11.6 Others - Market size and forecast 2025-2030

Chart on Others - Market size and forecast 2025-2030 ($ million)
Data Table on Others - Market size and forecast 2025-2030 ($ million)
Chart on Others - Year-over-year growth 2025-2030 (%)
Data Table on Others - Year-over-year growth 2025-2030 (%)

11.7 Market opportunity by End-user

Market opportunity by End-user ($ million)
Data Table on Market opportunity by End-user ($ million)

12. Customer Landscape

12.1 Customer landscape overview

Analysis of price sensitivity, lifecycle, customer purchase basket, adoption rates, and purchase criteria

13. Geographic Landscape

13.1 Geographic segmentation

Chart on Market share by geography 2025-2030 (%)
Data Table on Market share by geography 2025-2030 (%)

13.2 Geographic comparison

Chart on Geographic comparison
Data Table on Geographic comparison

13.3 North America - Market size and forecast 2025-2030

Chart on North America - Market size and forecast 2025-2030 ($ million)
Data Table on North America - Market size and forecast 2025-2030 ($ million)
Chart on North America - Year-over-year growth 2025-2030 (%)
Data Table on North America - Year-over-year growth 2025-2030 (%)
Chart on Regional Comparison - North America
Data Table on Regional Comparison - North America

13.3.1 US - Market size and forecast 2025-2030

Chart on US - Market size and forecast 2025-2030 ($ million)
Data Table on US - Market size and forecast 2025-2030 ($ million)
Chart on US - Year-over-year growth 2025-2030 (%)
Data Table on US - Year-over-year growth 2025-2030 (%)

13.3.2 Canada - Market size and forecast 2025-2030

Chart on Canada - Market size and forecast 2025-2030 ($ million)
Data Table on Canada - Market size and forecast 2025-2030 ($ million)
Chart on Canada - Year-over-year growth 2025-2030 (%)
Data Table on Canada - Year-over-year growth 2025-2030 (%)

13.3.3 Mexico - Market size and forecast 2025-2030

Chart on Mexico - Market size and forecast 2025-2030 ($ million)
Data Table on Mexico - Market size and forecast 2025-2030 ($ million)
Chart on Mexico - Year-over-year growth 2025-2030 (%)
Data Table on Mexico - Year-over-year growth 2025-2030 (%)

13.4 Europe - Market size and forecast 2025-2030

Chart on Europe - Market size and forecast 2025-2030 ($ million)
Data Table on Europe - Market size and forecast 2025-2030 ($ million)
Chart on Europe - Year-over-year growth 2025-2030 (%)
Data Table on Europe - Year-over-year growth 2025-2030 (%)
Chart on Regional Comparison - Europe
Data Table on Regional Comparison - Europe

13.4.1 UK - Market size and forecast 2025-2030

Chart on UK - Market size and forecast 2025-2030 ($ million)
Data Table on UK - Market size and forecast 2025-2030 ($ million)
Chart on UK - Year-over-year growth 2025-2030 (%)
Data Table on UK - Year-over-year growth 2025-2030 (%)

13.4.2 Germany - Market size and forecast 2025-2030

Chart on Germany - Market size and forecast 2025-2030 ($ million)
Data Table on Germany - Market size and forecast 2025-2030 ($ million)
Chart on Germany - Year-over-year growth 2025-2030 (%)
Data Table on Germany - Year-over-year growth 2025-2030 (%)

13.4.3 France - Market size and forecast 2025-2030

Chart on France - Market size and forecast 2025-2030 ($ million)
Data Table on France - Market size and forecast 2025-2030 ($ million)
Chart on France - Year-over-year growth 2025-2030 (%)
Data Table on France - Year-over-year growth 2025-2030 (%)

13.4.4 The Netherlands - Market size and forecast 2025-2030

Chart on The Netherlands - Market size and forecast 2025-2030 ($ million)
Data Table on The Netherlands - Market size and forecast 2025-2030 ($ million)
Chart on The Netherlands - Year-over-year growth 2025-2030 (%)
Data Table on The Netherlands - Year-over-year growth 2025-2030 (%)

13.4.5 Sweden - Market size and forecast 2025-2030

Chart on Sweden - Market size and forecast 2025-2030 ($ million)
Data Table on Sweden - Market size and forecast 2025-2030 ($ million)
Chart on Sweden - Year-over-year growth 2025-2030 (%)
Data Table on Sweden - Year-over-year growth 2025-2030 (%)

13.4.6 Italy - Market size and forecast 2025-2030

Chart on Italy - Market size and forecast 2025-2030 ($ million)
Data Table on Italy - Market size and forecast 2025-2030 ($ million)
Chart on Italy - Year-over-year growth 2025-2030 (%)
Data Table on Italy - Year-over-year growth 2025-2030 (%)

13.5 APAC - Market size and forecast 2025-2030

Chart on APAC - Market size and forecast 2025-2030 ($ million)
Data Table on APAC - Market size and forecast 2025-2030 ($ million)
Chart on APAC - Year-over-year growth 2025-2030 (%)
Data Table on APAC - Year-over-year growth 2025-2030 (%)
Chart on Regional Comparison - APAC
Data Table on Regional Comparison - APAC

13.5.1 China - Market size and forecast 2025-2030

Chart on China - Market size and forecast 2025-2030 ($ million)
Data Table on China - Market size and forecast 2025-2030 ($ million)
Chart on China - Year-over-year growth 2025-2030 (%)
Data Table on China - Year-over-year growth 2025-2030 (%)

13.5.2 Japan - Market size and forecast 2025-2030

Chart on Japan - Market size and forecast 2025-2030 ($ million)
Data Table on Japan - Market size and forecast 2025-2030 ($ million)
Chart on Japan - Year-over-year growth 2025-2030 (%)
Data Table on Japan - Year-over-year growth 2025-2030 (%)

13.5.3 Australia - Market size and forecast 2025-2030

Chart on Australia - Market size and forecast 2025-2030 ($ million)
Data Table on Australia - Market size and forecast 2025-2030 ($ million)
Chart on Australia - Year-over-year growth 2025-2030 (%)
Data Table on Australia - Year-over-year growth 2025-2030 (%)

13.5.4 India - Market size and forecast 2025-2030

Chart on India - Market size and forecast 2025-2030 ($ million)
Data Table on India - Market size and forecast 2025-2030 ($ million)
Chart on India - Year-over-year growth 2025-2030 (%)
Data Table on India - Year-over-year growth 2025-2030 (%)

13.5.5 Singapore - Market size and forecast 2025-2030

Chart on Singapore - Market size and forecast 2025-2030 ($ million)
Data Table on Singapore - Market size and forecast 2025-2030 ($ million)
Chart on Singapore - Year-over-year growth 2025-2030 (%)
Data Table on Singapore - Year-over-year growth 2025-2030 (%)

13.5.6 Indonesia - Market size and forecast 2025-2030

Chart on Indonesia - Market size and forecast 2025-2030 ($ million)
Data Table on Indonesia - Market size and forecast 2025-2030 ($ million)
Chart on Indonesia - Year-over-year growth 2025-2030 (%)
Data Table on Indonesia - Year-over-year growth 2025-2030 (%)

13.6 South America - Market size and forecast 2025-2030

Chart on South America - Market size and forecast 2025-2030 ($ million)
Data Table on South America - Market size and forecast 2025-2030 ($ million)
Chart on South America - Year-over-year growth 2025-2030 (%)
Data Table on South America - Year-over-year growth 2025-2030 (%)
Chart on Regional Comparison - South America
Data Table on Regional Comparison - South America

13.6.1 Brazil - Market size and forecast 2025-2030

Chart on Brazil - Market size and forecast 2025-2030 ($ million)
Data Table on Brazil - Market size and forecast 2025-2030 ($ million)
Chart on Brazil - Year-over-year growth 2025-2030 (%)
Data Table on Brazil - Year-over-year growth 2025-2030 (%)

13.6.2 Argentina - Market size and forecast 2025-2030

Chart on Argentina - Market size and forecast 2025-2030 ($ million)
Data Table on Argentina - Market size and forecast 2025-2030 ($ million)
Chart on Argentina - Year-over-year growth 2025-2030 (%)
Data Table on Argentina - Year-over-year growth 2025-2030 (%)

13.6.3 Colombia - Market size and forecast 2025-2030

Chart on Colombia - Market size and forecast 2025-2030 ($ million)
Data Table on Colombia - Market size and forecast 2025-2030 ($ million)
Chart on Colombia - Year-over-year growth 2025-2030 (%)
Data Table on Colombia - Year-over-year growth 2025-2030 (%)

13.7 Middle East and Africa - Market size and forecast 2025-2030

Chart on Middle East and Africa - Market size and forecast 2025-2030 ($ million)
Data Table on Middle East and Africa - Market size and forecast 2025-2030 ($ million)
Chart on Middle East and Africa - Year-over-year growth 2025-2030 (%)
Data Table on Middle East and Africa - Year-over-year growth 2025-2030 (%)
Chart on Regional Comparison - Middle East and Africa
Data Table on Regional Comparison - Middle East and Africa

13.7.1 UAE - Market size and forecast 2025-2030

Chart on UAE - Market size and forecast 2025-2030 ($ million)
Data Table on UAE - Market size and forecast 2025-2030 ($ million)
Chart on UAE - Year-over-year growth 2025-2030 (%)
Data Table on UAE - Year-over-year growth 2025-2030 (%)

13.7.2 Saudi Arabia - Market size and forecast 2025-2030

Chart on Saudi Arabia - Market size and forecast 2025-2030 ($ million)
Data Table on Saudi Arabia - Market size and forecast 2025-2030 ($ million)
Chart on Saudi Arabia - Year-over-year growth 2025-2030 (%)
Data Table on Saudi Arabia - Year-over-year growth 2025-2030 (%)

13.7.3 Israel - Market size and forecast 2025-2030

Chart on Israel - Market size and forecast 2025-2030 ($ million)
Data Table on Israel - Market size and forecast 2025-2030 ($ million)
Chart on Israel - Year-over-year growth 2025-2030 (%)
Data Table on Israel - Year-over-year growth 2025-2030 (%)

13.7.4 South Africa - Market size and forecast 2025-2030

Chart on South Africa - Market size and forecast 2025-2030 ($ million)
Data Table on South Africa - Market size and forecast 2025-2030 ($ million)
Chart on South Africa - Year-over-year growth 2025-2030 (%)
Data Table on South Africa - Year-over-year growth 2025-2030 (%)

13.7.5 Nigeria - Market size and forecast 2025-2030

Chart on Nigeria - Market size and forecast 2025-2030 ($ million)
Data Table on Nigeria - Market size and forecast 2025-2030 ($ million)
Chart on Nigeria - Year-over-year growth 2025-2030 (%)
Data Table on Nigeria - Year-over-year growth 2025-2030 (%)

13.8 Market opportunity by geography

Market opportunity by geography ($ million)
Data Tables on Market opportunity by geography ($ million)

14. Drivers, Challenges, and Opportunity

14.1 Market drivers

Shift toward agentic AI and autonomous workflows
Integration into native legal productivity ecosystems
Escalating demand for cost efficiency and alternative fee arrangements

14.2 Market challenges

Regulatory fragmentation and compliance complexity
Data privacy, sovereignty, and privilege risks
Technical trust and hallucination dilemma

14.3 Impact of drivers and challenges

Impact of drivers and challenges in 2025 and 2030

14.4 Market opportunities

Transition from reactive assistants to proactive agentic AI
Maturation of workflow native and integrated intelligence
Emphasis on traceability and reality check of AI governance

15. Competitive Landscape

15.1 Overview

15.2

Overview on criticality of inputs and factors of differentiation

15.3 Landscape disruption

Overview on factors of disruption

15.4 Industry risks

Impact of key risks on business

16. Competitive Analysis

16.1 Companies profiled

Companies covered

16.2 Company ranking index

16.3 Market positioning of companies

Matrix on companies position and classification

16.4 Advanced Micro Devices Inc.

Advanced Micro Devices Inc. - Overview
Advanced Micro Devices Inc. - Business segments
Advanced Micro Devices Inc. - Key news
Advanced Micro Devices Inc. - Key offerings
Advanced Micro Devices Inc. - Segment focus
SWOT

16.5 Alibaba Group Holding Ltd.

Alibaba Group Holding Ltd. - Overview
Alibaba Group Holding Ltd. - Business segments
Alibaba Group Holding Ltd. - Key offerings
Alibaba Group Holding Ltd. - Segment focus
SWOT

16.6 Amazon Web Services Inc.

Amazon Web Services Inc. - Overview
Amazon Web Services Inc. - Product / Service
Amazon Web Services Inc. - Key offerings
SWOT

16.7 Cerebras Systems Inc.

Cerebras Systems Inc. - Overview
Cerebras Systems Inc. - Product / Service
Cerebras Systems Inc. - Key offerings
SWOT

16.8 Gcore

Gcore - Overview
Gcore - Product / Service
Gcore - Key offerings
SWOT

16.9 Google LLC

Google LLC - Overview
Google LLC - Product / Service
Google LLC - Key offerings
SWOT

16.10 Groq Inc.

Groq Inc. - Overview
Groq Inc. - Product / Service
Groq Inc. - Key offerings
SWOT

16.11 Hugging Face Inc.

Hugging Face Inc. - Overview
Hugging Face Inc. - Product / Service
Hugging Face Inc. - Key offerings
SWOT

16.12 IBM Corp.

IBM Corp. - Overview
IBM Corp. - Business segments
IBM Corp. - Key news
IBM Corp. - Key offerings
IBM Corp. - Segment focus
SWOT

16.13 Intel Corp.

Intel Corp. - Overview
Intel Corp. - Business segments
Intel Corp. - Key news
Intel Corp. - Key offerings
Intel Corp. - Segment focus
SWOT

16.14 Microsoft Corp.

Microsoft Corp. - Overview
Microsoft Corp. - Business segments
Microsoft Corp. - Key news
Microsoft Corp. - Key offerings
Microsoft Corp. - Segment focus
SWOT

16.15 NVIDIA Corp.

NVIDIA Corp. - Overview
NVIDIA Corp. - Business segments
NVIDIA Corp. - Key news
NVIDIA Corp. - Key offerings
NVIDIA Corp. - Segment focus
SWOT

16.16 Qualcomm Inc.

Qualcomm Inc. - Overview
Qualcomm Inc. - Business segments
Qualcomm Inc. - Key news
Qualcomm Inc. - Key offerings
Qualcomm Inc. - Segment focus
SWOT

16.17 Scaleway SAS

Scaleway SAS - Overview
Scaleway SAS - Product / Service
Scaleway SAS - Key offerings
SWOT

16.18 Tenstorrent Inc.

Tenstorrent Inc. - Overview
Tenstorrent Inc. - Product / Service
Tenstorrent Inc. - Key offerings
SWOT

17. Appendix

17.1 Scope of the report

Market definition
Objectives
Notes and caveats

17.2 Inclusions and exclusions checklist

Inclusions checklist
Exclusions checklist

17.3 Currency conversion rates for US$

17.4 Research methodology

17.5 Data procurement

Information sources

17.6 Data validation

17.7 Validation techniques employed for market sizing

17.8 Data synthesis

17.9 360 degree market analysis

17.10 List of abbreviations

Research Methodology

Technavio presents a detailed picture of the market by way of study, synthesis, and summation of data from multiple sources. The analysts have presented the various facets of the market with a particular focus on identifying the key industry influencers. The data thus presented is comprehensive, reliable, and the result of extensive research, both primary and secondary.

INFORMATION SOURCES

Primary sources

  • Manufacturers and suppliers
  • Channel partners
  • Industry experts
  • Strategic decision makers

Secondary sources

  • Industry journals and periodicals
  • Government data
  • Financial reports of key industry players
  • Historical data
  • Press releases

DATA ANALYSIS

Data Synthesis

  • Collation of data
  • Estimation of key figures
  • Analysis of derived insights

Data Validation

  • Triangulation with data models
  • Reference against proprietary databases
  • Corroboration with industry experts

REPORT WRITING

Qualitative

  • Market drivers
  • Market challenges
  • Market trends
  • Five forces analysis

Quantitative

  • Market size and forecast
  • Market segmentation
  • Geographical insights
  • Competitive landscape

Interested in this report?

Get your sample now to see our research methodology and insights!

Download Now

Frequently Asked Questions

AI Legal Tech market growth will increase by USD 5530.5 million during 2026-2030.

The AI Legal Tech market is expected to grow at a CAGR of 32.1% during 2026-2030.

AI Legal Tech market is segmented by Component (Solution, Services) Deployment (On-premises, Cloud-based) Technology (Machine learning, Deep learning, Natural language processing) End-user (Law firms, Corporate departments, Government bodies, Others)

Advanced Micro Devices Inc., Alibaba Group Holding Ltd., Amazon Web Services Inc., Axelera AI, Cerebras Systems Inc., Gcore, Google LLC, Graphcore Ltd., Groq Inc., Hugging Face Inc., IBM Corp., Intel Corp., Microsoft Corp., Modular Inc., NVIDIA Corp., Qualcomm Inc., Recogni, Scaleway SAS, Tenstorrent Inc. are a few of the key vendors in the AI Legal Tech market.

North America will register the highest growth rate of 35.5% among the other regions. Therefore, the AI Legal Tech market in North America is expected to garner significant business opportunities for the vendors during the forecast period.

US, Canada, Mexico, UK, Germany, France, The Netherlands, Sweden, Italy, China, Japan, Australia, India, Singapore, Indonesia, Brazil, Argentina, Colombia, UAE, Saudi Arabia, Israel, South Africa, Nigeria

  • Shift toward agentic AI and autonomous workflows is the driving factor this market.

The AI Legal Tech market vendors should focus on grabbing business opportunities from the Component segment as it accounted for the largest market share in the base year.
RIA - Research AI Assistant
Ask RIA