
AI Operations (aiops) Market Size 2025-2029
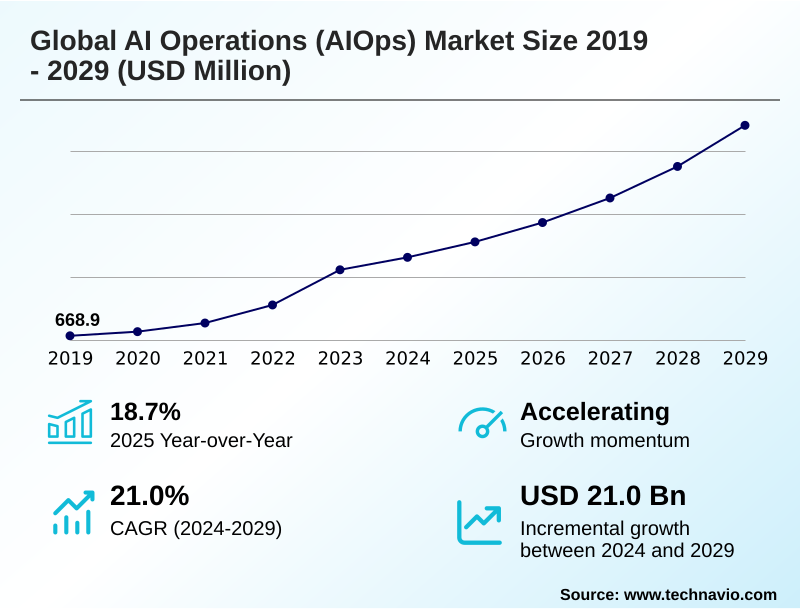
The ai operations (aiops) market size is valued to increase by USD 21.00 billion, at a CAGR of 21% from 2024 to 2029. Increasing complexity of IT environments will drive the ai operations (aiops) market.
Major Market Trends & Insights
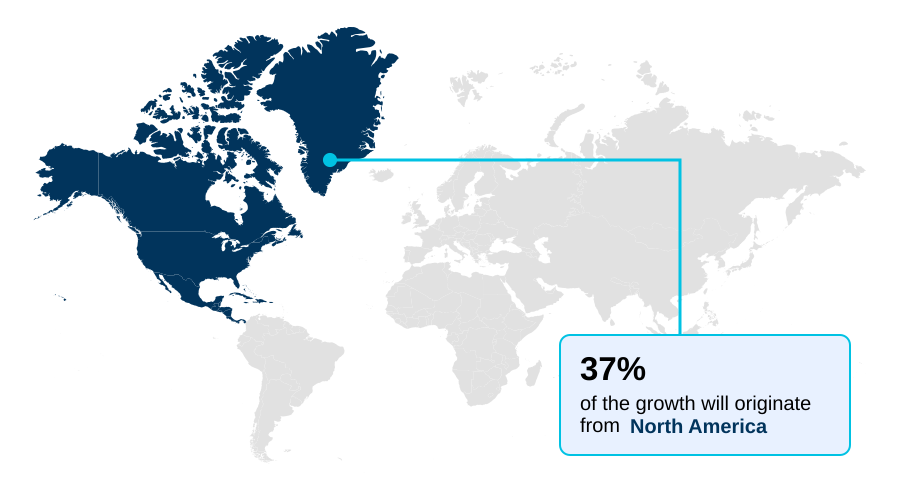
- North America dominated the market and accounted for a 36.8% growth during the forecast period.
- By Component - Platform segment was valued at USD 9.20 billion in 2023
- By Deployment - On premises segment accounted for the largest market revenue share in 2023
Market Size & Forecast
- Market Opportunities: USD 33.48 billion
- Market Future Opportunities: USD 21.00 billion
- CAGR from 2024 to 2029 : 21%
Market Summary
- The AI operations (AIOps) market is defined by the integration of artificial intelligence into IT operations to manage increasingly complex digital ecosystems. Key market drivers include the proliferation of microservices architectures and the critical need for greater operational efficiency.
- Organizations are adopting AIOps to transition from reactive troubleshooting to proactive problem resolution, leveraging machine learning algorithms for predictive analytics and automated root cause analysis. A significant trend is the convergence of AIOps with DevOps and SRE practices to accelerate continuous delivery while maintaining system reliability.
- For instance, a global logistics firm can use an AIOps platform to predict potential IT infrastructure failures that could disrupt its physical supply chain, allowing for preventative maintenance and resource optimization.
- However, the market faces challenges such as a persistent skill gap and the difficulty of breaking down data silos, which can impede the consolidation of data required for effective AI model training. The effective implementation of data governance and a focus on unified visibility are crucial for overcoming these hurdles and unlocking the full potential of autonomous IT management.
What will be the Size of the AI Operations (aiops) Market during the forecast period?
Get Key Insights on Market Forecast (PDF) Get Free Sample
How is the AI Operations (aiops) Market Segmented?
The ai operations (aiops) industry research report provides comprehensive data (region-wise segment analysis), with forecasts and estimates in "USD million" for the period 2025-2029, as well as historical data from 2019-2023 for the following segments.
- Component
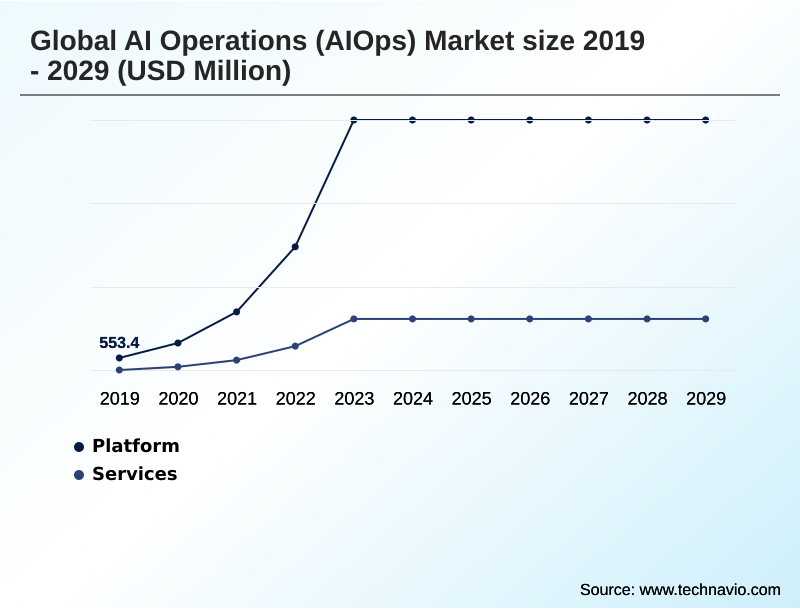
- Platform
- Services
- Deployment
- On premises
- Cloud
- Organization size
- Large enterprises
- SMEs
- Sector
- BFSI
- IT and telecom
- Healthcare
- Retail
- Others
- Geography
- North America
- US
- Canada
- APAC
- China
- India
- Japan
- Europe
- Germany
- UK
- France
- Middle East and Africa
- South Africa
- UAE
- South America
- Brazil
- Argentina
- Rest of World (ROW)
- North America
By Component Insights
The platform segment is estimated to witness significant growth during the forecast period.
The AIOps platform segment is central to modern IT strategy, offering core software solutions for automating and enhancing operations. Enterprises are adopting these platforms to manage complex hybrid cloud infrastructure, demanding robust analytical capabilities and seamless AIOps platform integration.
A key part of the AIOps business case is moving beyond reactive fixes to proactive incident management through advanced anomaly detection and predictive analytics. This shift enables some organizations to achieve up to a 30% improvement in incident resolution speed.
As such, solutions that provide comprehensive observability and real-time monitoring are critical for maintaining system health.
The demand for sophisticated IT service management tools that unify data and provide actionable insights through cloud observability strategies continues to define the segment's trajectory, facilitating automated incident response and predictive IT analytics for hybrid cloud environments.
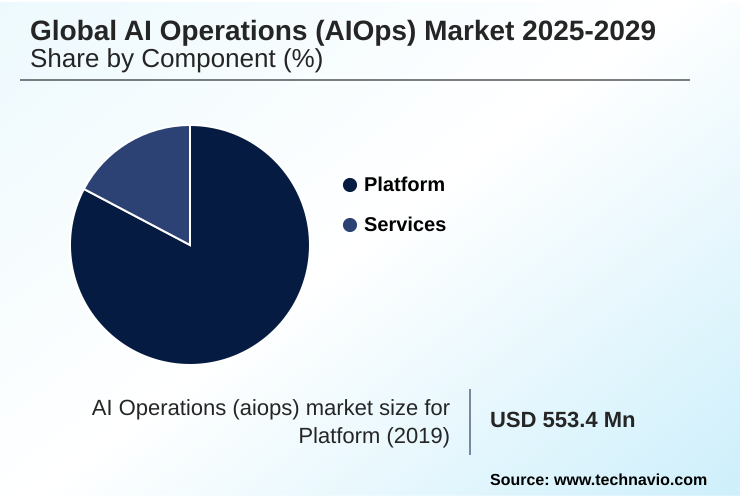
The Platform segment was valued at USD 9.20 billion in 2023 and showed a gradual increase during the forecast period.
Regional Analysis
North America is estimated to contribute 36.8% to the growth of the global market during the forecast period.Technavio’s analysts have elaborately explained the regional trends and drivers that shape the market during the forecast period.
See How AI Operations (aiops) Market Demand is Rising in North America Get Free Sample
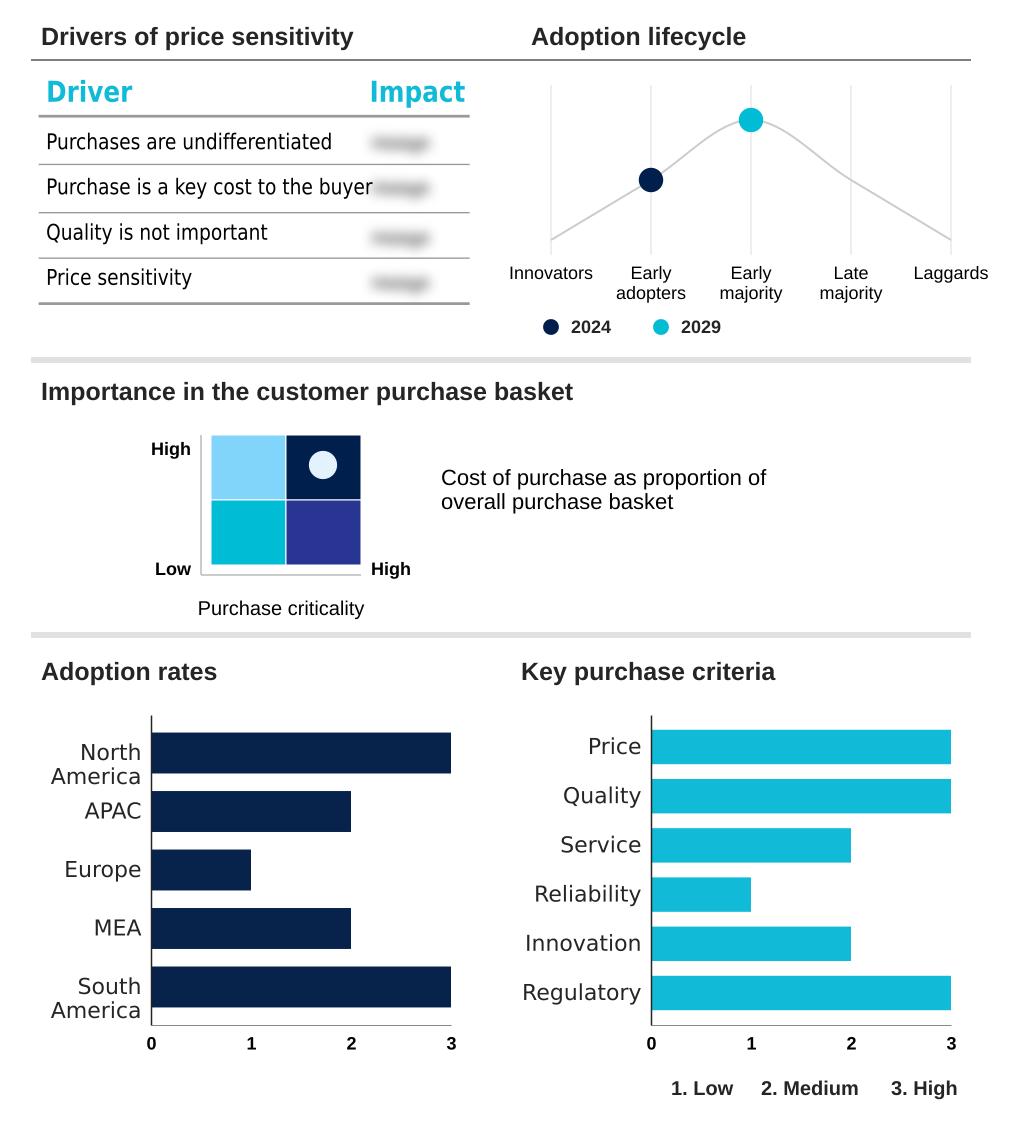
The geographic landscape of the AI operations (AIOps) market is led by North America, which is poised to contribute 36.8% of the market's incremental growth, driven by early adoption and a mature tech ecosystem.
The region's focus on operational efficiency and cybersecurity resilience propels demand for solutions enabling intelligent alerting and workflow orchestration. Meanwhile, APAC is the fastest-growing region, with an expected growth rate of 20.7%, fueled by widespread digital transformation.
Enterprises in this region are increasingly deploying agentic AI platforms to scale operations. The adoption of autonomous agents and hypermodal AI is becoming crucial for managing complex infrastructures.
Key applications involve leveraging causal AI for deep insights and unified visibility, enhancing the ability to perform real-time anomaly detection and scaling IT operations with AI for an improved digital experience.
Market Dynamics
Our researchers analyzed the data with 2024 as the base year, along with the key drivers, trends, and challenges. A holistic analysis of drivers will help companies refine their marketing strategies to gain a competitive advantage.
- Enterprises are increasingly evaluating the aiops benefits for large enterprises, focusing on how aiops improves it efficiency through intelligent automation. A common analysis involves comparing aiops vs traditional itom tools, where AIOps platforms demonstrate superior capabilities in handling modern complexities. The top aiops use cases in bfsi, for example, highlight the necessity for securing it infrastructure with aiops.
- Central to this is aiops for hybrid cloud management, which addresses the challenges of implementing aiops solutions across diverse environments. Successful aiops integration with devops pipelines is critical for agile development, relying on predictive analytics in it operations and automated root cause analysis tools to maintain stability.
- For service providers, aiops for network performance monitoring is key to reducing alert fatigue with aiops. The aiops role in site reliability engineering is expanding, especially with the generative ai impact on aiops. Organizations are focused on measuring roi of aiops adoption, using aiops platforms for multi-cloud visibility to justify investments.
- A primary goal is aiops for proactive incident management, which involves overcoming data silos in aiops. This strategic direction points toward the future of autonomous it operations, with a strong emphasis on aiops for enhancing customer experience. Firms leveraging these capabilities report up to a 25% reduction in critical outages compared to those using older methods.
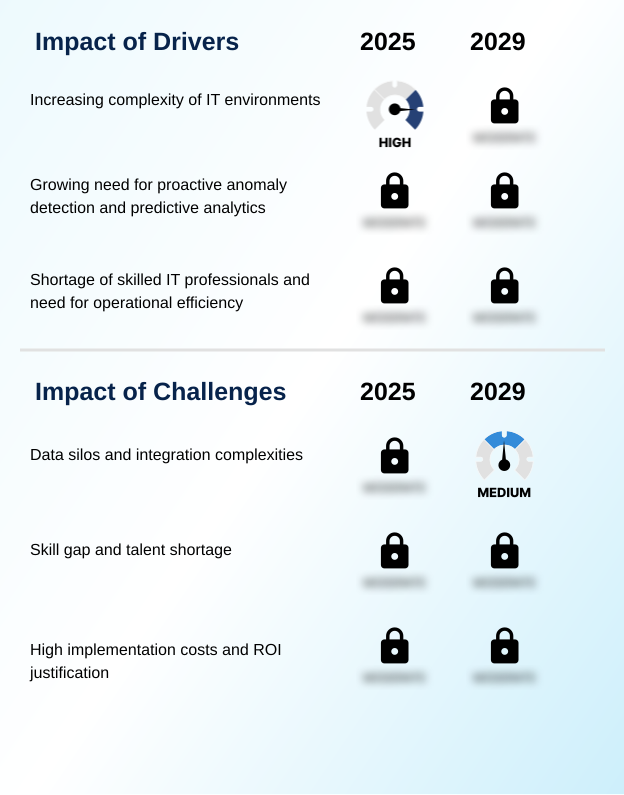
What are the key market drivers leading to the rise in the adoption of AI Operations (aiops) Industry?
- The increasing complexity of modern IT environments serves as a primary driver for the adoption of intelligent automation solutions.
- The primary driver for AIOps adoption is the urgent need to manage IT environments of escalating complexity. The proliferation of cloud-native services and distributed systems generates immense volumes of data, rendering manual oversight ineffective and creating persistent data silos.
- AIOps platforms provide a solution by automating log management and performance metrics analysis through a cohesive CI/CD pipeline.
- This automation is crucial for realizing a positive ROI on AIOps solutions, as it directly addresses the AIOps skill gap by empowering smaller teams.
- The rise of generative AI in operations further accelerates this trend, offering more intuitive interfaces and powerful analytical capabilities.
- By providing a clear path for data integration for AIOps, these platforms help overcome AIOps implementation challenges, enabling organizations to leverage AI for IT infrastructure optimization. Enterprises report significant efficiency gains, including a 30% improvement in incident resolution speed.
What are the market trends shaping the AI Operations (aiops) Industry?
- The proliferation of hybrid and multi-cloud environments represents a defining market trend. This shift drives demand for advanced operational management solutions to ensure consistent performance and visibility.
- Key trends in the AIOps market are centered on achieving proactive operational control in increasingly complex IT environments. The integration with site reliability engineering and continuous delivery methodologies is becoming standard, fostering a culture of resilience and agility.
- This synergy is critical for managing intricate microservices architectures, where automated root cause analysis can reduce mean time to resolution (MTTR) by over 30%. Another significant trend is the application of advanced machine learning algorithms for predictive analytics, enabling some telecommunication firms to cut customer-impacting outages by 25%.
- This move towards proactive outage prevention is a direct response to the operational challenges posed by managing multi-cloud complexity.
- The convergence of DevOps and AIOps synergy is not just a technical enhancement but a strategic imperative for organizations aiming to accelerate their DevOps pipeline without compromising stability through effective machine learning in network monitoring and the use of SRE automation tools.
What challenges does the AI Operations (aiops) Industry face during its growth?
- The persistence of data silos and the complexities of system integration represent a key challenge affecting widespread industry adoption.
- A primary challenge hindering AIOps market growth is the complexity of integrating disparate systems and overcoming entrenched data silos, with some financial institutions reporting integration timelines of up to eighteen months. The demand for unified visibility is often at odds with the reality of fragmented IT infrastructure management.
- As organizations undergo digital transformation, achieving proactive problem resolution requires seamless event correlation and automated alerting, which are difficult to implement without standardized data. Furthermore, the push for agentic IT operations and autonomous IT management introduces new hurdles related to governance and trust.
- The successful application of AIOps for financial services, healthcare IT automation, and retail e-commerce reliability depends on robust network performance monitoring and the ability to provide consistent operational efficiency, which remains a significant challenge for many.
Exclusive Technavio Analysis on Customer Landscape
The ai operations (aiops) market forecasting report includes the adoption lifecycle of the market, covering from the innovator’s stage to the laggard’s stage. It focuses on adoption rates in different regions based on penetration. Furthermore, the ai operations (aiops) market report also includes key purchase criteria and drivers of price sensitivity to help companies evaluate and develop their market growth analysis strategies.
Customer Landscape of AI Operations (aiops) Industry
Competitive Landscape
Companies are implementing various strategies, such as strategic alliances, ai operations (aiops) market forecast, partnerships, mergers and acquisitions, geographical expansion, and product/service launches, to enhance their presence in the industry.
Aisera Inc. - An agentic AI platform provides autonomous execution capabilities for workflows across multiple enterprise domains, including IT operations and customer service.
The industry research and growth report includes detailed analyses of the competitive landscape of the market and information about key companies, including:
- Aisera Inc.
- BigPanda Inc.
- BMC Software Inc.
- Broadcom Inc.
- Cisco Systems Inc.
- Datadog Inc.
- Dell Technologies Inc.
- Dynatrace Inc.
- Google LLC
- IBM Corp.
- LogicMonitor Inc.
- Microsoft Corp.
- Netreo Inc.
- New Relic Inc.
- PagerDuty Inc.
- SolarWinds Corp.
- Zoho Corp. Pvt. Ltd.
Qualitative and quantitative analysis of companies has been conducted to help clients understand the wider business environment as well as the strengths and weaknesses of key industry players. Data is qualitatively analyzed to categorize companies as pure play, category-focused, industry-focused, and diversified; it is quantitatively analyzed to categorize companies as dominant, leading, strong, tentative, and weak.
Recent Development and News in Ai operations (aiops) market
- In August 2024, Hewlett Packard Enterprise introduced the next generation of its networking central platform, integrating AIOps capabilities to streamline factory operations and enhance retail experiences.
- In November 2024, Siemens announced plans to acquire an industrial drive technology division, signaling a strategic move to integrate advanced automation and AI into industrial operational technology.
- In January 2025, the World Economic Forum highlighted Brazil's potential to set global standards in AI governance, citing its renewable energy resources as strategic assets for sustainable data center operations.
- In April 2025, JPMorgan Chase announced the deployment of proprietary AI-driven monitoring tools to enhance operational resilience and detect financial transaction anomalies in real time.
Dive into Technavio’s robust research methodology, blending expert interviews, extensive data synthesis, and validated models for unparalleled AI Operations (aiops) Market insights. See full methodology.
| Market Scope | |
|---|---|
| Page number | 279 |
| Base year | 2024 |
| Historic period | 2019-2023 |
| Forecast period | 2025-2029 |
| Growth momentum & CAGR | Accelerate at a CAGR of 21% |
| Market growth 2025-2029 | USD 21001.3 million |
| Market structure | Fragmented |
| YoY growth 2024-2025(%) | 18.7% |
| Key countries | US, Canada, China, India, Japan, South Korea, Australia, Germany, UK, France, South Africa, UAE, Brazil and Argentina |
| Competitive landscape | Leading Companies, Market Positioning of Companies, Competitive Strategies, and Industry Risks |
Research Analyst Overview
- The AI operations (AIOps) market is advancing beyond conventional IT infrastructure management, driven by a convergence of technologies aimed at achieving superior operational efficiency. At its core, the market leverages machine learning algorithms for predictive analytics, enabling proactive problem resolution and automated remediation. The integration into a CI/CD pipeline and a broader DevOps pipeline facilitates continuous delivery.
- This is crucial for managing modern hybrid cloud infrastructure and complex microservices architectures. AIOps provides unified visibility and robust observability, which are essential for effective incident management and site reliability engineering. Key functionalities like anomaly detection, root cause analysis, and event correlation are powered by log management and performance metrics analysis.
- The shift toward generative AI and hypermodal AI is enabling more sophisticated causal AI, intelligent alerting, and automated alerting. This digital transformation is supported by agentic AI platforms with autonomous agents performing workflow orchestration. Adherence to data governance is critical, especially when breaking down data silos across cloud-native services.
- With a focus on cybersecurity resilience, firms using these platforms report a 30% improvement in incident resolution speed, reshaping IT service management.
What are the Key Data Covered in this AI Operations (aiops) Market Research and Growth Report?
-
What is the expected growth of the AI Operations (aiops) Market between 2025 and 2029?
-
USD 21.00 billion, at a CAGR of 21%
-
-
What segmentation does the market report cover?
-
The report is segmented by Component (Platform, and Services), Deployment (On premises, and Cloud), Organization Size (Large enterprises, and SMEs), Sector (BFSI, IT and telecom, Healthcare, Retail, and Others) and Geography (North America, APAC, Europe, Middle East and Africa, South America)
-
-
Which regions are analyzed in the report?
-
North America, APAC, Europe, Middle East and Africa and South America
-
-
What are the key growth drivers and market challenges?
-
Increasing complexity of IT environments, Data silos and integration complexities
-
-
Who are the major players in the AI Operations (aiops) Market?
-
Aisera Inc., BigPanda Inc., BMC Software Inc., Broadcom Inc., Cisco Systems Inc., Datadog Inc., Dell Technologies Inc., Dynatrace Inc., Google LLC, IBM Corp., LogicMonitor Inc., Microsoft Corp., Netreo Inc., New Relic Inc., PagerDuty Inc., SolarWinds Corp. and Zoho Corp. Pvt. Ltd.
-
Market Research Insights
- The dynamics of the AIOps market are shaped by the strategic push for autonomous IT management and enhanced digital experience. Enterprises are scaling IT operations with AI, leading to measurable outcomes such as a 25% reduction in customer-impacting outages through proactive outage prevention.
- The AIOps business case is further strengthened by a reported 30% improvement in mean time to resolution (MTTR) after implementing automated incident response. As organizations navigate the complexities of managing multi-cloud complexity, AIOps platform integration becomes critical for achieving cloud observability strategies.
- Addressing the AIOps implementation challenges and the existing AIOps skill gap is essential for realizing the full ROI of AIOps solutions. The synergy between DevOps and AIOps is pivotal for modern, agile operations.
We can help! Our analysts can customize this ai operations (aiops) market research report to meet your requirements.
 RIA -
RIA - 
