AI Integration Platforms Market Analysis, Size, and Forecast 2026-2030: North America (US, Canada, and Mexico), Europe (Germany, UK, and France), APAC (China, Japan, and India), South America (Brazil and Argentina), Middle East and Africa (Saudi Arabia, UAE, and South Africa), and Rest of World (ROW)

AI Integration Platforms Market Analysis, Size, and Forecast 2026-2030:
North America (US, Canada, and Mexico), Europe (Germany, UK, and France), APAC (China, Japan, and India), South America (Brazil and Argentina), Middle East and Africa (Saudi Arabia, UAE, and South Africa), and Rest of World (ROW)

Published: Apr 2026 304 Pages SKU: IRTNTR80667

Market Overview at a Glance

$60.90 B
Market Opportunity
35.9%
CAGR 2025 - 2030
35.4%
North America Growth
$9.21 B
Cloud platform segment 2024

AI Integration Platforms Market Size 2026-2030

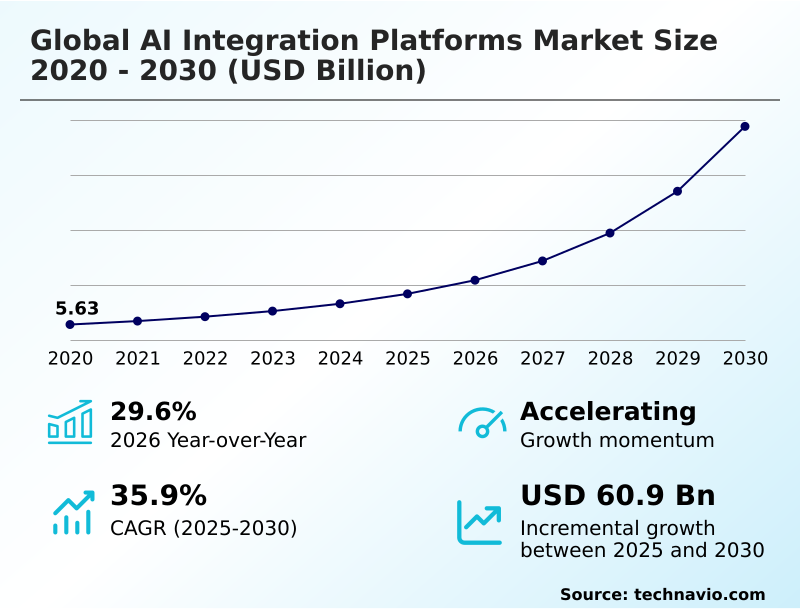
The ai integration platforms market size is valued to increase by USD 60.90 billion, at a CAGR of 35.9% from 2025 to 2030. Overarching imperative for business process automation and enhanced operational efficiency will drive the ai integration platforms market.

Major Market Trends & Insights

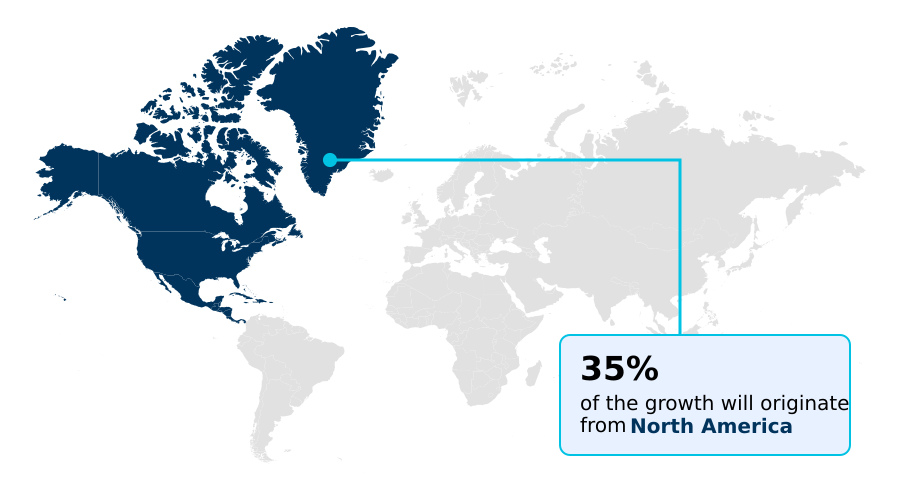
  • North America dominated the market and accounted for a 35.4% growth during the forecast period.
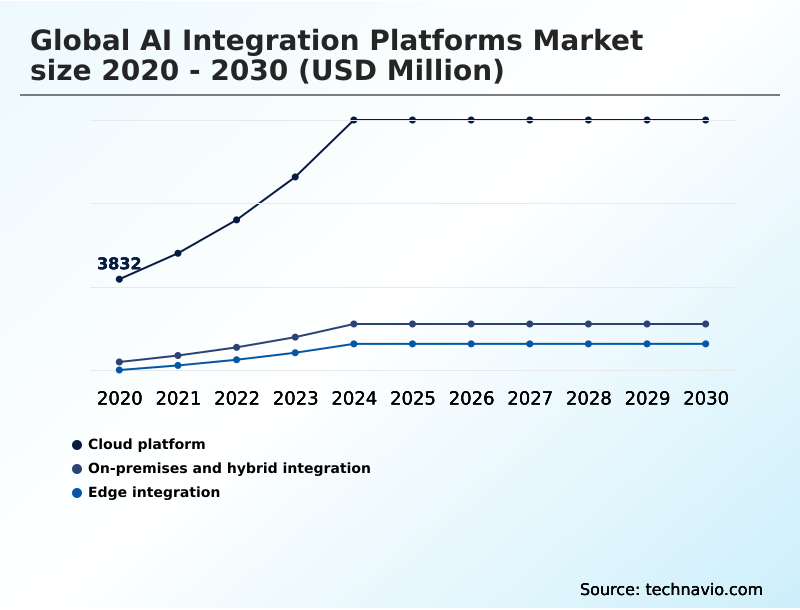
  • By Product - Cloud platform segment was valued at USD 9.21 billion in 2024
  • By Type - Application-to-application integration segment accounted for the largest market revenue share in 2024

Market Size & Forecast

  • Market Opportunities: USD 72.05 billion
  • Market Future Opportunities: USD 60.90 billion
  • CAGR from 2025 to 2030 : 35.9%

Market Summary

  • The AI integration platforms market is undergoing a profound transformation as organizations shift from isolated AI tools to deeply embedded, interconnected systems. This evolution is driven by the relentless pursuit of operational efficiency, the need for data-driven decision-making, and the strategic advantage gained from leveraging AI capabilities across all business functions.
  • The proliferation of generative AI has acted as a catalyst, compelling businesses to adopt robust platforms that manage the entire model lifecycle, from development and deployment to monitoring and governance. A key trend is the convergence of low-code environments with advanced AI, empowering non-technical users to build sophisticated automations.
  • For instance, a retail company can use such a platform to unify data from sales, inventory, and customer feedback systems to power a predictive analytics model for demand forecasting, thereby optimizing stock levels and reducing waste. However, challenges such as integrating with legacy infrastructure, ensuring data privacy across jurisdictions, and a scarcity of specialized talent temper the pace of adoption.
  • The market is characterized by intense innovation as providers focus on simplifying complexity and creating a cohesive ecosystem where AI is a core component of business infrastructure.

What will be the Size of the AI Integration Platforms Market during the forecast period?

Get Key Insights on Market Forecast (PDF) Get Free Sample

How is the AI Integration Platforms Market Segmented?

The ai integration platforms industry research report provides comprehensive data (region-wise segment analysis), with forecasts and estimates in "USD million" for the period 2026-2030, as well as historical data from 2020-2024 for the following segments.

  • Product
    • Cloud platform
    • On-premises and hybrid integration
    • Edge integration
  • Type
    • Application-to-application integration
    • Data-to-data integration
    • API management
  • End-user
    • Enterprise IT and software
    • BFSI
    • Healthcare
    • Retail and e commerce
    • Others
  • Geography
    • North America
      • US
      • Canada
      • Mexico
    • Europe
      • Germany
      • UK
      • France
    • APAC
      • China
      • Japan
      • India
    • South America
      • Brazil
      • Argentina
    • Middle East and Africa
      • Saudi Arabia
      • UAE
      • South Africa
    • Rest of World (ROW)

By Product Insights

The cloud platform segment is estimated to witness significant growth during the forecast period.

The cloud platform segment is foundational to the market, delivered as a fully managed service that abstracts infrastructural complexity. This model enables organizations to focus on deploying applications rather than managing hardware, fostering digital transformation initiatives through intelligent automation.

Scalability is a core characteristic, allowing businesses to optimize resource use and enhance operational efficiency. These platforms are central to the data-to-insight lifecycle, enabling data-driven decision-making and supporting low-code development environments.

By deeply integrating with enterprise IT ecosystems and facilitating robust MLOps practices through event-driven architecture, organizations achieve a more agile and innovative posture.

This approach significantly lowers the barrier to entry for leveraging advanced AI, with some achieving a 30% reduction in model deployment times.

Get Free Sample

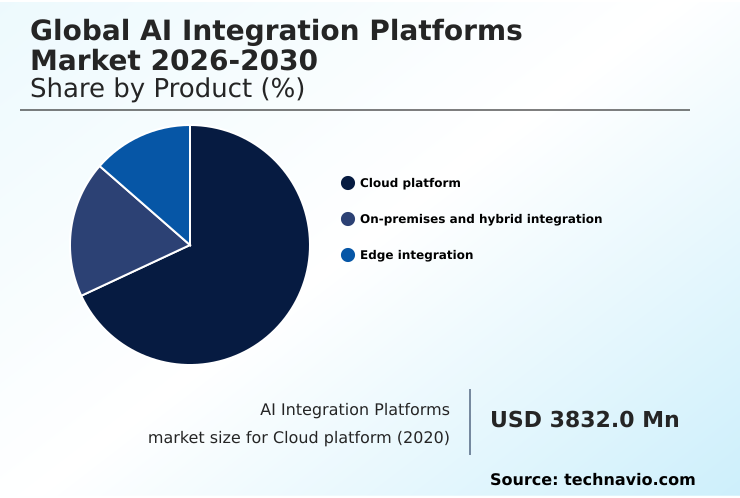
The Cloud platform segment was valued at USD 9.21 billion in 2024 and showed a gradual increase during the forecast period.

Get Free Sample

Regional Analysis

North America is estimated to contribute 35.4% to the growth of the global market during the forecast period.Technavio’s analysts have elaborately explained the regional trends and drivers that shape the market during the forecast period.

See How AI Integration Platforms Market Demand is Rising in North America Get Free Sample

The geographic landscape is led by North America, which accounts for over 35% of the incremental growth, driven by mature enterprise adoption and a high concentration of technology providers.

Europe follows, with a strong focus on data sovereignty and industrial applications, particularly in manufacturing. The APAC region is the fastest-growing market, propelled by widespread digital transformation and government-led AI initiatives in countries like China and India.

Deployments in APAC's manufacturing sector leveraging federated learning and data wrangling have reduced unplanned downtime by up to 20%. South America and the Middle East and Africa are emerging regions, with growth fueled by investments in cloud infrastructure.

Platforms offering robust hybrid cloud integration and strong model governance via features like an API gateway and support for explainable AI (XAI) are gaining traction globally.

Market Dynamics

Our researchers analyzed the data with 2025 as the base year, along with the key drivers, trends, and challenges. A holistic analysis of drivers will help companies refine their marketing strategies to gain a competitive advantage.

  • The global AI integration platforms market 2026-2030 is rapidly maturing as organizations seek to operationalize artificial intelligence beyond siloed projects. A critical focus is on AI integration for supply chain optimization, where connecting disparate data sources delivers unprecedented visibility. Enterprises are comparing RPA vs AI integration platform capabilities, recognizing that true hyperautomation requires the intelligent orchestration that advanced platforms provide.
  • The rise of the low-code AI platform for business users is democratizing development, allowing departments to create their own solutions. This is particularly evident in the use of generative AI for workflow automation, which significantly reduces manual coding.
  • Central to this evolution is the role of API management in AI integration, ensuring that machine learning models are exposed as secure and scalable services. The market is also seeing specialized applications, such as edge AI integration for manufacturing, which enables real-time decisions on the factory floor, and AI integration for fraud detection in the financial sector.
  • A successful hybrid cloud AI integration strategy is becoming essential for balancing security and scalability. MLOps features in AI integration platforms are now a key differentiator, enabling robust model lifecycle management. Businesses are also focused on using these platforms to deliver a personalized customer experience.
  • In retail, deploying AI integration platforms for retail analytics has proven to be twice as effective as traditional business intelligence tools in identifying emerging consumer trends.

What are the key market drivers leading to the rise in the adoption of AI Integration Platforms Industry?

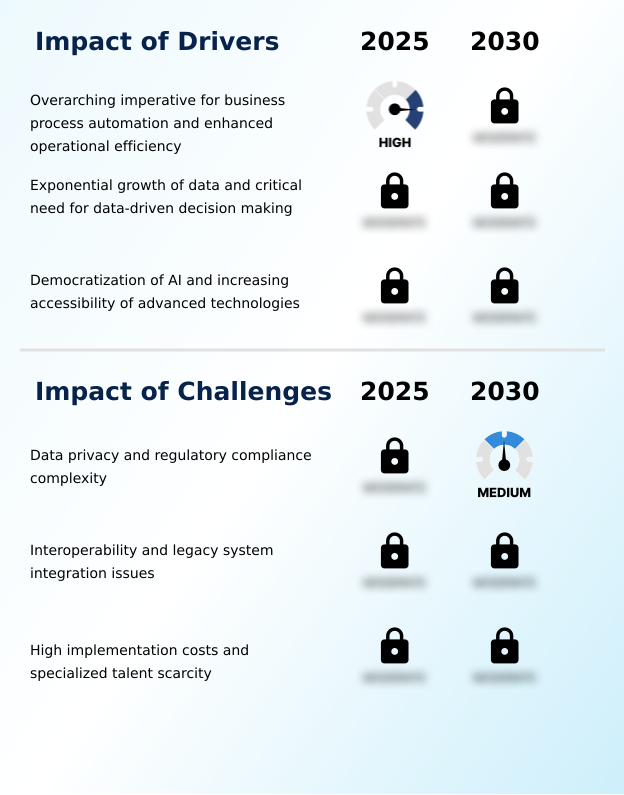
  • The overarching imperative for business process automation and enhanced operational efficiency serves as a key driver propelling market growth.

  • The overarching need for business process automation is a primary market driver, compelling organizations to adopt sophisticated workflow automation tools.
  • By leveraging machine learning models and natural language processing, companies are achieving new levels of operational efficiency, with some reducing manual process errors by over 95%.
  • The growth of AIOps reflects the need to manage complex IT environments, using AI to automate monitoring and remediation.
  • The democratization of AI, supported by platforms that enable citizen developers, is expanding the use of robotic process automation (RPA) and other intelligent tools.
  • This allows for the application of predictive and prescriptive analytics across the enterprise, from predictive maintenance in manufacturing, which has cut asset downtime by 30%, to data harmonization for financial reporting.

What are the market trends shaping the AI Integration Platforms Industry?

  • A key market trend involves the strategic convergence of low-code development platforms with generative artificial intelligence. This integration is democratizing access to sophisticated automation, enabling non-technical users to design and deploy complex workflows.

  • Key trends are reshaping the market, led by the push toward hyper-automation and the expansion of edge intelligence. This transition toward a decentralized architecture supports real-time data processing for mission-critical applications, with industrial deployments showing a 25% reduction in network latency.
  • The convergence of generative AI capabilities with integration platforms is fostering the development of self-healing workflows, which can autonomously detect and remediate errors, improving operational continuity by over 40%. This move toward autonomous orchestration enables a smart factory environment where a digital twin can model and optimize production processes.
  • As a result, sophisticated model lifecycle management is becoming essential for maintaining performance and governance across distributed edge and cloud assets.

What challenges does the AI Integration Platforms Industry face during its growth?

  • The complexity surrounding data privacy and navigating varied regulatory compliance frameworks presents a key challenge affecting industry growth.

  • Navigating complex data privacy frameworks and ensuring data sovereignty remain significant market challenges, particularly with tightening regulations. Integrating modern AI platforms with legacy system infrastructure also poses a substantial hurdle, as the technical debt associated with outdated systems of record can increase project costs by an average of 25%.
  • This challenge is amplified in multi-cloud strategies, where achieving seamless interoperability requires a sophisticated middleware layer and a rich library of prebuilt connectors. Furthermore, the persistent talent scarcity of specialized data scientists and integration architects constrains the ability of many organizations to fully leverage these platforms.
  • This skills gap can slow deployment and hinder the development of advanced applications requiring deep algorithmic transparency.

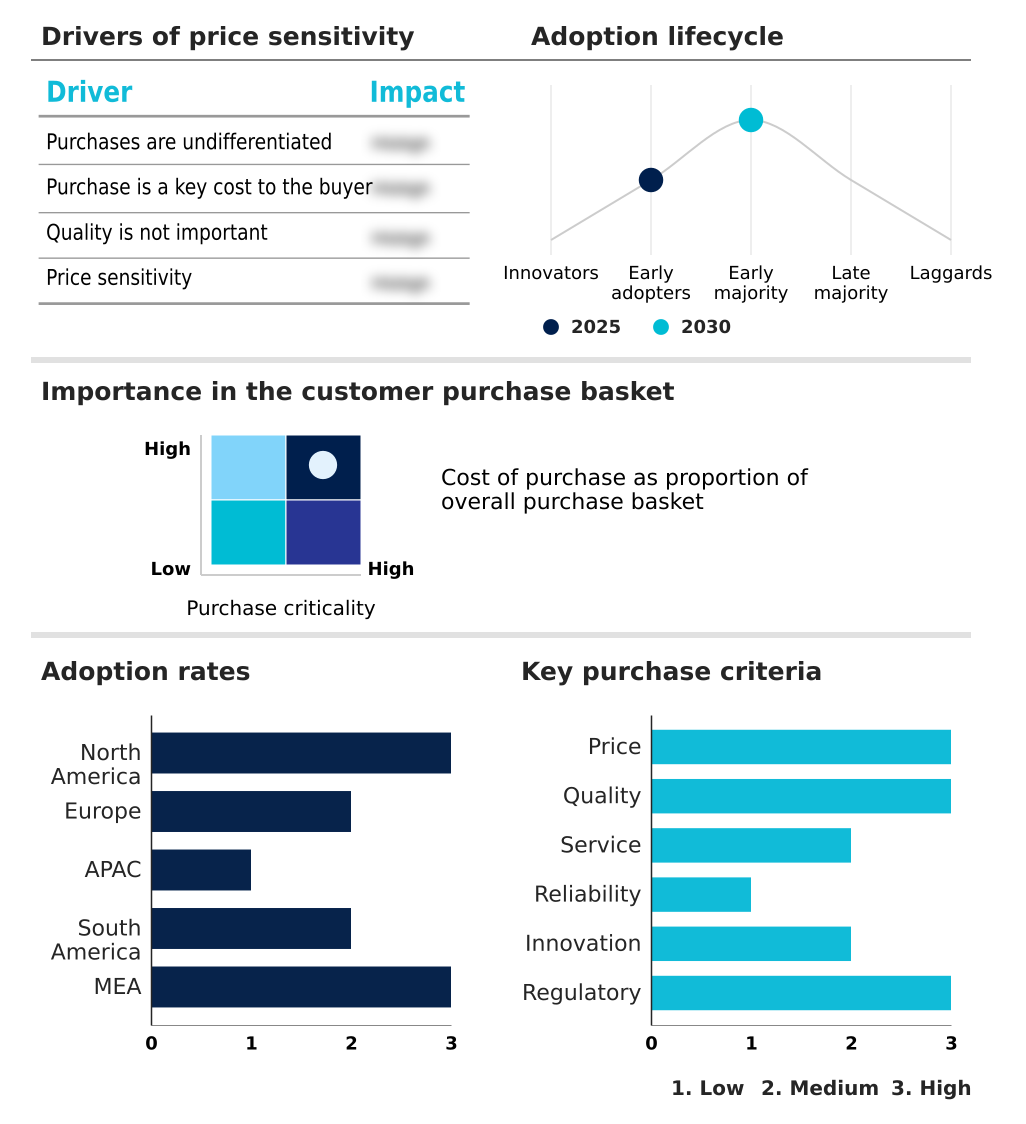
Exclusive Technavio Analysis on Customer Landscape

The ai integration platforms market forecasting report includes the adoption lifecycle of the market, covering from the innovator’s stage to the laggard’s stage. It focuses on adoption rates in different regions based on penetration. Furthermore, the ai integration platforms market report also includes key purchase criteria and drivers of price sensitivity to help companies evaluate and develop their market growth analysis strategies.

Customer Landscape of AI Integration Platforms Industry

Competitive Landscape

Companies are implementing various strategies, such as strategic alliances, ai integration platforms market forecast, partnerships, mergers and acquisitions, geographical expansion, and product/service launches, to enhance their presence in the industry.

Activepieces - Offerings provide specialized software solutions to streamline AI deployment within enterprise IT ecosystems, abstracting technical complexity to accelerate adoption and operationalize insights for strategic advantage.

The industry research and growth report includes detailed analyses of the competitive landscape of the market and information about key companies, including:

  • Activepieces
  • Celigo Inc.
  • Google LLC
  • IBM Corp.
  • Jitterbit Inc.
  • Make Inc.
  • Microsoft Corp.
  • MuleSoft LLC
  • n8n GmbH
  • Oracle Corp.
  • Pipedream Inc.
  • SAP SE
  • SnapLogic Inc.
  • Talend Inc.
  • TIBCO Software Inc.
  • Tray.ai Inc.
  • Workato Inc.
  • WSO2 Inc.
  • Zapier Inc.

Qualitative and quantitative analysis of companies has been conducted to help clients understand the wider business environment as well as the strengths and weaknesses of key industry players. Data is qualitatively analyzed to categorize companies as pure play, category-focused, industry-focused, and diversified; it is quantitatively analyzed to categorize companies as dominant, leading, strong, tentative, and weak.

Recent Development and News in Ai integration platforms market

  • In February, 2025, NVIDIA announced a USD 2 billion strategic investment from SoftBank Vision Fund 2, aimed at expanding its AI and data center businesses with a specific focus on opportunities in the APAC region.
  • In March, 2025, IBM Corp. revealed it was leveraging NVIDIA's advanced AI data platform technologies to improve the scalability and performance of its own AI solutions, aiming to create a cohesive infrastructure for demanding workloads.
  • In March, 2025, Oracle Corp. and NVIDIA announced a collaboration to accelerate AI inference for enterprises by making NVIDIA's AI Enterprise software natively available through the Oracle Cloud Infrastructure.
  • In May, 2025, IBM Corp. expanded its partnership with Oracle Corp. to integrate its watsonx AI and data portfolio into the Oracle Cloud Infrastructure, aiming to enhance generative AI-driven enterprise productivity.

Dive into Technavio’s robust research methodology, blending expert interviews, extensive data synthesis, and validated models for unparalleled AI Integration Platforms Market insights. See full methodology.

Market Scope
Page number 304
Base year 2025
Historic period 2020-2024
Forecast period 2026-2030
Growth momentum & CAGR Accelerate at a CAGR of 35.9%
Market growth 2026-2030 USD 60903.9 million
Market structure Fragmented
YoY growth 2025-2026(%) 29.6%
Key countries US, Canada, Mexico, Germany, UK, France, Italy, Spain, The Netherlands, China, Japan, India, South Korea, Australia, Indonesia, Brazil, Argentina, Chile, Saudi Arabia, UAE, South Africa, Israel and Turkey
Competitive landscape Leading Companies, Market Positioning of Companies, Competitive Strategies, and Industry Risks

Request Free Sample

Research Analyst Overview

  • The AI integration platforms market is defined by its role as the critical middleware layer enabling enterprises to operationalize machine learning models and other advanced capabilities. The relentless pursuit of hyper-automation is a primary driver, with platforms providing workflow automation tools that connect disparate systems and data sources.
  • This evolution is compelling boardroom-level discussions around digital transformation investment, shifting focus toward solutions that deliver tangible operational efficiencies. The adoption of low-code development environments is democratizing access, allowing non-technical users to participate in building and deploying intelligent workflows. Key functionalities include robust MLOps for model lifecycle management, AIOps for infrastructure optimization, and support for technologies like natural language processing.
  • Platforms are increasingly built on an event-driven architecture, ensuring real-time responsiveness. As organizations manage complex data ecosystems, features supporting data wrangling and feature engineering are essential for preparing data for machine learning. Companies using these platforms have achieved a 30% reduction in data preparation time, accelerating the entire data-to-insight lifecycle.

What are the Key Data Covered in this AI Integration Platforms Market Research and Growth Report?

  • What is the expected growth of the AI Integration Platforms Market between 2026 and 2030?

    • USD 60.90 billion, at a CAGR of 35.9%

  • What segmentation does the market report cover?

    • The report is segmented by Product (Cloud platform, On-premises and hybrid integration, and Edge integration), Type (Application-to-application integration, Data-to-data integration, and API management), End-user (Enterprise IT and software, BFSI, Healthcare, Retail and e commerce, and Others) and Geography (North America, Europe, APAC, South America, Middle East and Africa)

  • Which regions are analyzed in the report?

    • North America, Europe, APAC, South America and Middle East and Africa

  • What are the key growth drivers and market challenges?

    • Overarching imperative for business process automation and enhanced operational efficiency, Data privacy and regulatory compliance complexity

  • Who are the major players in the AI Integration Platforms Market?

    • Activepieces, Celigo Inc., Google LLC, IBM Corp., Jitterbit Inc., Make Inc., Microsoft Corp., MuleSoft LLC, n8n GmbH, Oracle Corp., Pipedream Inc., SAP SE, SnapLogic Inc., Talend Inc., TIBCO Software Inc., Tray.ai Inc., Workato Inc., WSO2 Inc. and Zapier Inc.

Market Research Insights

  • The market's dynamics are shaped by a pronounced shift toward intelligent automation to enhance operational efficiency and accelerate digital transformation initiatives. Enterprises are leveraging these platforms for data-driven decision-making, achieving outcomes such as a 15% improvement in forecast accuracy.
  • The adoption of predictive and prescriptive analytics is unlocking new value, with some firms reporting a 25% reduction in process cycle times. As citizen developers become more involved, the demand for user-friendly interfaces grows, driving innovation in low-code and no-code solutions.
  • This democratization of AI enables broader application, from optimizing supply chains to personalizing customer experiences, reflecting a move toward a more agile and responsive organizational structure.

We can help! Our analysts can customize this ai integration platforms market research report to meet your requirements.

Get in touch

1. Executive Summary

1.1 Market overview

Executive Summary - Chart on Market Overview
Executive Summary - Data Table on Market Overview
Executive Summary - Chart on Global Market Characteristics
Executive Summary - Chart on Market by Geography
Executive Summary - Chart on Market Segmentation by Product
Executive Summary - Chart on Market Segmentation by Type
Executive Summary - Chart on Market Segmentation by End-user
Executive Summary - Chart on Incremental Growth
Executive Summary - Data Table on Incremental Growth
Executive Summary - Chart on Company Market Positioning

2. Technavio Analysis

2.1 Analysis of price sensitivity, lifecycle, customer purchase basket, adoption rates, and purchase criteria

2.2 Criticality of inputs and Factors of differentiation

Chart on Overview on criticality of inputs and factors of differentiation

2.3 Factors of disruption

Chart on Overview on factors of disruption

2.4 Impact of drivers and challenges

Chart on Impact of drivers and challenges in 2025 and 2030

3. Market Landscape

3.1 Market ecosystem

Chart on Parent Market
Data Table on - Parent Market

3.2 Market characteristics

Chart on Market characteristics analysis

3.3 Value chain analysis

Chart on Value chain analysis

4. Market Sizing

4.1 Market definition

Data Table on Offerings of companies included in the market definition

4.2 Market segment analysis

Market segments

4.3 Market size 2025

4.4 Market outlook: Forecast for 2025-2030

Chart on Global - Market size and forecast 2025-2030 ($ million)
Data Table on Global - Market size and forecast 2025-2030 ($ million)
Chart on Global Market: Year-over-year growth 2025-2030 (%)
Data Table on Global Market: Year-over-year growth 2025-2030 (%)

5. Historic Market Size

5.1 Global AI Integration Platforms Market 2020 - 2024

Historic Market Size - Data Table on Global AI Integration Platforms Market 2020 - 2024 ($ million)

5.2 Product segment analysis 2020 - 2024

Historic Market Size - Product Segment 2020 - 2024 ($ million)

5.3 Type segment analysis 2020 - 2024

Historic Market Size - Type Segment 2020 - 2024 ($ million)

5.4 End-user segment analysis 2020 - 2024

Historic Market Size - End-user Segment 2020 - 2024 ($ million)

5.5 Geography segment analysis 2020 - 2024

Historic Market Size - Geography Segment 2020 - 2024 ($ million)

5.6 Country segment analysis 2020 - 2024

Historic Market Size - Country Segment 2020 - 2024 ($ million)

6. Qualitative Analysis

6.1 Impact of geopolitical conflicts on global AI integration platforms market

7. Five Forces Analysis

7.1 Five forces summary

Five forces analysis - Comparison between 2025 and 2030

7.2 Bargaining power of buyers

Bargaining power of buyers - Impact of key factors 2025 and 2030

7.3 Bargaining power of suppliers

Bargaining power of suppliers - Impact of key factors in 2025 and 2030

7.4 Threat of new entrants

Threat of new entrants - Impact of key factors in 2025 and 2030

7.5 Threat of substitutes

Threat of substitutes - Impact of key factors in 2025 and 2030

7.6 Threat of rivalry

Threat of rivalry - Impact of key factors in 2025 and 2030

7.7 Market condition

Chart on Market condition - Five forces 2025 and 2030

8. Market Segmentation by Product

8.1 Market segments

Chart on Product - Market share 2025-2030 (%)
Data Table on Product - Market share 2025-2030 (%)

8.2 Comparison by Product

Chart on Comparison by Product
Data Table on Comparison by Product

8.3 Cloud platform - Market size and forecast 2025-2030

Chart on Cloud platform - Market size and forecast 2025-2030 ($ million)
Data Table on Cloud platform - Market size and forecast 2025-2030 ($ million)
Chart on Cloud platform - Year-over-year growth 2025-2030 (%)
Data Table on Cloud platform - Year-over-year growth 2025-2030 (%)

8.4 On-premises and hybrid integration - Market size and forecast 2025-2030

Chart on On-premises and hybrid integration - Market size and forecast 2025-2030 ($ million)
Data Table on On-premises and hybrid integration - Market size and forecast 2025-2030 ($ million)
Chart on On-premises and hybrid integration - Year-over-year growth 2025-2030 (%)
Data Table on On-premises and hybrid integration - Year-over-year growth 2025-2030 (%)

8.5 Edge integration - Market size and forecast 2025-2030

Chart on Edge integration - Market size and forecast 2025-2030 ($ million)
Data Table on Edge integration - Market size and forecast 2025-2030 ($ million)
Chart on Edge integration - Year-over-year growth 2025-2030 (%)
Data Table on Edge integration - Year-over-year growth 2025-2030 (%)

8.6 Market opportunity by Product

Market opportunity by Product ($ million)
Data Table on Market opportunity by Product ($ million)

9. Market Segmentation by Type

9.1 Market segments

Chart on Type - Market share 2025-2030 (%)
Data Table on Type - Market share 2025-2030 (%)

9.2 Comparison by Type

Chart on Comparison by Type
Data Table on Comparison by Type

9.3 Application-to-application integration - Market size and forecast 2025-2030

Chart on Application-to-application integration - Market size and forecast 2025-2030 ($ million)
Data Table on Application-to-application integration - Market size and forecast 2025-2030 ($ million)
Chart on Application-to-application integration - Year-over-year growth 2025-2030 (%)
Data Table on Application-to-application integration - Year-over-year growth 2025-2030 (%)

9.4 Data-to-data integration - Market size and forecast 2025-2030

Chart on Data-to-data integration - Market size and forecast 2025-2030 ($ million)
Data Table on Data-to-data integration - Market size and forecast 2025-2030 ($ million)
Chart on Data-to-data integration - Year-over-year growth 2025-2030 (%)
Data Table on Data-to-data integration - Year-over-year growth 2025-2030 (%)

9.5 API management - Market size and forecast 2025-2030

Chart on API management - Market size and forecast 2025-2030 ($ million)
Data Table on API management - Market size and forecast 2025-2030 ($ million)
Chart on API management - Year-over-year growth 2025-2030 (%)
Data Table on API management - Year-over-year growth 2025-2030 (%)

9.6 Market opportunity by Type

Market opportunity by Type ($ million)
Data Table on Market opportunity by Type ($ million)

10. Market Segmentation by End-user

10.1 Market segments

Chart on End-user - Market share 2025-2030 (%)
Data Table on End-user - Market share 2025-2030 (%)

10.2 Comparison by End-user

Chart on Comparison by End-user
Data Table on Comparison by End-user

10.3 Enterprise IT and software - Market size and forecast 2025-2030

Chart on Enterprise IT and software - Market size and forecast 2025-2030 ($ million)
Data Table on Enterprise IT and software - Market size and forecast 2025-2030 ($ million)
Chart on Enterprise IT and software - Year-over-year growth 2025-2030 (%)
Data Table on Enterprise IT and software - Year-over-year growth 2025-2030 (%)

10.4 BFSI - Market size and forecast 2025-2030

Chart on BFSI - Market size and forecast 2025-2030 ($ million)
Data Table on BFSI - Market size and forecast 2025-2030 ($ million)
Chart on BFSI - Year-over-year growth 2025-2030 (%)
Data Table on BFSI - Year-over-year growth 2025-2030 (%)

10.5 Healthcare - Market size and forecast 2025-2030

Chart on Healthcare - Market size and forecast 2025-2030 ($ million)
Data Table on Healthcare - Market size and forecast 2025-2030 ($ million)
Chart on Healthcare - Year-over-year growth 2025-2030 (%)
Data Table on Healthcare - Year-over-year growth 2025-2030 (%)

10.6 Retail and e commerce - Market size and forecast 2025-2030

Chart on Retail and e commerce - Market size and forecast 2025-2030 ($ million)
Data Table on Retail and e commerce - Market size and forecast 2025-2030 ($ million)
Chart on Retail and e commerce - Year-over-year growth 2025-2030 (%)
Data Table on Retail and e commerce - Year-over-year growth 2025-2030 (%)

10.7 Others - Market size and forecast 2025-2030

Chart on Others - Market size and forecast 2025-2030 ($ million)
Data Table on Others - Market size and forecast 2025-2030 ($ million)
Chart on Others - Year-over-year growth 2025-2030 (%)
Data Table on Others - Year-over-year growth 2025-2030 (%)

10.8 Market opportunity by End-user

Market opportunity by End-user ($ million)
Data Table on Market opportunity by End-user ($ million)

11. Customer Landscape

11.1 Customer landscape overview

Analysis of price sensitivity, lifecycle, customer purchase basket, adoption rates, and purchase criteria

12. Geographic Landscape

12.1 Geographic segmentation

Chart on Market share by geography 2025-2030 (%)
Data Table on Market share by geography 2025-2030 (%)

12.2 Geographic comparison

Chart on Geographic comparison
Data Table on Geographic comparison

12.3 North America - Market size and forecast 2025-2030

Chart on North America - Market size and forecast 2025-2030 ($ million)
Data Table on North America - Market size and forecast 2025-2030 ($ million)
Chart on North America - Year-over-year growth 2025-2030 (%)
Data Table on North America - Year-over-year growth 2025-2030 (%)
Chart on Regional Comparison - North America
Data Table on Regional Comparison - North America

12.3.1 US - Market size and forecast 2025-2030

Chart on US - Market size and forecast 2025-2030 ($ million)
Data Table on US - Market size and forecast 2025-2030 ($ million)
Chart on US - Year-over-year growth 2025-2030 (%)
Data Table on US - Year-over-year growth 2025-2030 (%)

12.3.2 Canada - Market size and forecast 2025-2030

Chart on Canada - Market size and forecast 2025-2030 ($ million)
Data Table on Canada - Market size and forecast 2025-2030 ($ million)
Chart on Canada - Year-over-year growth 2025-2030 (%)
Data Table on Canada - Year-over-year growth 2025-2030 (%)

12.3.3 Mexico - Market size and forecast 2025-2030

Chart on Mexico - Market size and forecast 2025-2030 ($ million)
Data Table on Mexico - Market size and forecast 2025-2030 ($ million)
Chart on Mexico - Year-over-year growth 2025-2030 (%)
Data Table on Mexico - Year-over-year growth 2025-2030 (%)

12.4 Europe - Market size and forecast 2025-2030

Chart on Europe - Market size and forecast 2025-2030 ($ million)
Data Table on Europe - Market size and forecast 2025-2030 ($ million)
Chart on Europe - Year-over-year growth 2025-2030 (%)
Data Table on Europe - Year-over-year growth 2025-2030 (%)
Chart on Regional Comparison - Europe
Data Table on Regional Comparison - Europe

12.4.1 Germany - Market size and forecast 2025-2030

Chart on Germany - Market size and forecast 2025-2030 ($ million)
Data Table on Germany - Market size and forecast 2025-2030 ($ million)
Chart on Germany - Year-over-year growth 2025-2030 (%)
Data Table on Germany - Year-over-year growth 2025-2030 (%)

12.4.2 UK - Market size and forecast 2025-2030

Chart on UK - Market size and forecast 2025-2030 ($ million)
Data Table on UK - Market size and forecast 2025-2030 ($ million)
Chart on UK - Year-over-year growth 2025-2030 (%)
Data Table on UK - Year-over-year growth 2025-2030 (%)

12.4.3 France - Market size and forecast 2025-2030

Chart on France - Market size and forecast 2025-2030 ($ million)
Data Table on France - Market size and forecast 2025-2030 ($ million)
Chart on France - Year-over-year growth 2025-2030 (%)
Data Table on France - Year-over-year growth 2025-2030 (%)

12.4.4 Italy - Market size and forecast 2025-2030

Chart on Italy - Market size and forecast 2025-2030 ($ million)
Data Table on Italy - Market size and forecast 2025-2030 ($ million)
Chart on Italy - Year-over-year growth 2025-2030 (%)
Data Table on Italy - Year-over-year growth 2025-2030 (%)

12.4.5 Spain - Market size and forecast 2025-2030

Chart on Spain - Market size and forecast 2025-2030 ($ million)
Data Table on Spain - Market size and forecast 2025-2030 ($ million)
Chart on Spain - Year-over-year growth 2025-2030 (%)
Data Table on Spain - Year-over-year growth 2025-2030 (%)

12.4.6 The Netherlands - Market size and forecast 2025-2030

Chart on The Netherlands - Market size and forecast 2025-2030 ($ million)
Data Table on The Netherlands - Market size and forecast 2025-2030 ($ million)
Chart on The Netherlands - Year-over-year growth 2025-2030 (%)
Data Table on The Netherlands - Year-over-year growth 2025-2030 (%)

12.5 APAC - Market size and forecast 2025-2030

Chart on APAC - Market size and forecast 2025-2030 ($ million)
Data Table on APAC - Market size and forecast 2025-2030 ($ million)
Chart on APAC - Year-over-year growth 2025-2030 (%)
Data Table on APAC - Year-over-year growth 2025-2030 (%)
Chart on Regional Comparison - APAC
Data Table on Regional Comparison - APAC

12.5.1 China - Market size and forecast 2025-2030

Chart on China - Market size and forecast 2025-2030 ($ million)
Data Table on China - Market size and forecast 2025-2030 ($ million)
Chart on China - Year-over-year growth 2025-2030 (%)
Data Table on China - Year-over-year growth 2025-2030 (%)

12.5.2 Japan - Market size and forecast 2025-2030

Chart on Japan - Market size and forecast 2025-2030 ($ million)
Data Table on Japan - Market size and forecast 2025-2030 ($ million)
Chart on Japan - Year-over-year growth 2025-2030 (%)
Data Table on Japan - Year-over-year growth 2025-2030 (%)

12.5.3 India - Market size and forecast 2025-2030

Chart on India - Market size and forecast 2025-2030 ($ million)
Data Table on India - Market size and forecast 2025-2030 ($ million)
Chart on India - Year-over-year growth 2025-2030 (%)
Data Table on India - Year-over-year growth 2025-2030 (%)

12.5.4 South Korea - Market size and forecast 2025-2030

Chart on South Korea - Market size and forecast 2025-2030 ($ million)
Data Table on South Korea - Market size and forecast 2025-2030 ($ million)
Chart on South Korea - Year-over-year growth 2025-2030 (%)
Data Table on South Korea - Year-over-year growth 2025-2030 (%)

12.5.5 Australia - Market size and forecast 2025-2030

Chart on Australia - Market size and forecast 2025-2030 ($ million)
Data Table on Australia - Market size and forecast 2025-2030 ($ million)
Chart on Australia - Year-over-year growth 2025-2030 (%)
Data Table on Australia - Year-over-year growth 2025-2030 (%)

12.5.6 Indonesia - Market size and forecast 2025-2030

Chart on Indonesia - Market size and forecast 2025-2030 ($ million)
Data Table on Indonesia - Market size and forecast 2025-2030 ($ million)
Chart on Indonesia - Year-over-year growth 2025-2030 (%)
Data Table on Indonesia - Year-over-year growth 2025-2030 (%)

12.6 South America - Market size and forecast 2025-2030

Chart on South America - Market size and forecast 2025-2030 ($ million)
Data Table on South America - Market size and forecast 2025-2030 ($ million)
Chart on South America - Year-over-year growth 2025-2030 (%)
Data Table on South America - Year-over-year growth 2025-2030 (%)
Chart on Regional Comparison - South America
Data Table on Regional Comparison - South America

12.6.1 Brazil - Market size and forecast 2025-2030

Chart on Brazil - Market size and forecast 2025-2030 ($ million)
Data Table on Brazil - Market size and forecast 2025-2030 ($ million)
Chart on Brazil - Year-over-year growth 2025-2030 (%)
Data Table on Brazil - Year-over-year growth 2025-2030 (%)

12.6.2 Argentina - Market size and forecast 2025-2030

Chart on Argentina - Market size and forecast 2025-2030 ($ million)
Data Table on Argentina - Market size and forecast 2025-2030 ($ million)
Chart on Argentina - Year-over-year growth 2025-2030 (%)
Data Table on Argentina - Year-over-year growth 2025-2030 (%)

12.6.3 Chile - Market size and forecast 2025-2030

Chart on Chile - Market size and forecast 2025-2030 ($ million)
Data Table on Chile - Market size and forecast 2025-2030 ($ million)
Chart on Chile - Year-over-year growth 2025-2030 (%)
Data Table on Chile - Year-over-year growth 2025-2030 (%)

12.7 Middle East and Africa - Market size and forecast 2025-2030

Chart on Middle East and Africa - Market size and forecast 2025-2030 ($ million)
Data Table on Middle East and Africa - Market size and forecast 2025-2030 ($ million)
Chart on Middle East and Africa - Year-over-year growth 2025-2030 (%)
Data Table on Middle East and Africa - Year-over-year growth 2025-2030 (%)
Chart on Regional Comparison - Middle East and Africa
Data Table on Regional Comparison - Middle East and Africa

12.7.1 Saudi Arabia - Market size and forecast 2025-2030

Chart on Saudi Arabia - Market size and forecast 2025-2030 ($ million)
Data Table on Saudi Arabia - Market size and forecast 2025-2030 ($ million)
Chart on Saudi Arabia - Year-over-year growth 2025-2030 (%)
Data Table on Saudi Arabia - Year-over-year growth 2025-2030 (%)

12.7.2 UAE - Market size and forecast 2025-2030

Chart on UAE - Market size and forecast 2025-2030 ($ million)
Data Table on UAE - Market size and forecast 2025-2030 ($ million)
Chart on UAE - Year-over-year growth 2025-2030 (%)
Data Table on UAE - Year-over-year growth 2025-2030 (%)

12.7.3 South Africa - Market size and forecast 2025-2030

Chart on South Africa - Market size and forecast 2025-2030 ($ million)
Data Table on South Africa - Market size and forecast 2025-2030 ($ million)
Chart on South Africa - Year-over-year growth 2025-2030 (%)
Data Table on South Africa - Year-over-year growth 2025-2030 (%)

12.7.4 Israel - Market size and forecast 2025-2030

Chart on Israel - Market size and forecast 2025-2030 ($ million)
Data Table on Israel - Market size and forecast 2025-2030 ($ million)
Chart on Israel - Year-over-year growth 2025-2030 (%)
Data Table on Israel - Year-over-year growth 2025-2030 (%)

12.7.5 Turkey - Market size and forecast 2025-2030

Chart on Turkey - Market size and forecast 2025-2030 ($ million)
Data Table on Turkey - Market size and forecast 2025-2030 ($ million)
Chart on Turkey - Year-over-year growth 2025-2030 (%)
Data Table on Turkey - Year-over-year growth 2025-2030 (%)

12.8 Market opportunity by geography

Market opportunity by geography ($ million)
Data Tables on Market opportunity by geography ($ million)

13. Drivers, Challenges, and Opportunity

13.1 Market drivers

Overarching imperative for business process automation and enhanced operational efficiency
Exponential growth of data and critical need for data-driven decision making
Democratization of AI and increasing accessibility of advanced technologies

13.2 Market challenges

Data privacy and regulatory compliance complexity
Interoperability and legacy system integration issues
High implementation costs and specialized talent scarcity

13.3 Impact of drivers and challenges

Impact of drivers and challenges in 2025 and 2030

13.4 Market opportunities

Convergence of low-code development and generative artificial intelligence
Expansion of edge intelligence and decentralized architecture
Advancement of hyper-automation and self-healing workflows

14. Competitive Landscape

14.1 Overview

14.2

Overview on criticality of inputs and factors of differentiation

14.3 Landscape disruption

Overview on factors of disruption

14.4 Industry risks

Impact of key risks on business

15. Competitive Analysis

15.1 Companies profiled

Companies covered

15.2 Company ranking index

15.3 Market positioning of companies

Matrix on companies position and classification

15.4 Activepieces

Activepieces - Overview
Activepieces - Product / Service
Activepieces - Key offerings
SWOT

15.5 Google LLC

Google LLC - Overview
Google LLC - Product / Service
Google LLC - Key offerings
SWOT

15.6 IBM Corp.

IBM Corp. - Overview
IBM Corp. - Business segments
IBM Corp. - Key news
IBM Corp. - Key offerings
IBM Corp. - Segment focus
SWOT

15.7 Microsoft Corp.

Microsoft Corp. - Overview
Microsoft Corp. - Business segments
Microsoft Corp. - Key news
Microsoft Corp. - Key offerings
Microsoft Corp. - Segment focus
SWOT

15.8 MuleSoft LLC

MuleSoft LLC - Overview
MuleSoft LLC - Product / Service
MuleSoft LLC - Key offerings
SWOT

15.9 Oracle Corp.

Oracle Corp. - Overview
Oracle Corp. - Business segments
Oracle Corp. - Key news
Oracle Corp. - Key offerings
Oracle Corp. - Segment focus
SWOT

15.10 Pipedream Inc.

Pipedream Inc. - Overview
Pipedream Inc. - Product / Service
Pipedream Inc. - Key offerings
SWOT

15.11 SAP SE

SAP SE - Overview
SAP SE - Business segments
SAP SE - Key news
SAP SE - Key offerings
SAP SE - Segment focus
SWOT

15.12 SnapLogic Inc.

SnapLogic Inc. - Overview
SnapLogic Inc. - Product / Service
SnapLogic Inc. - Key offerings
SWOT

15.13 Talend Inc.

Talend Inc. - Overview
Talend Inc. - Product / Service
Talend Inc. - Key offerings
SWOT

15.14 TIBCO Software Inc.

TIBCO Software Inc. - Overview
TIBCO Software Inc. - Product / Service
TIBCO Software Inc. - Key offerings
SWOT

15.15 Tray.ai Inc.

Tray.ai Inc. - Overview
Tray.ai Inc. - Product / Service
Tray.ai Inc. - Key offerings
SWOT

15.16 Workato Inc.

Workato Inc. - Overview
Workato Inc. - Product / Service
Workato Inc. - Key offerings
SWOT

15.17 WSO2 Inc.

WSO2 Inc. - Overview
WSO2 Inc. - Product / Service
WSO2 Inc. - Key offerings
SWOT

15.18 Zapier Inc.

Zapier Inc. - Overview
Zapier Inc. - Product / Service
Zapier Inc. - Key offerings
SWOT

16. Appendix

16.1 Scope of the report

Market definition
Objectives
Notes and caveats

16.2 Inclusions and exclusions checklist

Inclusions checklist
Exclusions checklist

16.3 Currency conversion rates for US$

16.4 Research methodology

16.5 Data procurement

Information sources

16.6 Data validation

16.7 Validation techniques employed for market sizing

16.8 Data synthesis

16.9 360 degree market analysis

16.10 List of abbreviations

Research Methodology

Technavio presents a detailed picture of the market by way of study, synthesis, and summation of data from multiple sources. The analysts have presented the various facets of the market with a particular focus on identifying the key industry influencers. The data thus presented is comprehensive, reliable, and the result of extensive research, both primary and secondary.

INFORMATION SOURCES

Primary sources

  • Manufacturers and suppliers
  • Channel partners
  • Industry experts
  • Strategic decision makers

Secondary sources

  • Industry journals and periodicals
  • Government data
  • Financial reports of key industry players
  • Historical data
  • Press releases

DATA ANALYSIS

Data Synthesis

  • Collation of data
  • Estimation of key figures
  • Analysis of derived insights

Data Validation

  • Triangulation with data models
  • Reference against proprietary databases
  • Corroboration with industry experts

REPORT WRITING

Qualitative

  • Market drivers
  • Market challenges
  • Market trends
  • Five forces analysis

Quantitative

  • Market size and forecast
  • Market segmentation
  • Geographical insights
  • Competitive landscape

Interested in this report?

Get your sample now to see our research methodology and insights!

Download Now

Frequently Asked Questions

AI Integration Platforms market growth will increase by USD 60903.9 million during 2026-2030.

The AI Integration Platforms market is expected to grow at a CAGR of 35.9% during 2026-2030.

AI Integration Platforms market is segmented by Product (Cloud platform, On-premises and hybrid integration, Edge integration) Type (Application-to-application integration, Data-to-data integration, API management) End-user (Enterprise IT and software, BFSI, Healthcare, Retail and e commerce, Others)

Activepieces, Celigo Inc., Google LLC, IBM Corp., Jitterbit Inc., Make Inc., Microsoft Corp., MuleSoft LLC, n8n GmbH, Oracle Corp., Pipedream Inc., SAP SE, SnapLogic Inc., Talend Inc., TIBCO Software Inc., Tray.ai Inc., Workato Inc., WSO2 Inc., Zapier Inc. are a few of the key vendors in the AI Integration Platforms market.

North America will register the highest growth rate of 35.4% among the other regions. Therefore, the AI Integration Platforms market in North America is expected to garner significant business opportunities for the vendors during the forecast period.

US, Canada, Mexico, Germany, UK, France, Italy, Spain, The Netherlands, China, Japan, India, South Korea, Australia, Indonesia, Brazil, Argentina, Chile, Saudi Arabia, UAE, South Africa, Israel, Turkey

  • Overarching imperative for business process automation and enhanced operational efficiency is the driving factor this market.

The AI Integration Platforms market vendors should focus on grabbing business opportunities from the Product segment as it accounted for the largest market share in the base year.
RIA - Research AI Assistant
Ask RIA