
AI PC Market Size 2025-2029
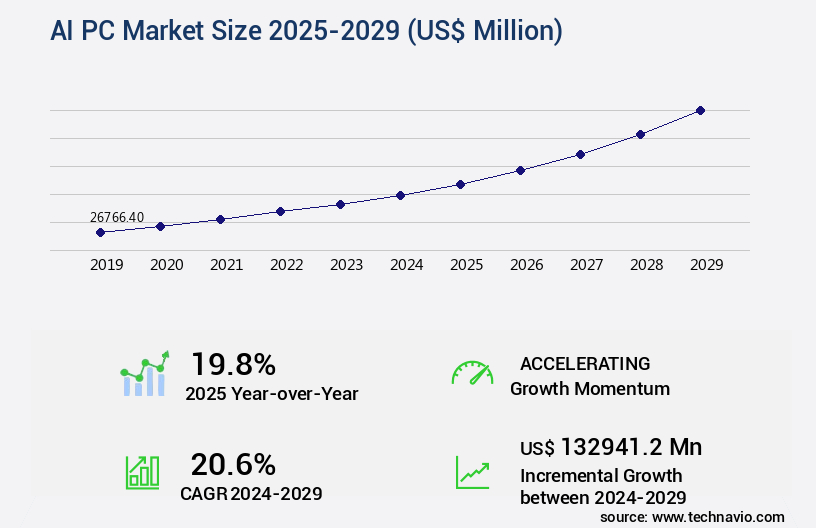
The AI PC market size is valued to increase by USD 132.94 billion, at a CAGR of 20.6% from 2024 to 2029. Integration of dedicated AI accelerators into mainstream processors will drive the ai pc market.
Major Market Trends & Insights
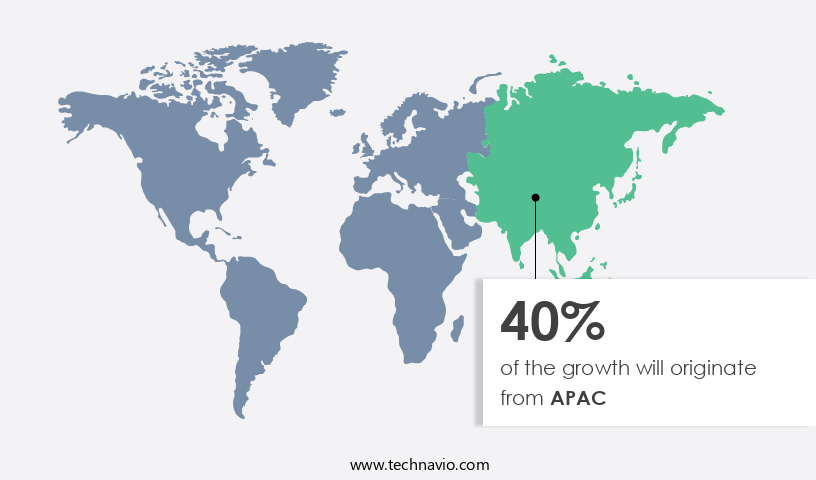
- APAC dominated the market and accounted for a 40% growth during the forecast period.
- By Product - Laptop segment was valued at USD 15.18 billion in 2023
- By Type - NPU segment accounted for the largest market revenue share in 2023
Market Size & Forecast
- Market Opportunities: USD 717.10 million
- Market Future Opportunities: USD 132941.20 million
- CAGR from 2024 to 2029 : 20.6%
Market Summary
- The market is experiencing significant advancements, driven by the integration of dedicated AI accelerators into mainstream processors. This technological fusion is propelling the industry forward, enabling more efficient and effective AI computations. However, the market's growth is not without challenges. The proliferation of heterogeneous computing as a new architectural standard poses complexity in system design and integration. Furthermore, despite these advancements, a clear and compelling value proposition for mass market adoption remains elusive. The global AI chip market size was valued at USD5.05 billion in 2020, reflecting the market's potential and the growing demand for AI-enabled technologies.
- As the industry continues to evolve, it is essential for businesses to stay informed and adapt to these technological shifts to remain competitive.
What will be the Size of the AI PC Market during the forecast period?
Get Key Insights on Market Forecast (PDF) Request Free Sample
How is the AI PC Market Segmented ?
The AI PC industry research report provides comprehensive data (region-wise segment analysis), with forecasts and estimates in "USD million" for the period 2025-2029, as well as historical data from 2019-2023 for the following segments.
- Product
- Laptop
- Desktop
- Workstation
- Type
- NPU
- GPU
- CPU
- OS
- Mac OS
- Windows
- Others
- End-user
- Individual
- Enterprise
- Geography
- North America
- US
- Canada
- Europe
- France
- Germany
- UK
- APAC
- Australia
- China
- India
- Japan
- South Korea
- Rest of World (ROW)
- North America
By Product Insights
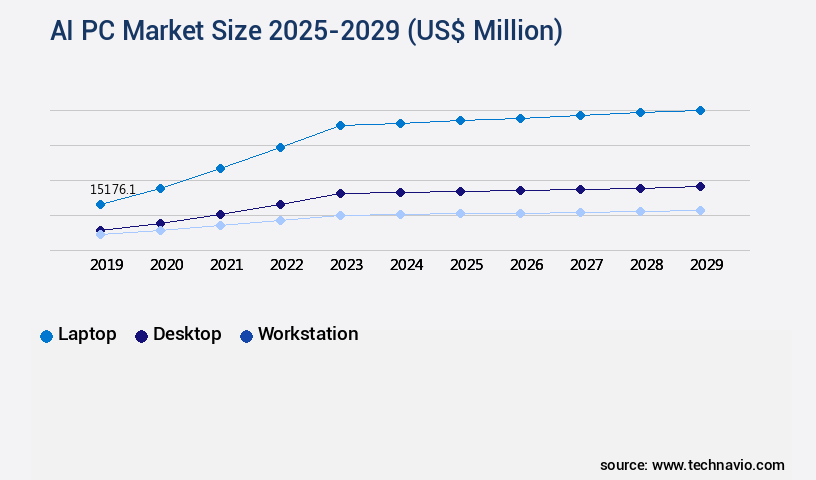
The laptop segment is estimated to witness significant growth during the forecast period.
The market has experienced significant growth and evolution, with a particular focus on the laptop segment. This focus is driven by the advantages of on-device AI for mobile computing, including power efficiency and increased productivity on the go. In October 2023, Qualcomm Technologies, Inc. Introduced the Snapdragon X Elite platform, an ARM-based System on a Chip (SoC) with a high-performance Neural Processing Unit (NPU), enhancing AI capability and battery life in Windows laptops. Intel Corporation followed suit in December 2023 with the launch of its Core Ultra processors, the first mainstream client platform with an integrated NPU. Advanced Micro Devices Inc.
Also joined the fray. The market continues to innovate, with ongoing activities in areas such as natural language processing, data security protocols, feature engineering methods, bias detection methods, and ethical considerations. Key developments include advancements in neural network architecture, model deployment strategies, performance benchmarking, data preprocessing pipelines, model performance metrics, and regulatory compliance. Parallel computing platforms, hardware acceleration methods, data augmentation techniques, deep learning algorithms, inference speed optimization, version control systems, distributed training frameworks, AI model training, gpu computing clusters, model explainability techniques, privacy preserving techniques, machine learning models, software development kits, AI ethics frameworks, computer vision systems, testing and validation, API integration services, responsible AI development, and cloud computing services are all integral parts of this dynamic landscape.
A recent study reveals that the global AI chip market is projected to reach a value of USD118.6 billion by 2027, underscoring the market's potential and ongoing growth.
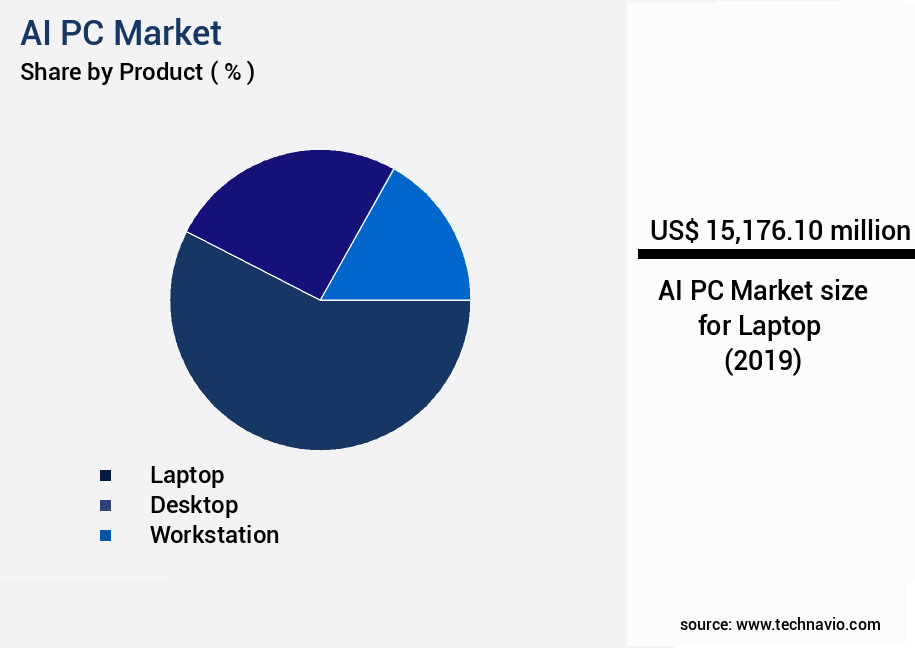
The Laptop segment was valued at USD 15.18 billion in 2019 and showed a gradual increase during the forecast period.
Regional Analysis
APAC is estimated to contribute 40% to the growth of the global market during the forecast period.Technavio's analysts have elaborately explained the regional trends and drivers that shape the market during the forecast period.
See How AI PC Market Demand is Rising in APAC Request Free Sample
The Asia Pacific (APAC) region plays a pivotal role in the market, serving as the primary manufacturing hub and the largest volume growth engine. Taiwan, a key player in the supply chain, hosts semiconductor foundries like TSMC and major OEMs such as ASUSTeK Computer Inc. And Acer Inc. These companies contribute significantly to the global ecosystem, not just as manufacturing partners but also as innovators, tailoring products for local and international markets. China, home to Lenovo Group Limited and other prominent brands like Huawei Technologies Co., Ltd., is another significant contributor to the market's growth. The region's dual role is essential, with APAC accounting for approximately 60% of the global PC shipments in 2020, and the market projected to reach a value of over USD270 billion by 2027, as per Market Research Future (MRFR).
This robust growth is driven by the increasing adoption of AI technology in various applications, including education, healthcare, and finance.
Market Dynamics
Our researchers analyzed the data with 2024 as the base year, along with the key drivers, trends, and challenges. A holistic analysis of drivers will help companies refine their marketing strategies to gain a competitive advantage.
The market is experiencing rapid growth as businesses increasingly adopt artificial intelligence (AI) to optimize operations, enhance customer experiences, and drive innovation. One of the key areas of focus in this market is the development and deployment of AI models. Impact model hyperparameter tuning is a critical aspect of AI development, ensuring that models are optimized for maximum performance and accuracy. Deep learning models, in particular, require extensive optimization to deliver reliable results. Cloud-based AI systems offer scalability and flexibility for model deployment, enabling businesses to integrate AI models seamlessly into their workflows. Robust AI algorithms are essential for mitigating bias in training data and ensuring ethical AI guidelines are followed. Evaluating the performance of AI applications is also crucial, with analysis of model accuracy and prediction model uncertainty playing key roles.
Monitoring AI system reliability and implementing privacy-preserving methods are essential for compliance with data protection regulations. Scaling AI infrastructure needs is a significant challenge for businesses, requiring careful consideration of appropriate hardware selection and management of the AI model lifecycle. Improving model generalization and reducing model complexity are ongoing priorities for developers, while enhancing model interpretability and accelerating inference speed are essential for business adoption. In summary, The market is driven by the need for businesses to optimize AI model development, deployment, and management. Key areas of focus include hyperparameter tuning, optimization of deep learning models, integration with business workflows, mitigation of bias in training data, evaluation of performance, monitoring of reliability, implementation of privacy-preserving methods, compliance with data protection regulations, design of ethical AI guidelines, selection of appropriate hardware, scaling of infrastructure, analysis of model accuracy, prediction model uncertainty, improvement of model generalization, reduction of model complexity, and enhancement of model interpretability.
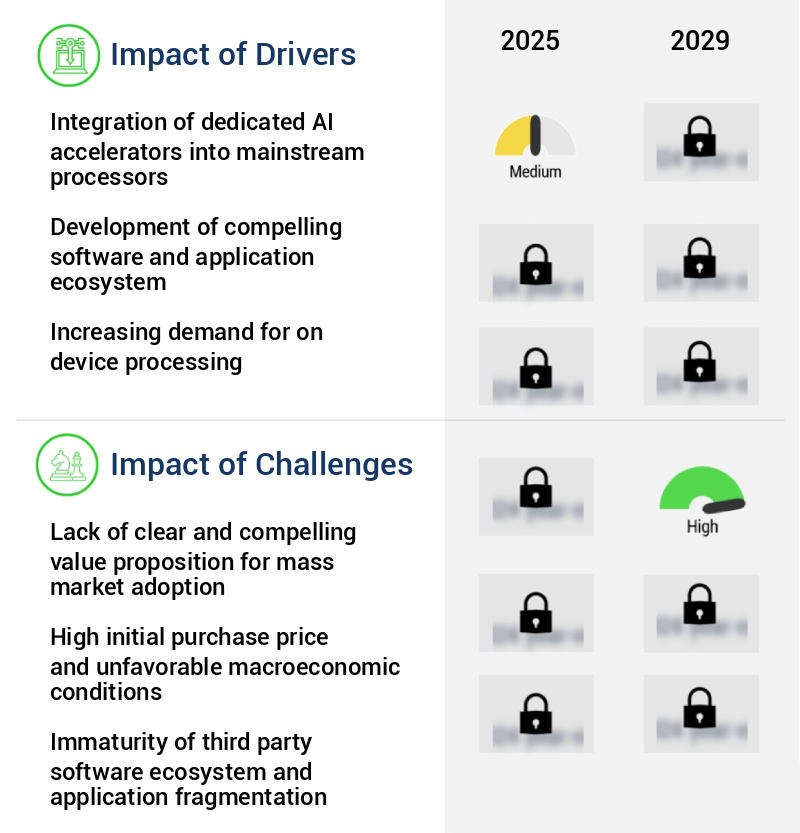
What are the key market drivers leading to the rise in the adoption of AI PC Industry?
- The integration of advanced artificial intelligence (AI) accelerators into mainstream processors is a significant market trend, driving innovation and growth within the technology sector.
- The market has undergone significant transformation with the emergence of dedicated AI accelerators, such as Neural Processing Units (NPUs), in mainstream client processors. This architectural shift has broadened the scope of AI capabilities in standard consumer and enterprise devices, moving it beyond the realm of high-end, discrete Graphics Processing Units (GPUs). Previously, on-device AI was primarily reliant on GPUs, which, while efficient for intensive tasks, lacked the power efficiency necessary for prolonged, low-intensity AI processing in mobile formats.
- The market reached a pivotal juncture in late 2023, marked by a wave of synchronized hardware releases. The integration of AI capabilities into mainstream PCs has expanded their applications across various sectors, including healthcare, finance, education, and manufacturing, enabling real-time data processing and analysis. This evolution underscores the growing importance of AI in driving business innovation and efficiency.
What are the market trends shaping the AI PC Industry?
- The proliferation of heterogeneous computing is emerging as the new architectural standard in the market trend. This approach integrates various processing elements to enhance system performance and flexibility.
- The market is experiencing a significant evolution, marked by the transition to heterogeneous computing architectures. This innovative approach combines the Central Processing Unit (CPU), Graphics Processing Unit (GPU), and Neural Processing Unit (NPU) to optimally distribute workloads and enhance performance and power efficiency. This shift from the traditional CPU-centric model signifies a new paradigm in AI PC technology. The CPU remains the master controller, excelling in general-purpose computing and tasks demanding low latency and single-threaded performance.
- The integration of GPUs and NPUs allows for parallel processing and machine learning tasks, significantly improving overall system efficiency. This tripartite architecture forms the technical foundation for the burgeoning AI PC sector.
What challenges does the AI PC Industry face during its growth?
- The mass market adoption of the industry is hindered by the absence of a clear and compelling value proposition that effectively communicates its benefits to potential customers.
- The market is undergoing significant evolution, expanding its reach across various sectors with the integration of advanced technologies such as on-device AI and Neural Processing Units (NPUs). Despite these advancements, the industry faces the challenge of effectively communicating the tangible benefits to both mainstream consumers and enterprises. The introduction of Microsoft Corporation's Copilot+ PC category in 2024, with its flagship feature Recall, aimed to address this issue by providing a photographic and searchable timeline of user activity. However, the success of this marketing strategy remains uncertain, as the abstract concepts of on-device AI and NPUs require clear, practical applications to resonate with consumers and justify hardware upgrades.
- This growth can be attributed to the increasing demand for AI-enabled devices in industries such as healthcare, finance, and education, where data processing and analysis are critical.
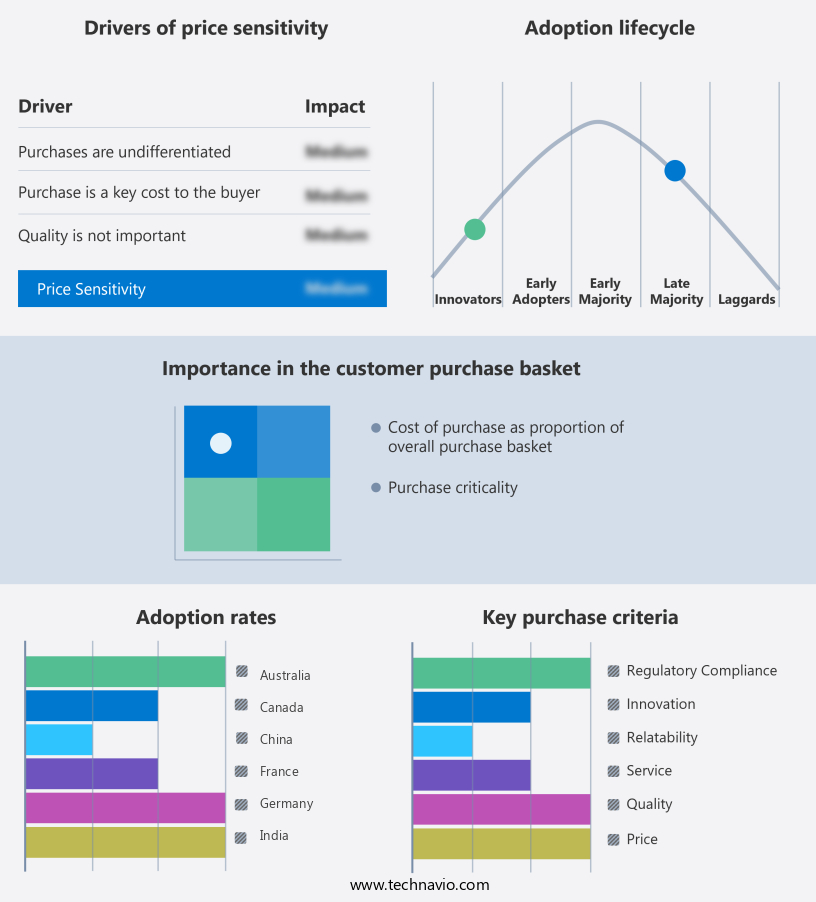
Exclusive Technavio Analysis on Customer Landscape
The ai pc market forecasting report includes the adoption lifecycle of the market, covering from the innovator's stage to the laggard's stage. It focuses on adoption rates in different regions based on penetration. Furthermore, the ai pc market report also includes key purchase criteria and drivers of price sensitivity to help companies evaluate and develop their market growth analysis strategies.
Customer Landscape of AI PC Industry
Competitive Landscape
Companies are implementing various strategies, such as strategic alliances, ai pc market forecast, partnerships, mergers and acquisitions, geographical expansion, and product/service launches, to enhance their presence in the industry.
Acer Inc. - The company showcases AI-powered PCs, including the Swift Edge 14 AI, featuring Intel Core Ultra processors. These systems are optimized for productivity and content creation using advanced AI applications. The integration of AI technology enhances workflow efficiency and delivers superior performance.
The industry research and growth report includes detailed analyses of the competitive landscape of the market and information about key companies, including:
- Acer Inc.
- Apple Inc.
- ASUSTeK Computer Inc.
- BOXX
- Corsair Gaming Inc.
- Dell Technologies Inc.
- Fujitsu Ltd.
- Gigabyte Technology Co. Ltd.
- HP Inc.
- Huawei Technologies Co. Ltd.
- Intel Corp.
- Lambda Inc.
- Lenovo Group Ltd.
- Microsoft Corp.
- Micro Star International Co. Ltd.
- NVIDIA Corp.
- Puget Sound Systems Inc.
- Qualcomm Inc.
- Razer Inc.
Qualitative and quantitative analysis of companies has been conducted to help clients understand the wider business environment as well as the strengths and weaknesses of key industry players. Data is qualitatively analyzed to categorize companies as pure play, category-focused, industry-focused, and diversified; it is quantitatively analyzed to categorize companies as dominant, leading, strong, tentative, and weak.
Recent Development and News in AI PC Market
- In January 2024, Intel Corporation announced the launch of its new 12th Gen Intel Core processor family, integrating artificial intelligence (AI) capabilities into its mainstream desktop processors. This move aimed to bring AI processing closer to the edge, improving overall system performance and reducing latency (Intel press release).
- In March 2024, NVIDIA and Microsoft entered into a strategic partnership to optimize NVIDIA's AI platform, CUDA-X AI, for Microsoft Azure. This collaboration enabled developers to build and deploy AI applications on Azure using NVIDIA GPUs, expanding Microsoft's cloud offerings and strengthening NVIDIA's presence in the cloud market (NVIDIA press release).
- In May 2024, AMD announced a USD1.65 billion investment in its new AI and high-performance computing (HPC) research and development facility in Dresden, Germany. This investment aimed to advance AMD's AI and HPC technologies, positioning the company as a major player in the market and creating over 1,000 new jobs (AMD press release).
- In April 2025, IBM and Lenovo signed a multi-year agreement to collaborate on AI and cloud technologies. Lenovo would integrate IBM's AI solutions, including Watson, into its ThinkSystem and ThinkAgile product lines, expanding Lenovo's offerings and enhancing IBM's reach in the market (IBM press release).
Dive into Technavio's robust research methodology, blending expert interviews, extensive data synthesis, and validated models for unparalleled AI PC Market insights. See full methodology.
|
Market Scope |
|
|
Report Coverage |
Details |
|
Page number |
249 |
|
Base year |
2024 |
|
Historic period |
2019-2023 |
|
Forecast period |
2025-2029 |
|
Growth momentum & CAGR |
Accelerate at a CAGR of 20.6% |
|
Market growth 2025-2029 |
USD 132941.2 million |
|
Market structure |
Fragmented |
|
YoY growth 2024-2025(%) |
19.8 |
|
Key countries |
US, China, Germany, Japan, UK, South Korea, Australia, India, Canada, and France |
|
Competitive landscape |
Leading Companies, Market Positioning of Companies, Competitive Strategies, and Industry Risks |
Research Analyst Overview
- The artificial intelligence (AI) PC market continues to evolve, driven by advancements in natural language processing (NLP), neural network architecture, and deep learning algorithms. These technologies are finding applications across various sectors, from healthcare and finance to education and manufacturing. For instance, a leading e-commerce company reported a 15% increase in sales due to the implementation of AI-powered product recommendation systems. The market's dynamics are shaped by ongoing activities, such as feature engineering methods, data preprocessing pipeline, and model performance metrics. Data security protocols and regulatory compliance AI are becoming increasingly important, with ethical considerations in AI being a growing concern.
- AI system auditing and bias detection methods ensure transparency and fairness in AI model training. Performance benchmarking, parallel computing platforms, and hardware acceleration methods optimize inference speed, while distributed training frameworks and version control systems streamline AI model training. Machine learning models are being integrated with software development kits, computer vision systems, and API integration services. Privacy preserving techniques and model explainability techniques are essential for building responsible AI development. The AI industry is expected to grow by 20% annually, driven by the demand for advanced AI solutions. The market's continuous unfolding is shaped by ongoing research and development, regulatory frameworks, and evolving consumer expectations.
What are the Key Data Covered in this AI PC Market Research and Growth Report?
-
What is the expected growth of the AI PC Market between 2025 and 2029?
-
USD 132.94 billion, at a CAGR of 20.6%
-
-
What segmentation does the market report cover?
-
The report is segmented by Product (Laptop, Desktop, and Workstation), Type (NPU, GPU, and CPU), OS (Mac OS, Windows, and Others), End-user (Individual and Enterprise), and Geography (APAC, North America, Europe, South America, and Middle East and Africa)
-
-
Which regions are analyzed in the report?
-
APAC, North America, Europe, South America, and Middle East and Africa
-
-
What are the key growth drivers and market challenges?
-
Integration of dedicated AI accelerators into mainstream processors, Lack of clear and compelling value proposition for mass market adoption
-
-
Who are the major players in the AI PC Market?
-
Acer Inc., Apple Inc., ASUSTeK Computer Inc., BOXX, Corsair Gaming Inc., Dell Technologies Inc., Fujitsu Ltd., Gigabyte Technology Co. Ltd., HP Inc., Huawei Technologies Co. Ltd., Intel Corp., Lambda Inc., Lenovo Group Ltd., Microsoft Corp., Micro Star International Co. Ltd., NVIDIA Corp., Puget Sound Systems Inc., Qualcomm Inc., and Razer Inc.
-
Market Research Insights
- The market is a dynamic and ever-evolving landscape, characterized by continuous advancements in technology and increasing adoption across various industries. Two notable developments in this space are the integration of advanced machine learning algorithms, such as convolutional neural networks and recurrent neural networks, into PC systems for applications like image classification tasks and text summarization techniques. Moreover, the industry anticipates significant growth, with expectations of a 20% compound annual growth rate over the next five years.
- For instance, the implementation of AI in edge computing deployments has led to a 15% increase in sales for certain organizations, demonstrating the potential impact of AI on business operations.
We can help! Our analysts can customize this AI PC market research report to meet your requirements.
 RIA -
RIA - 
