Ai-powered Battlefield Decision Support Systems Market Analysis, Size, and Forecast 2026-2030: North America (US, Canada, and Mexico), Europe (UK, Germany, and France), APAC (China, India, and Japan), Middle East and Africa (Israel, Saudi Arabia, and UAE), South America (Brazil and Argentina), and Rest of World (ROW)

Ai-powered Battlefield Decision Support Systems Market Analysis, Size, and Forecast 2026-2030:
North America (US, Canada, and Mexico), Europe (UK, Germany, and France), APAC (China, India, and Japan), Middle East and Africa (Israel, Saudi Arabia, and UAE), South America (Brazil and Argentina), and Rest of World (ROW)

Published: Mar 2026 310 Pages SKU: IRTNTR81383

Market Overview at a Glance

$9.63 B
Market Opportunity
21.7%
CAGR 2025 - 2030
35.6%
North America Growth
$1.98 B
Software segment 2024

Ai-powered Battlefield Decision Support Systems Market Size 2026-2030

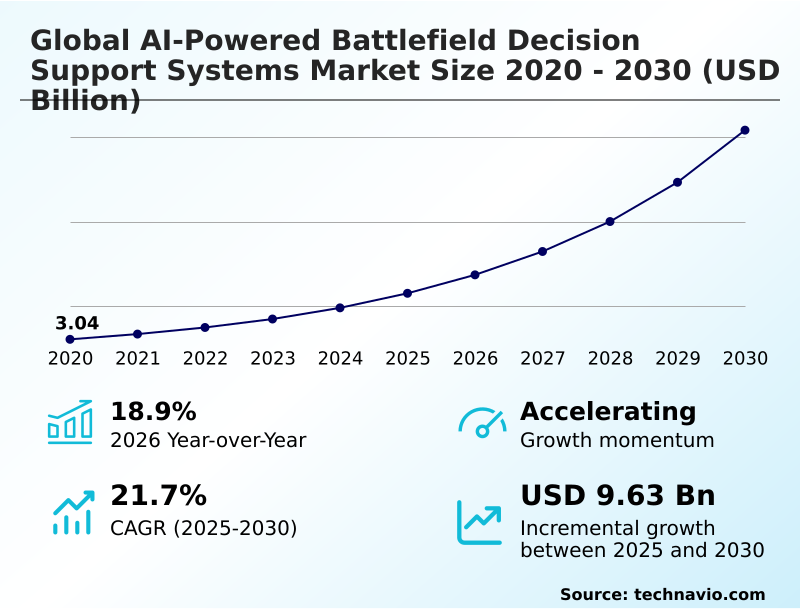
The ai-powered battlefield decision support systems market size is valued to increase by USD 9.63 billion, at a CAGR of 21.7% from 2025 to 2030. Escalation of information density and cognitive saturation will drive the ai-powered battlefield decision support systems market.

Major Market Trends & Insights

  • North America dominated the market and accounted for a 35.6% growth during the forecast period.
  • By Component - Software segment was valued at USD 1.98 billion in 2024
  • By Platform - Airborne systems segment accounted for the largest market revenue share in 2024

Market Size & Forecast

  • Market Opportunities: USD 12.36 billion
  • Market Future Opportunities: USD 9.63 billion
  • CAGR from 2025 to 2030 : 21.7%

Market Summary

  • The AI-powered battlefield decision support systems market is defined by the imperative to accelerate tactical decision-making in increasingly complex, data-rich environments. The core driver is the overwhelming volume of information from sensors, which surpasses human cognitive capacity, necessitating AI to filter, analyze, and prioritize intelligence.
  • Key trends include the adoption of generative AI for mission planning and the deployment of decentralized edge computing to enable autonomous swarm coordination in communication-denied areas. For instance, in logistics, predictive analytics models optimize supply chains by forecasting materiel demands based on operational tempo and environmental factors, reducing delivery times by more than 25% compared to traditional methods.
  • However, the market faces significant challenges, including the vulnerability of systems to data poisoning and the complex ethical governance required for algorithmic recommendations. The pursuit of explainable AI and robust human-machine teaming is crucial for building trust and ensuring responsible deployment in high-stakes scenarios.

What will be the Size of the Ai-powered Battlefield Decision Support Systems Market during the forecast period?

Get Key Insights on Market Forecast (PDF) Request Free Sample

How is the Ai-powered Battlefield Decision Support Systems Market Segmented?

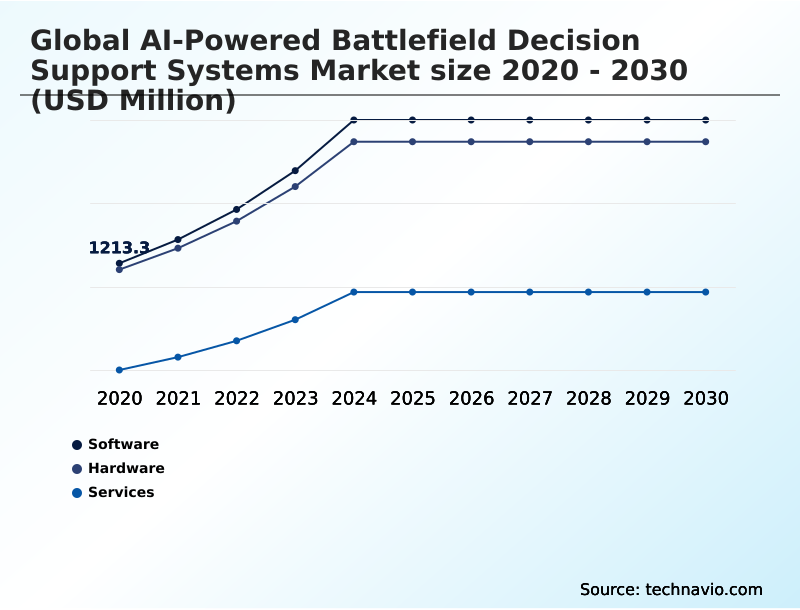
The ai-powered battlefield decision support systems industry research report provides comprehensive data (region-wise segment analysis), with forecasts and estimates in "USD million" for the period 2026-2030, as well as historical data from 2020-2024 for the following segments.

  • Component
    • Software
    • Hardware
    • Services
  • Platform
    • Airborne systems
    • Land-based systems
    • Naval systems
    • Space-based systems
  • Application
    • Situational awareness
    • Threat detection and analysis
    • Target recognition
    • Mission planning
    • Logistics and resource allocation
  • Geography
    • North America
      • US
      • Canada
      • Mexico
    • Europe
      • UK
      • Germany
      • France
    • APAC
      • China
      • India
      • Japan
    • Middle East and Africa
      • Israel
      • Saudi Arabia
      • UAE
    • South America
      • Brazil
      • Argentina
    • Rest of World (ROW)

By Component Insights

The software segment is estimated to witness significant growth during the forecast period.

The software segment is the core intelligence layer, encapsulating the complex algorithms that drive battlefield decision-making. This segment is shifting toward decentralized processing and leveraging containerized applications for rapid field deployment.

A key focus is the development of neural networks for advanced computer vision, which facilitates precise target recognition and threat detection. Innovations in natural language processing reduce the administrative load on officers.

The evolution of human-machine teaming ensures that technology complements soldier intuition, a critical factor for mission success.

One advanced computer vision software module demonstrated the ability to identify camouflaged assets with a 95% precision rate, enhancing predictive maintenance and logistics and resource allocation.

Request Free Sample

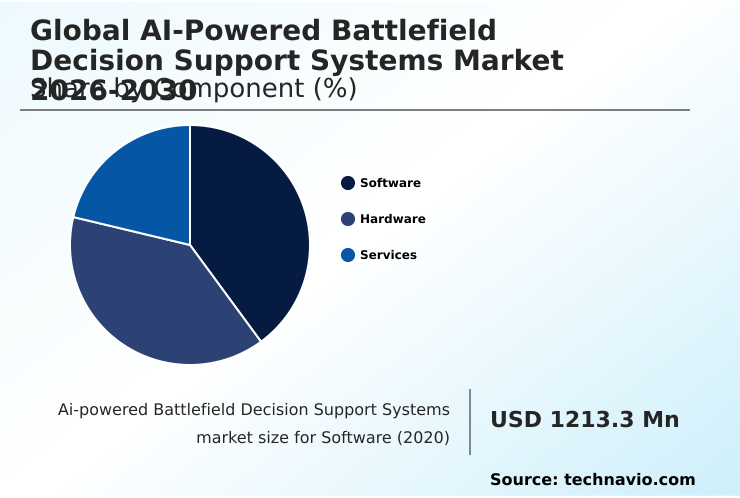
The Software segment was valued at USD 1.98 billion in 2024 and showed a gradual increase during the forecast period.

Request Free Sample

Regional Analysis

North America is estimated to contribute 35.6% to the growth of the global market during the forecast period.Technavio’s analysts have elaborately explained the regional trends and drivers that shape the market during the forecast period.

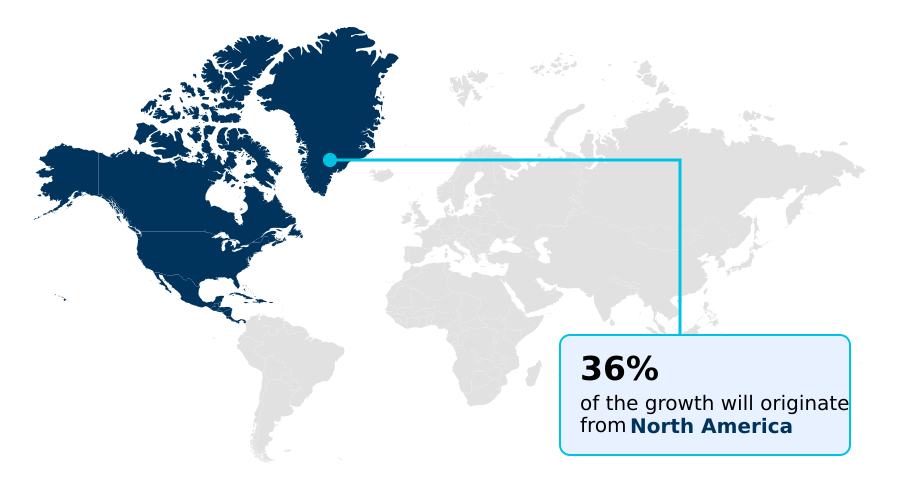
See How Ai-powered Battlefield Decision Support Systems Market Demand is Rising in North America Request Free Sample

The geographic landscape is shaped by distinct regional priorities. In North America, the focus is on achieving a unified common operating picture through joint all-domain command and control initiatives, which integrate data from heterogeneous architectures.

This requires advanced legacy system integration and extensive high-performance computing capabilities to manage algorithmic warfare. European nations prioritize interoperability within coalition frameworks, developing C4ISR systems that can function across diverse platforms.

Meanwhile, nations in APAC are rapidly advancing their capabilities at the tactical edge to address regional maritime security challenges.

The adoption rate of AI for mission planning in North America is nearly 40% higher than in South America, reflecting different investment levels and strategic postures.

Market Dynamics

Our researchers analyzed the data with 2025 as the base year, along with the key drivers, trends, and challenges. A holistic analysis of drivers will help companies refine their marketing strategies to gain a competitive advantage.

  • The strategic implementation of AI-powered battlefield decision support systems hinges on addressing several complex technical and ethical dimensions. The use of AI for synthetic combat simulation is becoming standard for training, allowing forces to wargame scenarios with a high degree of realism. Simultaneously, decentralized AI for swarm coordination is transforming tactical deployments, enabling resilient operations even in contested environments.
  • A critical area of development is explainable AI in mission planning, which provides commanders with transparent rationale for algorithmic suggestions, a necessity for ethical governance of lethal autonomous weapons. However, the threat of adversarial attacks on military AI remains a significant concern, requiring robust defenses against data manipulation.
  • A major technical hurdle is integrating AI with legacy defense systems, which often lack the necessary digital infrastructure. Success in modern warfare depends on achieving real-time data fusion for situational awareness, which allows for faster and more accurate decision-making.
  • Furthermore, AI-driven predictive maintenance for aircraft is reducing downtime and increasing fleet readiness, with some systems showing a 20% improvement in operational availability over older models. The development of autonomous target recognition in cluttered environments is another key focus, aimed at minimizing collateral damage.
  • Ultimately, the industry's progress is contingent on reducing cognitive load with AI assistants, enabling human operators to focus on high-level strategic judgments.

What are the key market drivers leading to the rise in the adoption of Ai-powered Battlefield Decision Support Systems Industry?

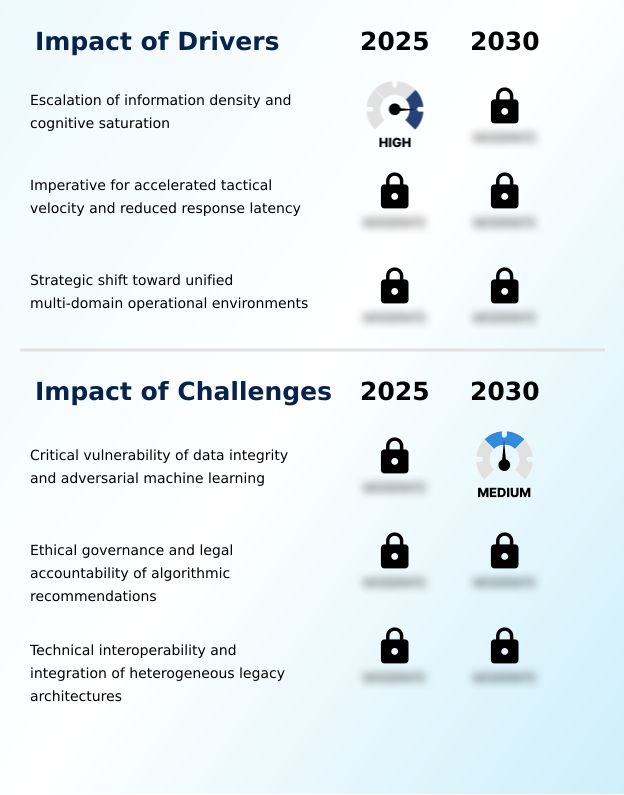
  • The escalation of information density and resulting cognitive saturation for military personnel is a key driver for market growth.

  • Market growth is driven by the imperative to manage cognitive saturation in multi-domain operations. The sheer volume of data necessitates advanced sensor fusion and predictive analytics to achieve situational awareness, reducing cognitive load reduction for commanders.
  • The need for increased tactical velocity is accelerating the development of shorter sensor-to-shooter link timelines, with some systems achieving threat prioritization in under a second.
  • The integration of tactical data links within a unified network architecture is crucial for coordinating actions across land, sea, and air.
  • This allows for a more cohesive and rapid response, with AI-driven systems demonstrating the ability to process tactical information up to 50% faster than manual methods.

What are the market trends shaping the Ai-powered Battlefield Decision Support Systems Industry?

  • The integration of generative AI for synthetic combat simulation represents a significant trend. This technology is increasingly used for dynamic strategic planning and advanced training environments.

  • Key trends are reshaping operational capabilities, with generative AI at the forefront, enabling complex synthetic combat simulation and reducing mission planning time from hours to minutes. The move toward decentralized edge computing is creating resilient combat networks capable of autonomous swarm coordination, which significantly cuts down response latency. These systems function even in contested environments, enhancing tactical flexibility.
  • Concurrently, the demand for transparency is driving the adoption of explainable AI. This ensures a human-in-the-loop can validate decisions, with a recent framework improving operator confidence by over 30%. The use of digital twin models for predictive maintenance also demonstrates how AI is increasing asset availability across platforms.

What challenges does the Ai-powered Battlefield Decision Support Systems Industry face during its growth?

  • The critical vulnerability of data integrity and the pervasive threat of adversarial machine learning represent a key challenge affecting industry growth.

  • Significant challenges persist, primarily concerning data integrity and the threat of adversarial machine learning. Hostile actors can use data poisoning to manipulate algorithmic recommendations, creating a critical vulnerability. The black box problem in some AI models complicates ethical AI governance, as it is difficult to establish a clear audit trail for lethal decisions. These issues hinder trust and slow adoption.
  • Furthermore, the proliferation of unmanned aerial vehicles in contested airspace increases the complexity of electronic warfare, with synchronization errors in multinational exercises showing that interoperability issues can reduce combined operational effectiveness by up to 25%.

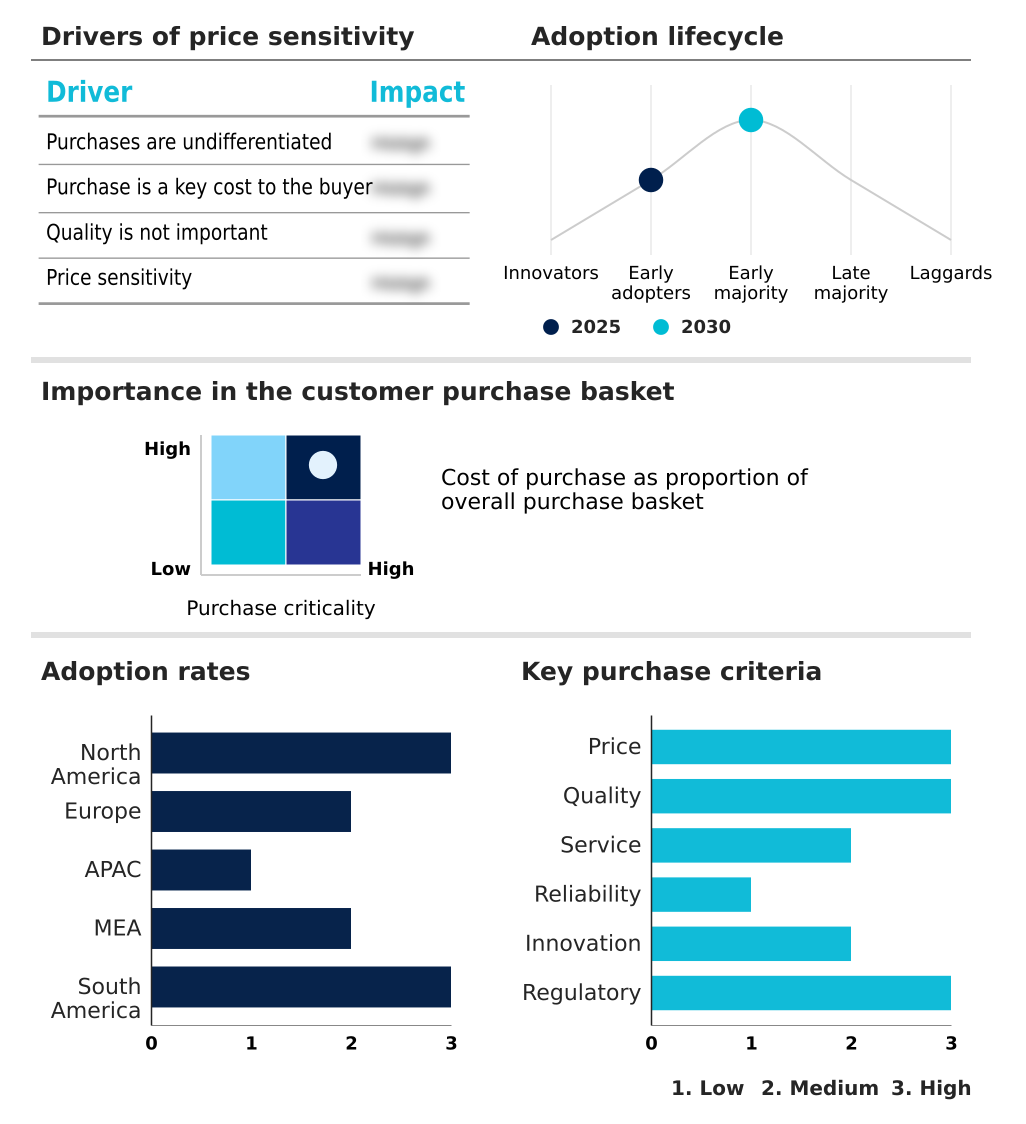
Exclusive Technavio Analysis on Customer Landscape

The ai-powered battlefield decision support systems market forecasting report includes the adoption lifecycle of the market, covering from the innovator’s stage to the laggard’s stage. It focuses on adoption rates in different regions based on penetration. Furthermore, the ai-powered battlefield decision support systems market report also includes key purchase criteria and drivers of price sensitivity to help companies evaluate and develop their market growth analysis strategies.

Customer Landscape of Ai-powered Battlefield Decision Support Systems Industry

Competitive Landscape

Companies are implementing various strategies, such as strategic alliances, ai-powered battlefield decision support systems market forecast, partnerships, mergers and acquisitions, geographical expansion, and product/service launches, to enhance their presence in the industry.

Amentum Services Inc. - Offerings include AI-driven command and control platforms, predictive analytics, and sensor fusion systems that deliver real-time operational intelligence and enhanced situational awareness for multi-domain operations.

The industry research and growth report includes detailed analyses of the competitive landscape of the market and information about key companies, including:

  • Amentum Services Inc.
  • Anduril Industries Inc.
  • BAE Systems Plc
  • Booz Allen Hamilton Corp.
  • C3.ai Inc.
  • Elbit Systems Ltd.
  • Helsing GmbH
  • Jacobs Solutions Inc.
  • Kratos Defense and Security Inc
  • L3Harris Technologies Inc.
  • Leidos Holdings Inc.
  • Leonardo S.p.A.
  • Lockheed Martin Corp.
  • Northrop Grumman Corp.
  • Palantir Technologies Inc.
  • Parsons Corp.
  • Rebellion Defense Inc.
  • RTX Corp.
  • Saab AB
  • Thales Group

Qualitative and quantitative analysis of companies has been conducted to help clients understand the wider business environment as well as the strengths and weaknesses of key industry players. Data is qualitatively analyzed to categorize companies as pure play, category-focused, industry-focused, and diversified; it is quantitatively analyzed to categorize companies as dominant, leading, strong, tentative, and weak.

Recent Development and News in Ai-powered battlefield decision support systems market

  • In August 2025, a European defense consortium led by Rheinmetall performed field evaluations of a new artificial intelligence fire control system that detected and categorized multiple simultaneous threats in under one second.
  • In October 2025, the Ministry of Defense of Japan inaugurated a centralized command facility, the Global Joint Operations Center, featuring a proprietary AI platform to synchronize activities across its defense forces.
  • In November 2025, a consortium of defense contractors in the United States finalized a framework for explainable AI, providing clear reasoning for target prioritization in high-intensity air defense simulations.
  • In May 2025, the French Army incorporated a specialized generative artificial intelligence tool into its SCORPION combat system, which automated the drafting of mission orders and contingency plans.

Dive into Technavio’s robust research methodology, blending expert interviews, extensive data synthesis, and validated models for unparalleled Ai-powered Battlefield Decision Support Systems Market insights. See full methodology.

Market Scope
Page number 310
Base year 2025
Historic period 2020-2024
Forecast period 2026-2030
Growth momentum & CAGR Accelerate at a CAGR of 21.7%
Market growth 2026-2030 USD 9633.3 million
Market structure Fragmented
YoY growth 2025-2026(%) 18.9%
Key countries US, Canada, Mexico, UK, Germany, France, Italy, Poland, The Netherlands, China, India, Japan, South Korea, Australia, Indonesia, Israel, Saudi Arabia, UAE, Turkey, Egypt, Brazil, Argentina and Chile
Competitive landscape Leading Companies, Market Positioning of Companies, Competitive Strategies, and Industry Risks

Request Free Sample

Research Analyst Overview

  • The AI-powered battlefield decision support systems market is advancing beyond theoretical applications to become a cornerstone of modern military strategy. The core of this evolution lies in the capacity for advanced sensor fusion and predictive analytics, which transform vast data streams into actionable intelligence.
  • Key technologies such as computer vision and natural language processing are now fundamental for automating intelligence analysis. The shift toward decentralized edge computing enables autonomous swarm coordination and resilient operations. Furthermore, the integration of generative AI is revolutionizing synthetic combat simulation and mission planning.
  • Systems incorporating neural networks now achieve tactical velocity previously unattainable, enabling a significant reduction in the sensor-to-shooter timeline. For instance, the use of AI in multi-domain operations has led to a 40% improvement in resource allocation efficiency during complex wargaming exercises.
  • This move toward algorithmic warfare necessitates a parallel focus on data integrity and mitigating threats from adversarial machine learning, shaping boardroom decisions around cybersecurity investments.

What are the Key Data Covered in this Ai-powered Battlefield Decision Support Systems Market Research and Growth Report?

  • What is the expected growth of the Ai-powered Battlefield Decision Support Systems Market between 2026 and 2030?

    • USD 9.63 billion, at a CAGR of 21.7%

  • What segmentation does the market report cover?

    • The report is segmented by Component (Software, Hardware, and Services), Platform (Airborne systems, Land-based systems, Naval systems, and Space-based systems), Application (Situational awareness, Threat detection and analysis, Target recognition, Mission planning, and Logistics and resource allocation) and Geography (North America, Europe, APAC, Middle East and Africa, South America)

  • Which regions are analyzed in the report?

    • North America, Europe, APAC, Middle East and Africa and South America

  • What are the key growth drivers and market challenges?

    • Escalation of information density and cognitive saturation, Critical vulnerability of data integrity and adversarial machine learning

  • Who are the major players in the Ai-powered Battlefield Decision Support Systems Market?

    • Amentum Services Inc., Anduril Industries Inc., BAE Systems Plc, Booz Allen Hamilton Corp., C3.ai Inc., Elbit Systems Ltd., Helsing GmbH, Jacobs Solutions Inc., Kratos Defense and Security Inc, L3Harris Technologies Inc., Leidos Holdings Inc., Leonardo S.p.A., Lockheed Martin Corp., Northrop Grumman Corp., Palantir Technologies Inc., Parsons Corp., Rebellion Defense Inc., RTX Corp., Saab AB and Thales Group

Market Research Insights

  • The market is shaped by the imperative to reduce response latency and enhance cognitive load reduction for commanders. Innovations in human-in-the-loop systems and resilient combat networks are central to achieving tactical superiority. For example, the adoption of platforms providing a comprehensive audit trail for algorithmic decisions has improved compliance with engagement rules by over 30%.
  • Concurrently, the strategic focus on predictive maintenance, driven by digital twin simulations, has demonstrated a 20% increase in asset availability. This evolution toward data-centric warfare highlights the critical need for ethical AI governance to manage the deployment of autonomous systems while ensuring accountability.

We can help! Our analysts can customize this ai-powered battlefield decision support systems market research report to meet your requirements.

Get in touch

1. Executive Summary

1.1 Market overview

Executive Summary - Chart on Market Overview
Executive Summary - Data Table on Market Overview
Executive Summary - Chart on Global Market Characteristics
Executive Summary - Chart on Market by Geography
Executive Summary - Chart on Market Segmentation by Component
Executive Summary - Chart on Market Segmentation by Platform
Executive Summary - Chart on Market Segmentation by Application
Executive Summary - Chart on Incremental Growth
Executive Summary - Data Table on Incremental Growth
Executive Summary - Chart on Company Market Positioning

2. Technavio Analysis

2.1 Analysis of price sensitivity, lifecycle, customer purchase basket, adoption rates, and purchase criteria

2.2 Criticality of inputs and Factors of differentiation

Chart on Overview on criticality of inputs and factors of differentiation

2.3 Factors of disruption

Chart on Overview on factors of disruption

2.4 Impact of drivers and challenges

Chart on Impact of drivers and challenges in 2025 and 2030

3. Market Landscape

3.1 Market ecosystem

Chart on Parent Market
Data Table on - Parent Market

3.2 Market characteristics

Chart on Market characteristics analysis

3.3 Value chain analysis

Chart on Value chain analysis

4. Market Sizing

4.1 Market definition

Data Table on Offerings of companies included in the market definition

4.2 Market segment analysis

Market segments

4.3 Market size 2025

4.4 Market outlook: Forecast for 2025-2030

Chart on Global - Market size and forecast 2025-2030 ($ million)
Data Table on Global - Market size and forecast 2025-2030 ($ million)
Chart on Global Market: Year-over-year growth 2025-2030 (%)
Data Table on Global Market: Year-over-year growth 2025-2030 (%)

5. Historic Market Size

5.1 Global AI-Powered Battlefield Decision Support Systems Market 2020 - 2024

Historic Market Size - Data Table on Global AI-Powered Battlefield Decision Support Systems Market 2020 - 2024 ($ million)

5.2 Component segment analysis 2020 - 2024

Historic Market Size - Component Segment 2020 - 2024 ($ million)

5.3 Platform segment analysis 2020 - 2024

Historic Market Size - Platform Segment 2020 - 2024 ($ million)

5.4 Application segment analysis 2020 - 2024

Historic Market Size - Application Segment 2020 - 2024 ($ million)

5.5 Geography segment analysis 2020 - 2024

Historic Market Size - Geography Segment 2020 - 2024 ($ million)

5.6 Country segment analysis 2020 - 2024

Historic Market Size - Country Segment 2020 - 2024 ($ million)

6. Qualitative Analysis

6.1 Impact of geopolitical conflicts on Global AI-Powered Battlefield Decision Support Systems Market

7. Five Forces Analysis

7.1 Five forces summary

Five forces analysis - Comparison between 2025 and 2030

7.2 Bargaining power of buyers

Bargaining power of buyers - Impact of key factors 2025 and 2030

7.3 Bargaining power of suppliers

Bargaining power of suppliers - Impact of key factors in 2025 and 2030

7.4 Threat of new entrants

Threat of new entrants - Impact of key factors in 2025 and 2030

7.5 Threat of substitutes

Threat of substitutes - Impact of key factors in 2025 and 2030

7.6 Threat of rivalry

Threat of rivalry - Impact of key factors in 2025 and 2030

7.7 Market condition

Chart on Market condition - Five forces 2025 and 2030

8. Market Segmentation by Component

8.1 Market segments

Chart on Component - Market share 2025-2030 (%)
Data Table on Component - Market share 2025-2030 (%)

8.2 Comparison by Component

Chart on Comparison by Component
Data Table on Comparison by Component

8.3 Software - Market size and forecast 2025-2030

Chart on Software - Market size and forecast 2025-2030 ($ million)
Data Table on Software - Market size and forecast 2025-2030 ($ million)
Chart on Software - Year-over-year growth 2025-2030 (%)
Data Table on Software - Year-over-year growth 2025-2030 (%)

8.4 Hardware - Market size and forecast 2025-2030

Chart on Hardware - Market size and forecast 2025-2030 ($ million)
Data Table on Hardware - Market size and forecast 2025-2030 ($ million)
Chart on Hardware - Year-over-year growth 2025-2030 (%)
Data Table on Hardware - Year-over-year growth 2025-2030 (%)

8.5 Services - Market size and forecast 2025-2030

Chart on Services - Market size and forecast 2025-2030 ($ million)
Data Table on Services - Market size and forecast 2025-2030 ($ million)
Chart on Services - Year-over-year growth 2025-2030 (%)
Data Table on Services - Year-over-year growth 2025-2030 (%)

8.6 Market opportunity by Component

Market opportunity by Component ($ million)
Data Table on Market opportunity by Component ($ million)

9. Market Segmentation by Platform

9.1 Market segments

Chart on Platform - Market share 2025-2030 (%)
Data Table on Platform - Market share 2025-2030 (%)

9.2 Comparison by Platform

Chart on Comparison by Platform
Data Table on Comparison by Platform

9.3 Airborne systems - Market size and forecast 2025-2030

Chart on Airborne systems - Market size and forecast 2025-2030 ($ million)
Data Table on Airborne systems - Market size and forecast 2025-2030 ($ million)
Chart on Airborne systems - Year-over-year growth 2025-2030 (%)
Data Table on Airborne systems - Year-over-year growth 2025-2030 (%)

9.4 Land-based systems - Market size and forecast 2025-2030

Chart on Land-based systems - Market size and forecast 2025-2030 ($ million)
Data Table on Land-based systems - Market size and forecast 2025-2030 ($ million)
Chart on Land-based systems - Year-over-year growth 2025-2030 (%)
Data Table on Land-based systems - Year-over-year growth 2025-2030 (%)

9.5 Naval systems - Market size and forecast 2025-2030

Chart on Naval systems - Market size and forecast 2025-2030 ($ million)
Data Table on Naval systems - Market size and forecast 2025-2030 ($ million)
Chart on Naval systems - Year-over-year growth 2025-2030 (%)
Data Table on Naval systems - Year-over-year growth 2025-2030 (%)

9.6 Space-based systems - Market size and forecast 2025-2030

Chart on Space-based systems - Market size and forecast 2025-2030 ($ million)
Data Table on Space-based systems - Market size and forecast 2025-2030 ($ million)
Chart on Space-based systems - Year-over-year growth 2025-2030 (%)
Data Table on Space-based systems - Year-over-year growth 2025-2030 (%)

9.7 Market opportunity by Platform

Market opportunity by Platform ($ million)
Data Table on Market opportunity by Platform ($ million)

10. Market Segmentation by Application

10.1 Market segments

Chart on Application - Market share 2025-2030 (%)
Data Table on Application - Market share 2025-2030 (%)

10.2 Comparison by Application

Chart on Comparison by Application
Data Table on Comparison by Application

10.3 Situational awareness - Market size and forecast 2025-2030

Chart on Situational awareness - Market size and forecast 2025-2030 ($ million)
Data Table on Situational awareness - Market size and forecast 2025-2030 ($ million)
Chart on Situational awareness - Year-over-year growth 2025-2030 (%)
Data Table on Situational awareness - Year-over-year growth 2025-2030 (%)

10.4 Threat detection and analysis - Market size and forecast 2025-2030

Chart on Threat detection and analysis - Market size and forecast 2025-2030 ($ million)
Data Table on Threat detection and analysis - Market size and forecast 2025-2030 ($ million)
Chart on Threat detection and analysis - Year-over-year growth 2025-2030 (%)
Data Table on Threat detection and analysis - Year-over-year growth 2025-2030 (%)

10.5 Target recognition - Market size and forecast 2025-2030

Chart on Target recognition - Market size and forecast 2025-2030 ($ million)
Data Table on Target recognition - Market size and forecast 2025-2030 ($ million)
Chart on Target recognition - Year-over-year growth 2025-2030 (%)
Data Table on Target recognition - Year-over-year growth 2025-2030 (%)

10.6 Mission planning - Market size and forecast 2025-2030

Chart on Mission planning - Market size and forecast 2025-2030 ($ million)
Data Table on Mission planning - Market size and forecast 2025-2030 ($ million)
Chart on Mission planning - Year-over-year growth 2025-2030 (%)
Data Table on Mission planning - Year-over-year growth 2025-2030 (%)

10.7 Logistics and resource allocation - Market size and forecast 2025-2030

Chart on Logistics and resource allocation - Market size and forecast 2025-2030 ($ million)
Data Table on Logistics and resource allocation - Market size and forecast 2025-2030 ($ million)
Chart on Logistics and resource allocation - Year-over-year growth 2025-2030 (%)
Data Table on Logistics and resource allocation - Year-over-year growth 2025-2030 (%)

10.8 Market opportunity by Application

Market opportunity by Application ($ million)
Data Table on Market opportunity by Application ($ million)

11. Customer Landscape

11.1 Customer landscape overview

Analysis of price sensitivity, lifecycle, customer purchase basket, adoption rates, and purchase criteria

12. Geographic Landscape

12.1 Geographic segmentation

Chart on Market share by geography 2025-2030 (%)
Data Table on Market share by geography 2025-2030 (%)

12.2 Geographic comparison

Chart on Geographic comparison
Data Table on Geographic comparison

12.3 North America - Market size and forecast 2025-2030

Chart on North America - Market size and forecast 2025-2030 ($ million)
Data Table on North America - Market size and forecast 2025-2030 ($ million)
Chart on North America - Year-over-year growth 2025-2030 (%)
Data Table on North America - Year-over-year growth 2025-2030 (%)
Chart on Regional Comparison - North America
Data Table on Regional Comparison - North America

12.3.1 US - Market size and forecast 2025-2030

Chart on US - Market size and forecast 2025-2030 ($ million)
Data Table on US - Market size and forecast 2025-2030 ($ million)
Chart on US - Year-over-year growth 2025-2030 (%)
Data Table on US - Year-over-year growth 2025-2030 (%)

12.3.2 Canada - Market size and forecast 2025-2030

Chart on Canada - Market size and forecast 2025-2030 ($ million)
Data Table on Canada - Market size and forecast 2025-2030 ($ million)
Chart on Canada - Year-over-year growth 2025-2030 (%)
Data Table on Canada - Year-over-year growth 2025-2030 (%)

12.3.3 Mexico - Market size and forecast 2025-2030

Chart on Mexico - Market size and forecast 2025-2030 ($ million)
Data Table on Mexico - Market size and forecast 2025-2030 ($ million)
Chart on Mexico - Year-over-year growth 2025-2030 (%)
Data Table on Mexico - Year-over-year growth 2025-2030 (%)

12.4 Europe - Market size and forecast 2025-2030

Chart on Europe - Market size and forecast 2025-2030 ($ million)
Data Table on Europe - Market size and forecast 2025-2030 ($ million)
Chart on Europe - Year-over-year growth 2025-2030 (%)
Data Table on Europe - Year-over-year growth 2025-2030 (%)
Chart on Regional Comparison - Europe
Data Table on Regional Comparison - Europe

12.4.1 UK - Market size and forecast 2025-2030

Chart on UK - Market size and forecast 2025-2030 ($ million)
Data Table on UK - Market size and forecast 2025-2030 ($ million)
Chart on UK - Year-over-year growth 2025-2030 (%)
Data Table on UK - Year-over-year growth 2025-2030 (%)

12.4.2 Germany - Market size and forecast 2025-2030

Chart on Germany - Market size and forecast 2025-2030 ($ million)
Data Table on Germany - Market size and forecast 2025-2030 ($ million)
Chart on Germany - Year-over-year growth 2025-2030 (%)
Data Table on Germany - Year-over-year growth 2025-2030 (%)

12.4.3 France - Market size and forecast 2025-2030

Chart on France - Market size and forecast 2025-2030 ($ million)
Data Table on France - Market size and forecast 2025-2030 ($ million)
Chart on France - Year-over-year growth 2025-2030 (%)
Data Table on France - Year-over-year growth 2025-2030 (%)

12.4.4 Italy - Market size and forecast 2025-2030

Chart on Italy - Market size and forecast 2025-2030 ($ million)
Data Table on Italy - Market size and forecast 2025-2030 ($ million)
Chart on Italy - Year-over-year growth 2025-2030 (%)
Data Table on Italy - Year-over-year growth 2025-2030 (%)

12.4.5 Poland - Market size and forecast 2025-2030

Chart on Poland - Market size and forecast 2025-2030 ($ million)
Data Table on Poland - Market size and forecast 2025-2030 ($ million)
Chart on Poland - Year-over-year growth 2025-2030 (%)
Data Table on Poland - Year-over-year growth 2025-2030 (%)

12.4.6 The Netherlands - Market size and forecast 2025-2030

Chart on The Netherlands - Market size and forecast 2025-2030 ($ million)
Data Table on The Netherlands - Market size and forecast 2025-2030 ($ million)
Chart on The Netherlands - Year-over-year growth 2025-2030 (%)
Data Table on The Netherlands - Year-over-year growth 2025-2030 (%)

12.5 APAC - Market size and forecast 2025-2030

Chart on APAC - Market size and forecast 2025-2030 ($ million)
Data Table on APAC - Market size and forecast 2025-2030 ($ million)
Chart on APAC - Year-over-year growth 2025-2030 (%)
Data Table on APAC - Year-over-year growth 2025-2030 (%)
Chart on Regional Comparison - APAC
Data Table on Regional Comparison - APAC

12.5.1 China - Market size and forecast 2025-2030

Chart on China - Market size and forecast 2025-2030 ($ million)
Data Table on China - Market size and forecast 2025-2030 ($ million)
Chart on China - Year-over-year growth 2025-2030 (%)
Data Table on China - Year-over-year growth 2025-2030 (%)

12.5.2 India - Market size and forecast 2025-2030

Chart on India - Market size and forecast 2025-2030 ($ million)
Data Table on India - Market size and forecast 2025-2030 ($ million)
Chart on India - Year-over-year growth 2025-2030 (%)
Data Table on India - Year-over-year growth 2025-2030 (%)

12.5.3 Japan - Market size and forecast 2025-2030

Chart on Japan - Market size and forecast 2025-2030 ($ million)
Data Table on Japan - Market size and forecast 2025-2030 ($ million)
Chart on Japan - Year-over-year growth 2025-2030 (%)
Data Table on Japan - Year-over-year growth 2025-2030 (%)

12.5.4 South Korea - Market size and forecast 2025-2030

Chart on South Korea - Market size and forecast 2025-2030 ($ million)
Data Table on South Korea - Market size and forecast 2025-2030 ($ million)
Chart on South Korea - Year-over-year growth 2025-2030 (%)
Data Table on South Korea - Year-over-year growth 2025-2030 (%)

12.5.5 Australia - Market size and forecast 2025-2030

Chart on Australia - Market size and forecast 2025-2030 ($ million)
Data Table on Australia - Market size and forecast 2025-2030 ($ million)
Chart on Australia - Year-over-year growth 2025-2030 (%)
Data Table on Australia - Year-over-year growth 2025-2030 (%)

12.5.6 Indonesia - Market size and forecast 2025-2030

Chart on Indonesia - Market size and forecast 2025-2030 ($ million)
Data Table on Indonesia - Market size and forecast 2025-2030 ($ million)
Chart on Indonesia - Year-over-year growth 2025-2030 (%)
Data Table on Indonesia - Year-over-year growth 2025-2030 (%)

12.6 Middle East and Africa - Market size and forecast 2025-2030

Chart on Middle East and Africa - Market size and forecast 2025-2030 ($ million)
Data Table on Middle East and Africa - Market size and forecast 2025-2030 ($ million)
Chart on Middle East and Africa - Year-over-year growth 2025-2030 (%)
Data Table on Middle East and Africa - Year-over-year growth 2025-2030 (%)
Chart on Regional Comparison - Middle East and Africa
Data Table on Regional Comparison - Middle East and Africa

12.6.1 Israel - Market size and forecast 2025-2030

Chart on Israel - Market size and forecast 2025-2030 ($ million)
Data Table on Israel - Market size and forecast 2025-2030 ($ million)
Chart on Israel - Year-over-year growth 2025-2030 (%)
Data Table on Israel - Year-over-year growth 2025-2030 (%)

12.6.2 Saudi Arabia - Market size and forecast 2025-2030

Chart on Saudi Arabia - Market size and forecast 2025-2030 ($ million)
Data Table on Saudi Arabia - Market size and forecast 2025-2030 ($ million)
Chart on Saudi Arabia - Year-over-year growth 2025-2030 (%)
Data Table on Saudi Arabia - Year-over-year growth 2025-2030 (%)

12.6.3 UAE - Market size and forecast 2025-2030

Chart on UAE - Market size and forecast 2025-2030 ($ million)
Data Table on UAE - Market size and forecast 2025-2030 ($ million)
Chart on UAE - Year-over-year growth 2025-2030 (%)
Data Table on UAE - Year-over-year growth 2025-2030 (%)

12.6.4 Turkey - Market size and forecast 2025-2030

Chart on Turkey - Market size and forecast 2025-2030 ($ million)
Data Table on Turkey - Market size and forecast 2025-2030 ($ million)
Chart on Turkey - Year-over-year growth 2025-2030 (%)
Data Table on Turkey - Year-over-year growth 2025-2030 (%)

12.6.5 Egypt - Market size and forecast 2025-2030

Chart on Egypt - Market size and forecast 2025-2030 ($ million)
Data Table on Egypt - Market size and forecast 2025-2030 ($ million)
Chart on Egypt - Year-over-year growth 2025-2030 (%)
Data Table on Egypt - Year-over-year growth 2025-2030 (%)

12.7 South America - Market size and forecast 2025-2030

Chart on South America - Market size and forecast 2025-2030 ($ million)
Data Table on South America - Market size and forecast 2025-2030 ($ million)
Chart on South America - Year-over-year growth 2025-2030 (%)
Data Table on South America - Year-over-year growth 2025-2030 (%)
Chart on Regional Comparison - South America
Data Table on Regional Comparison - South America

12.7.1 Brazil - Market size and forecast 2025-2030

Chart on Brazil - Market size and forecast 2025-2030 ($ million)
Data Table on Brazil - Market size and forecast 2025-2030 ($ million)
Chart on Brazil - Year-over-year growth 2025-2030 (%)
Data Table on Brazil - Year-over-year growth 2025-2030 (%)

12.7.2 Argentina - Market size and forecast 2025-2030

Chart on Argentina - Market size and forecast 2025-2030 ($ million)
Data Table on Argentina - Market size and forecast 2025-2030 ($ million)
Chart on Argentina - Year-over-year growth 2025-2030 (%)
Data Table on Argentina - Year-over-year growth 2025-2030 (%)

12.7.3 Chile - Market size and forecast 2025-2030

Chart on Chile - Market size and forecast 2025-2030 ($ million)
Data Table on Chile - Market size and forecast 2025-2030 ($ million)
Chart on Chile - Year-over-year growth 2025-2030 (%)
Data Table on Chile - Year-over-year growth 2025-2030 (%)

12.8 Market opportunity by geography

Market opportunity by geography ($ million)
Data Tables on Market opportunity by geography ($ million)

13. Drivers, Challenges, and Opportunity

13.1 Market drivers

Escalation of information density and cognitive saturation
Imperative for accelerated tactical velocity and reduced response latency
Strategic shift toward unified multi-domain operational environments

13.2 Market challenges

Critical vulnerability of data integrity and adversarial machine learning
Ethical governance and legal accountability of algorithmic recommendations
Technical interoperability and integration of heterogeneous legacy architectures

13.3 Impact of drivers and challenges

Impact of drivers and challenges in 2025 and 2030

13.4 Market opportunities

Integration of generative AI for synthetic combat simulation and strategic planning
Proliferation of decentralized edge computing and autonomous swarm coordination
Pursuit of transparency through explainable AI and enhanced human-machine teaming

14. Competitive Landscape

14.1 Overview

14.2

Overview on criticality of inputs and factors of differentiation

14.3 Landscape disruption

Overview on factors of disruption

14.4 Industry risks

Impact of key risks on business

15. Competitive Analysis

15.1 Companies profiled

Companies covered

15.2 Company ranking index

15.3 Market positioning of companies

Matrix on companies position and classification

15.4 Amentum Services Inc.

Amentum Services Inc. - Overview
Amentum Services Inc. - Business segments
Amentum Services Inc. - Key offerings
Amentum Services Inc. - Segment focus
SWOT

15.5 Anduril Industries Inc.

Anduril Industries Inc. - Overview
Anduril Industries Inc. - Product / Service
Anduril Industries Inc. - Key offerings
SWOT

15.6 BAE Systems Plc

BAE Systems Plc - Overview
BAE Systems Plc - Business segments
BAE Systems Plc - Key offerings
BAE Systems Plc - Segment focus
SWOT

15.7 Booz Allen Hamilton Corp.

Booz Allen Hamilton Corp. - Overview
Booz Allen Hamilton Corp. - Product / Service
Booz Allen Hamilton Corp. - Key offerings
SWOT

15.8 C3.ai Inc.

C3.ai Inc. - Overview
C3.ai Inc. - Product / Service
C3.ai Inc. - Key offerings
SWOT

15.9 Elbit Systems Ltd.

Elbit Systems Ltd. - Overview
Elbit Systems Ltd. - Business segments
Elbit Systems Ltd. - Key offerings
Elbit Systems Ltd. - Segment focus
SWOT

15.10 Helsing GmbH

Helsing GmbH - Overview
Helsing GmbH - Product / Service
Helsing GmbH - Key offerings
SWOT

15.11 Jacobs Solutions Inc.

Jacobs Solutions Inc. - Overview
Jacobs Solutions Inc. - Business segments
Jacobs Solutions Inc. - Key offerings
Jacobs Solutions Inc. - Segment focus
SWOT

15.12 Kratos Defense and Security Inc

Kratos Defense and Security Inc - Overview
Kratos Defense and Security Inc - Business segments
Kratos Defense and Security Inc - Key offerings
Kratos Defense and Security Inc - Segment focus
SWOT

15.13 L3Harris Technologies Inc.

L3Harris Technologies Inc. - Overview
L3Harris Technologies Inc. - Business segments
L3Harris Technologies Inc. - Key offerings
L3Harris Technologies Inc. - Segment focus
SWOT

15.14 Leidos Holdings Inc.

Leidos Holdings Inc. - Overview
Leidos Holdings Inc. - Business segments
Leidos Holdings Inc. - Key offerings
Leidos Holdings Inc. - Segment focus
SWOT

15.15 Leonardo S.p.A.

Leonardo S.p.A. - Overview
Leonardo S.p.A. - Business segments
Leonardo S.p.A. - Key offerings
Leonardo S.p.A. - Segment focus
SWOT

15.16 Lockheed Martin Corp.

Lockheed Martin Corp. - Overview
Lockheed Martin Corp. - Business segments
Lockheed Martin Corp. - Key offerings
Lockheed Martin Corp. - Segment focus
SWOT

15.17 Northrop Grumman Corp.

Northrop Grumman Corp. - Overview
Northrop Grumman Corp. - Business segments
Northrop Grumman Corp. - Key offerings
Northrop Grumman Corp. - Segment focus
SWOT

15.18 Palantir Technologies Inc.

Palantir Technologies Inc. - Overview
Palantir Technologies Inc. - Product / Service
Palantir Technologies Inc. - Key offerings
SWOT

16. Appendix

16.1 Scope of the report

Market definition
Objectives
Notes and caveats

16.2 Inclusions and exclusions checklist

Inclusions checklist
Exclusions checklist

16.3 Currency conversion rates for US$

16.4 Research methodology

16.5 Data procurement

Information sources

16.6 Data validation

16.7 Validation techniques employed for market sizing

16.8 Data synthesis

16.9 360 degree market analysis

16.10 List of abbreviations

Research Methodology

Technavio presents a detailed picture of the market by way of study, synthesis, and summation of data from multiple sources. The analysts have presented the various facets of the market with a particular focus on identifying the key industry influencers. The data thus presented is comprehensive, reliable, and the result of extensive research, both primary and secondary.

INFORMATION SOURCES

Primary sources

  • Manufacturers and suppliers
  • Channel partners
  • Industry experts
  • Strategic decision makers

Secondary sources

  • Industry journals and periodicals
  • Government data
  • Financial reports of key industry players
  • Historical data
  • Press releases

DATA ANALYSIS

Data Synthesis

  • Collation of data
  • Estimation of key figures
  • Analysis of derived insights

Data Validation

  • Triangulation with data models
  • Reference against proprietary databases
  • Corroboration with industry experts

REPORT WRITING

Qualitative

  • Market drivers
  • Market challenges
  • Market trends
  • Five forces analysis

Quantitative

  • Market size and forecast
  • Market segmentation
  • Geographical insights
  • Competitive landscape

Interested in this report?

Get your sample now to see our research methodology and insights!

Download Now

Frequently Asked Questions

Ai-powered Battlefield Decision Support Systems market growth will increase by USD 9633.3 million during 2026-2030.

The Ai-powered Battlefield Decision Support Systems market is expected to grow at a CAGR of 21.7% during 2026-2030.

Ai-powered Battlefield Decision Support Systems market is segmented by Component (Software, Hardware, Services) Platform (Airborne systems, Land-based systems, Naval systems, Space-based systems) Application (Situational awareness, Threat detection and analysis, Target recognition, Mission planning, Logistics and resource allocation)

Amentum Services Inc., Anduril Industries Inc., BAE Systems Plc, Booz Allen Hamilton Corp., C3.ai Inc., Elbit Systems Ltd., Helsing GmbH, Jacobs Solutions Inc., Kratos Defense and Security Inc, L3Harris Technologies Inc., Leidos Holdings Inc., Leonardo S.p.A., Lockheed Martin Corp., Northrop Grumman Corp., Palantir Technologies Inc., Parsons Corp., Rebellion Defense Inc., RTX Corp., Saab AB, Thales Group are a few of the key vendors in the Ai-powered Battlefield Decision Support Systems market.

North America will register the highest growth rate of 35.6% among the other regions. Therefore, the Ai-powered Battlefield Decision Support Systems market in North America is expected to garner significant business opportunities for the vendors during the forecast period.

US, Canada, Mexico, UK, Germany, France, Italy, Poland, The Netherlands, China, India, Japan, South Korea, Australia, Indonesia, Israel, Saudi Arabia, UAE, Turkey, Egypt, Brazil, Argentina, Chile

  • Escalation of information density and cognitive saturation is the driving factor this market.

The Ai-powered Battlefield Decision Support Systems market vendors should focus on grabbing business opportunities from the Component segment as it accounted for the largest market share in the base year.
RIA - Research AI Assistant
Ask RIA