AI Procurement Intelligence Market Analysis, Size, and Forecast 2025-2029: North America (US, Canada, and Mexico), Europe (Germany, UK, and France), APAC (China, Japan, and India), South America (Brazil, Argentina, and Colombia), Middle East and Africa (Saudi Arabia, UAE, and South Africa), and Rest of World (ROW)

AI Procurement Intelligence Market Analysis, Size, and Forecast 2025-2029:
North America (US, Canada, and Mexico), Europe (Germany, UK, and France), APAC (China, Japan, and India), South America (Brazil, Argentina, and Colombia), Middle East and Africa (Saudi Arabia, UAE, and South Africa), and Rest of World (ROW)

Published: Dec 2025 283 Pages SKU: IRTNTR81057

Market Overview at a Glance

$14.46 B
Market Opportunity
42.9%
CAGR 2024 - 2029
37.3%
North America Growth
$1.62 B
Software segment 2023

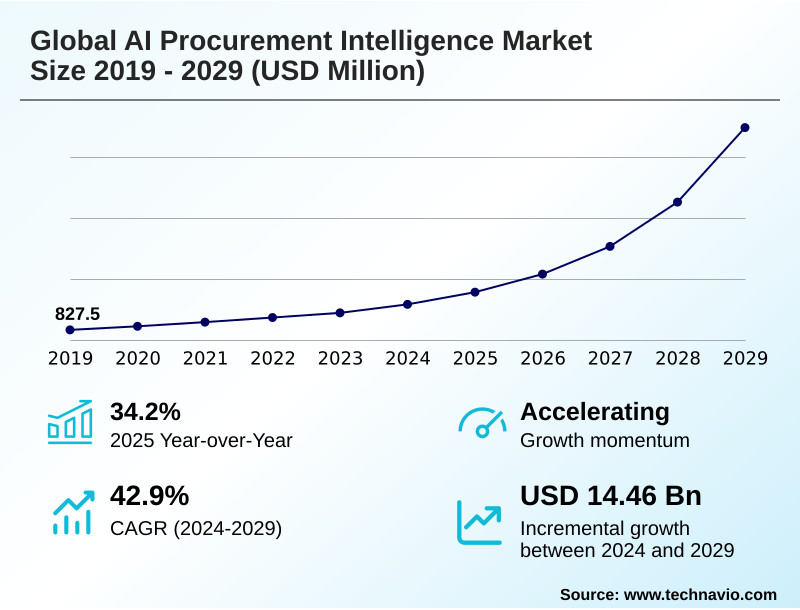
AI Procurement Intelligence Market Size 2025-2029

The ai procurement intelligence market size is valued to increase by USD 14.46 billion, at a CAGR of 42.9% from 2024 to 2029. Imperative for cost optimization and efficiency amid global economic volatility will drive the ai procurement intelligence market.

Major Market Trends & Insights

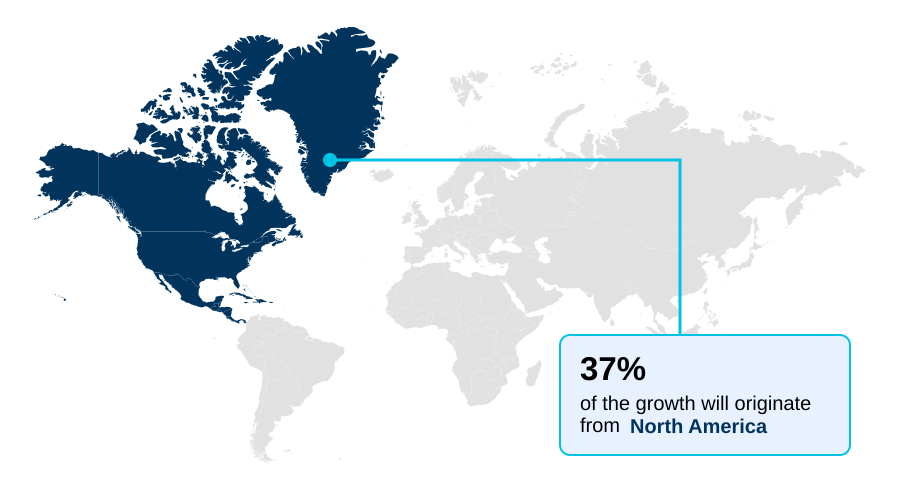
  • North America dominated the market and accounted for a 37.3% growth during the forecast period.
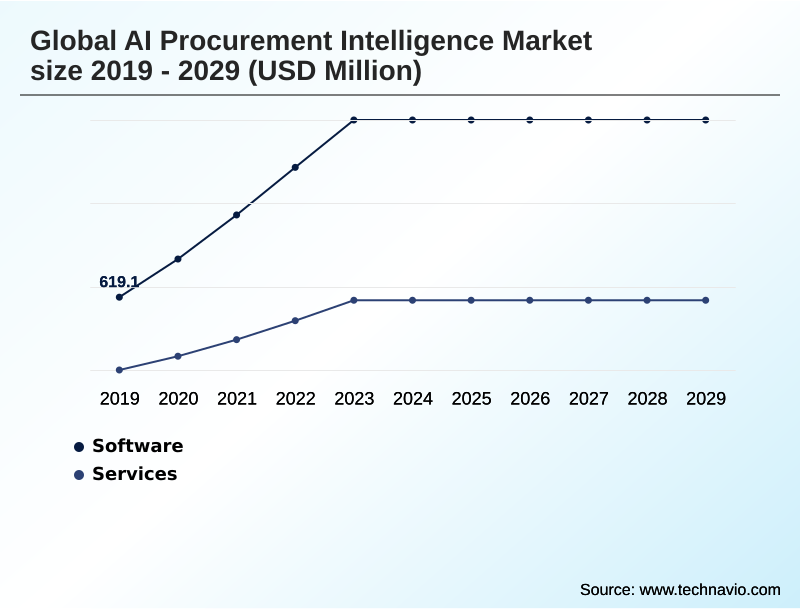
  • By Component - Software segment was valued at USD 1.62 billion in 2023
  • By Deployment - Cloud-based segment accounted for the largest market revenue share in 2023

Market Size & Forecast

  • Market Opportunities: USD 16.55 billion
  • Market Future Opportunities: USD 14.46 billion
  • CAGR from 2024 to 2029 : 42.9%

Market Summary

  • The AI procurement intelligence market is fundamentally transforming how organizations manage spend and mitigate supply chain vulnerabilities. This evolution is driven by the strategic need for greater operational efficiency and resilience in a volatile global economy. Advanced platforms leverage AI to move beyond historical analysis, offering predictive insights that empower proactive decision-making.
  • Core applications include automated spend analysis, which identifies savings opportunities, and predictive supplier risk management, which ensures continuity. For instance, a global manufacturing firm can use an AI platform to monitor signals of financial distress in a tier-two component supplier.
  • Upon receiving a predictive alert, the procurement team preemptively activates a vetted alternative supplier, seamlessly avoiding a production line stoppage that would have otherwise occurred. The integration of generative AI is further democratizing these capabilities, allowing users to query complex datasets using natural language.
  • However, the market's potential is tempered by challenges related to data fragmentation and the need for robust change management to foster adoption and trust in AI-driven recommendations.

What will be the Size of the AI Procurement Intelligence Market during the forecast period?

Get Key Insights on Market Forecast (PDF) Request Free Sample

How is the AI Procurement Intelligence Market Segmented?

The ai procurement intelligence industry research report provides comprehensive data (region-wise segment analysis), with forecasts and estimates in "USD million" for the period 2025-2029, as well as historical data from 2019-2023 for the following segments.

  • Component
    • Software
    • Services
  • Deployment
    • Cloud-based
    • On-premises
  • End-user
    • Large enterprises
    • SMEs
    • Government and public sector
  • Geography
    • North America
      • US
      • Canada
      • Mexico
    • Europe
      • Germany
      • UK
      • France
    • APAC
      • China
      • Japan
      • India
    • South America
      • Brazil
      • Argentina
      • Colombia
    • Middle East and Africa
      • Saudi Arabia
      • UAE
      • South Africa
    • Rest of World (ROW)

By Component Insights

The software segment is estimated to witness significant growth during the forecast period.

The software segment is the core of the AI procurement intelligence market, characterized by cloud-based platforms enabling data-driven decision-making. These solutions focus on hyper-automation and enhanced user experience through intuitive interfaces.

A key trend is the integration of advanced machine learning algorithms and natural language processing to deliver deeper insights. A spend analytics platform can automate spend classification with over 95% accuracy, enabling better sourcing optimization and category management.

Functionalities such as purchase requisition automation and intelligent contract abstraction are becoming standard.

This evolution toward highly intelligent, interconnected systems transforms the procurement function, moving it from a tactical role to a strategic one by leveraging sophisticated supplier data management and invoice data extraction to provide a comprehensive view of enterprise expenditures.

Request Free Sample

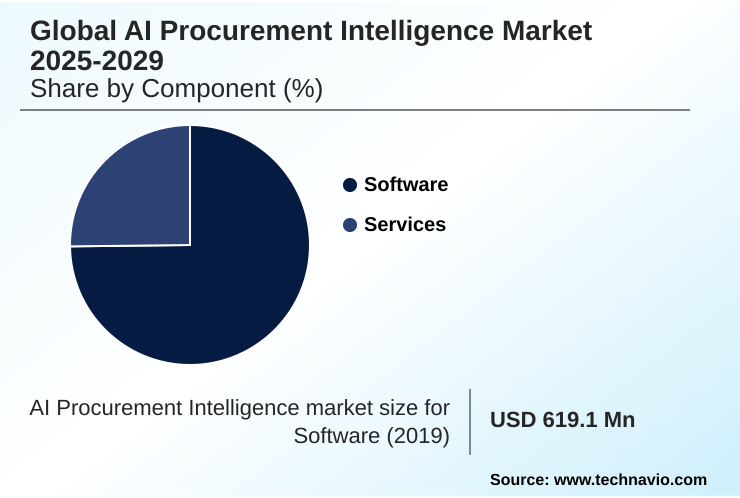
The Software segment was valued at USD 1.62 billion in 2023 and showed a gradual increase during the forecast period.

Request Free Sample

Regional Analysis

North America is estimated to contribute 37.3% to the growth of the global market during the forecast period.Technavio’s analysts have elaborately explained the regional trends and drivers that shape the market during the forecast period.

See How AI Procurement Intelligence Market Demand is Rising in North America Request Free Sample

The geographic landscape of the AI procurement intelligence market is characterized by varied maturity and growth dynamics.

North America stands as the dominant region, accounting for approximately 37% of the market's incremental growth, driven by a high concentration of technology adopters and a corporate culture focused on efficiency.

In this region, AI for direct procurement and AI for indirect procurement are well-established segments. Europe is a close second, with adoption propelled by stringent regulatory requirements.

In contrast, the APAC region is the fastest-growing market, where AI is critical for managing complex manufacturing supply chains and sourcing event automation.

South America and the Middle East and Africa are emerging regions where AI in public sector procurement is gaining traction to improve transparency and efficiency in government spending, with AI-powered demand forecasting and automated invoice processing becoming key investment areas.

Market Dynamics

Our researchers analyzed the data with 2024 as the base year, along with the key drivers, trends, and challenges. A holistic analysis of drivers will help companies refine their marketing strategies to gain a competitive advantage.

  • Enterprises are increasingly focused on comparing AI procurement intelligence platforms to identify solutions that align with strategic objectives beyond simple cost-cutting. The benefits of predictive analytics in sourcing are clear, enabling organizations to anticipate market shifts and secure resources proactively.
  • A critical use case is leveraging AI for ESG supply chain compliance, where platforms automate the monitoring of supplier ethics and sustainability metrics, a task that is unmanageable at scale through manual methods. Another significant trend is the impact of AI on tail spend management, where AI-powered negotiation and automation tools can capture value in previously unmanaged categories.
  • Organizations that have mastered automating procure-to-pay with AI report processing efficiencies more than double those of their peers still reliant on manual workflows. Key AI-driven supplier risk mitigation strategies include continuous monitoring and predictive alerts, which are essential for business continuity.
  • As teams consider the best practices for AI procurement implementation, the emphasis is on integrating AI with existing ERP systems to create a unified data ecosystem. Measuring ROI of AI in procurement involves tracking not just direct savings but also improvements in compliance and risk posture.
  • Using AI for supplier discovery and vetting accelerates onboarding, while AI-powered contract lifecycle management benefits include enhanced compliance and obligation tracking. AI tools for strategic sourcing decisions empower category managers to build resilient, cost-effective supply networks.
  • Ultimately, the successful deployment of these technologies hinges on addressing the challenges of AI adoption in procurement, including data quality and change management, and understanding the ethical considerations of AI in sourcing to ensure fairness and transparency.

What are the key market drivers leading to the rise in the adoption of AI Procurement Intelligence Industry?

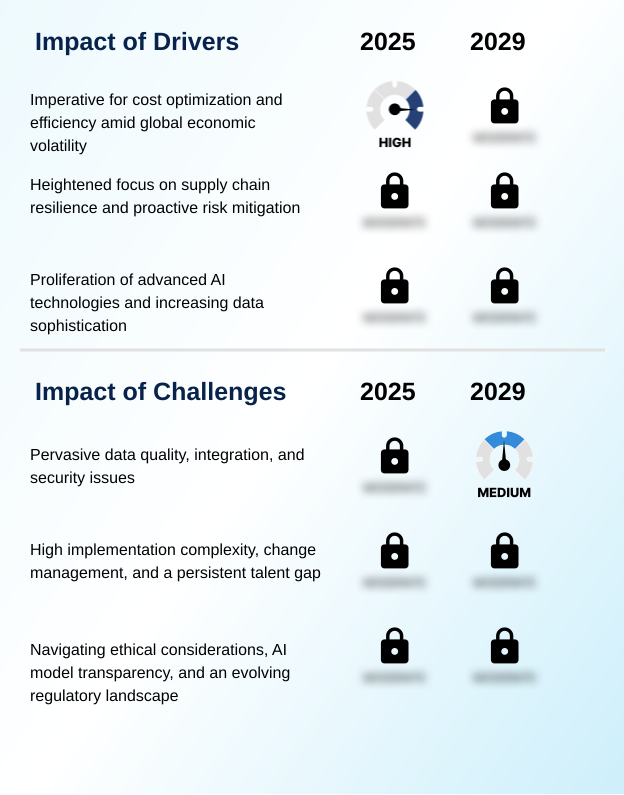
  • The imperative for cost optimization and enhanced efficiency, driven by global economic volatility, is a key driver for the market.

  • Market growth is fueled by powerful drivers, chief among them the imperative for supply chain resilience. AI-powered platforms provide predictive risk alerts that enable companies to mitigate disruptions 40% faster than traditional methods.
  • The need for enhanced spend visibility is another critical driver, with solutions that use prescriptive analytics to uncover savings opportunities and reduce maverick spend by up to 20%.
  • This digital procurement transformation is also propelled by the pressure for cost savings, where AI-driven supplier consolidation strategies deliver significant economies of scale. Furthermore, the ability of AI to provide real-time market intelligence empowers procurement teams with superior negotiating leverage.
  • These tools enhance supplier performance management and supplier risk scoring, allowing for a more strategic and data-driven approach to managing the supply base.

What are the market trends shaping the AI Procurement Intelligence Industry?

  • The proliferation of generative AI and hyper-automation in predictive sourcing is a significant upcoming trend. This evolution is reshaping procurement from a reactive process into a proactive, strategic function.

  • Key trends are reshaping the market, led by the integration of generative AI and hyper-automation. The rise of the generative AI assistant and the AI copilot for procurement is making sophisticated analytics accessible through conversational interfaces, with some platforms reducing query times by over 70%.
  • This is driving a move toward autonomous procurement, especially for tail spend automation, where AI-powered negotiation can secure an average of 5-8% more savings than manual processes. Another dominant trend is the focus on ethical sourcing, compelling organizations to adopt AI for monitoring supplier compliance.
  • This emphasis on predictive sourcing and strategic sourcing, supported by technologies that enable guided buying, is creating more resilient and responsible supply chains. Hyper-automation is accelerating this transformation by connecting disparate systems into a seamless workflow.

What challenges does the AI Procurement Intelligence Industry face during its growth?

  • Pervasive data quality, integration, and security issues represent a key challenge affecting the industry's growth trajectory.

  • Despite its potential, the market faces significant challenges, primarily centered on data integrity and implementation complexity. The lack of data enrichment and poor data quality can lead to analytical errors in over 25% of AI-driven insights, undermining user trust.
  • The 'black box' nature of some models creates a need for explainable AI (XAI) to ensure transparency in decisions related to contract analytics and procure-to-pay optimization. Integrating AI with legacy systems using robotic process automation often proves more complex than anticipated, with implementations lacking proper change management facing a 40% lower adoption rate.
  • Furthermore, ensuring ESG compliance monitoring requires deep supplier tier mapping and robust contract lifecycle management, a capability many organizations struggle to support. These challenges hinder the full realization of benefits from technologies like cognitive procurement.

Exclusive Technavio Analysis on Customer Landscape

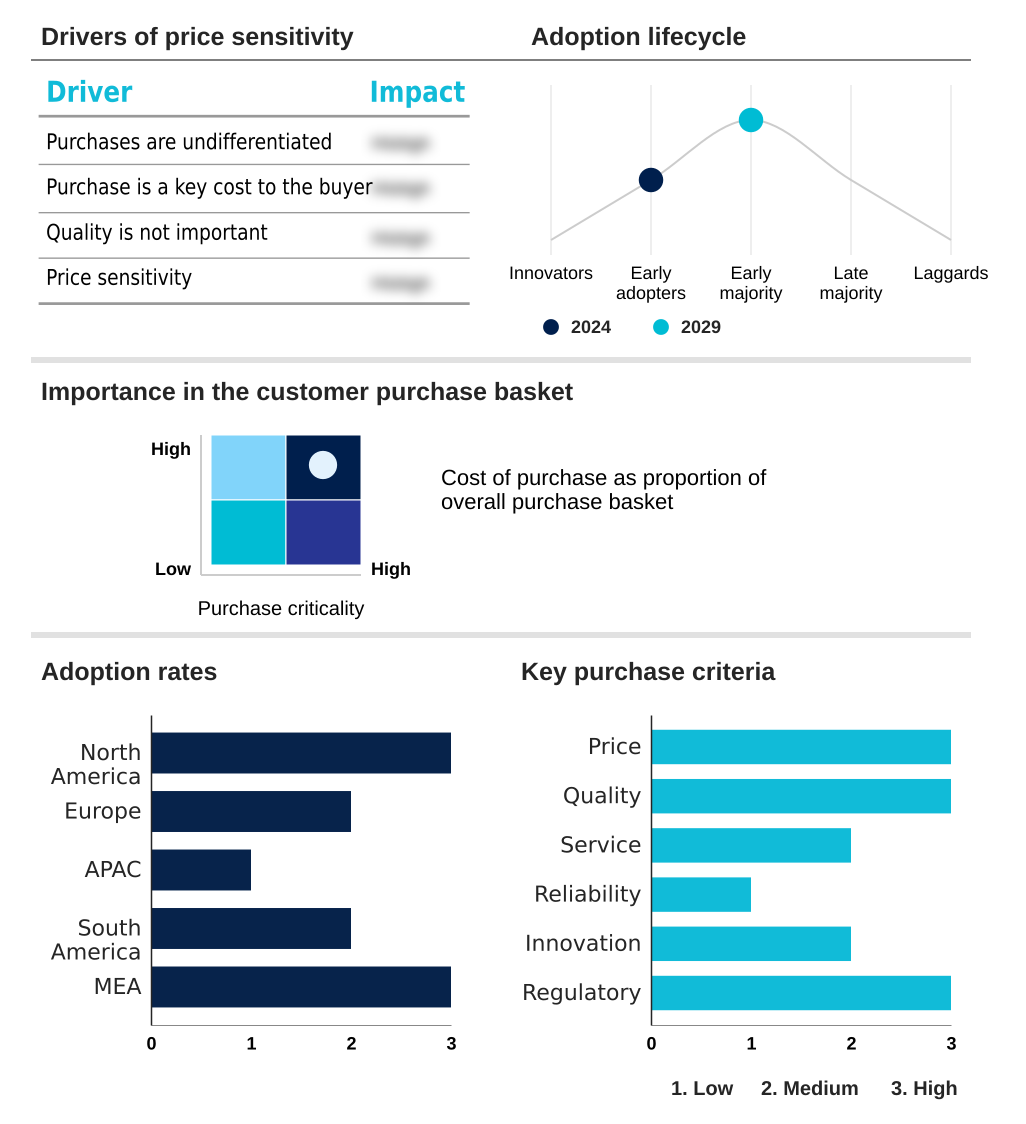
The ai procurement intelligence market forecasting report includes the adoption lifecycle of the market, covering from the innovator’s stage to the laggard’s stage. It focuses on adoption rates in different regions based on penetration. Furthermore, the ai procurement intelligence market report also includes key purchase criteria and drivers of price sensitivity to help companies evaluate and develop their market growth analysis strategies.

Customer Landscape of AI Procurement Intelligence Industry

Competitive Landscape

Companies are implementing various strategies, such as strategic alliances, ai procurement intelligence market forecast, partnerships, mergers and acquisitions, geographical expansion, and product/service launches, to enhance their presence in the industry.

Arkestro Inc - Key offerings leverage community intelligence and aggregated spend data to deliver prescriptive insights, improving spend classification and enterprise fraud detection.

The industry research and growth report includes detailed analyses of the competitive landscape of the market and information about key companies, including:

  • Arkestro Inc
  • Basware Corp.
  • Coupa Software Inc.
  • EcoVadis
  • GEP
  • Globality Inc
  • Icertis Inc.
  • Ivalua Inc.
  • JAGGAER LLC
  • Keelvar
  • Microsoft Corp.
  • Oracle Corp.
  • Pactum AI Inc
  • SAP SE
  • Scoutbee
  • Sievo
  • TealBook
  • Zycus Inc.

Qualitative and quantitative analysis of companies has been conducted to help clients understand the wider business environment as well as the strengths and weaknesses of key industry players. Data is qualitatively analyzed to categorize companies as pure play, category-focused, industry-focused, and diversified; it is quantitatively analyzed to categorize companies as dominant, leading, strong, tentative, and weak.

Recent Development and News in Ai procurement intelligence market

  • In September, 2024, Oracle Corp. announces the acquisition of a specialized AI firm focused on ESG supply chain compliance, with plans to integrate its technology into the Oracle Fusion Cloud SCM suite to enhance responsible sourcing capabilities.
  • In November, 2024, Coupa Software Inc. launches an autonomous negotiation module for tail spend, utilizing generative AI to conduct parallel negotiations with suppliers, projecting an efficiency gain in sourcing cycles by up to 30% for targeted categories.
  • In February, 2025, GEP partners with a premier climate data analytics provider to embed real-time carbon footprint tracking and reporting directly into its GEP SMART procurement platform, addressing growing client demand for sustainability metrics.
  • In April, 2025, SAP SE unveils an advanced compliance automation feature for its Ariba platform, specifically engineered to help European enterprises meet stringent supply chain due diligence regulations by using AI to continuously monitor sub-tier supplier risk.

Dive into Technavio’s robust research methodology, blending expert interviews, extensive data synthesis, and validated models for unparalleled AI Procurement Intelligence Market insights. See full methodology.

Market Scope
Page number 283
Base year 2024
Historic period 2019-2023
Forecast period 2025-2029
Growth momentum & CAGR Accelerate at a CAGR of 42.9%
Market growth 2025-2029 USD 14464.1 million
Market structure Fragmented
YoY growth 2024-2025(%) 34.2%
Key countries US, Canada, Mexico, Germany, UK, France, The Netherlands, Italy, Spain, China, Japan, India, Australia, South Korea, Indonesia, Brazil, Argentina, Colombia, Saudi Arabia, UAE, South Africa, Israel and Turkey
Competitive landscape Leading Companies, Market Positioning of Companies, Competitive Strategies, and Industry Risks

Request Free Sample

Research Analyst Overview

  • The AI procurement intelligence market is undergoing a strategic transformation, moving beyond tactical automation to become a core engine for enterprise value. This shift is driven by advancements in machine learning algorithms and natural language processing, which enable sophisticated spend classification, predictive sourcing, and cognitive procurement.
  • Platforms now offer robust supplier performance management and supplier risk scoring, which are crucial for building resilient supply chains. The integration of robotic process automation for tasks like automated invoice processing within a broader procure-to-pay optimization strategy is standard.
  • Boardroom decisions are increasingly influenced by AI-driven insights, particularly for ESG compliance, where AI tools for strategic sourcing and category management help align purchasing with corporate sustainability goals. Effective spend visibility, achieved through data enrichment and prescriptive analytics, has enabled leading firms to reduce maverick spend by over 15%.
  • The evolution includes guided buying experiences, ai-powered negotiation for tail spend automation, and enhanced supplier relationship management, with a focus on comprehensive contract analytics and efficient supplier discovery to drive competitive advantage.

What are the Key Data Covered in this AI Procurement Intelligence Market Research and Growth Report?

  • What is the expected growth of the AI Procurement Intelligence Market between 2025 and 2029?

    • USD 14.46 billion, at a CAGR of 42.9%

  • What segmentation does the market report cover?

    • The report is segmented by Component (Software, Services), Deployment (Cloud-based, On-premises), End-user (Large enterprises, SMEs, Government and public sector) and Geography (North America, Europe, APAC, South America, Middle East and Africa)

  • Which regions are analyzed in the report?

    • North America, Europe, APAC, South America and Middle East and Africa

  • What are the key growth drivers and market challenges?

    • Imperative for cost optimization and efficiency amid global economic volatility, Pervasive data quality, integration, and security issues

  • Who are the major players in the AI Procurement Intelligence Market?

    • Arkestro Inc, Basware Corp., Coupa Software Inc., EcoVadis, GEP, Globality Inc, Icertis Inc., Ivalua Inc., JAGGAER LLC, Keelvar, Microsoft Corp., Oracle Corp., Pactum AI Inc, SAP SE, Scoutbee, Sievo, TealBook and Zycus Inc.

Market Research Insights

  • The AI procurement intelligence market is defined by a dynamic interplay of technological innovation and pressing business imperatives. A strategic shift from pure cost reduction to a balanced focus on supply chain resilience is compelling organizations to adopt predictive analytics, with platforms demonstrating up to a 40% faster identification of potential disruptions.
  • The accessibility of generative AI is democratizing data analysis, enabling procurement teams to achieve an 80% reduction in time spent on routine data queries. This digital procurement transformation is not uniform; while large enterprises were early adopters, cloud-based models have lowered entry barriers, leading to a 25% increase in adoption among mid-sized firms over the past two years.
  • This evolution highlights a move toward more agile, data-centric procurement functions capable of navigating economic uncertainty and leveraging real-time market intelligence.

We can help! Our analysts can customize this ai procurement intelligence market research report to meet your requirements.

Get in touch

1. Executive Summary

1.1 Market overview

Executive Summary - Chart on Market Overview
Executive Summary - Data Table on Market Overview
Executive Summary - Chart on Global Market Characteristics
Executive Summary - Chart on Market by Geography
Executive Summary - Chart on Market Segmentation by Component
Executive Summary - Chart on Market Segmentation by Deployment
Executive Summary - Chart on Market Segmentation by End-user
Executive Summary - Chart on Incremental Growth
Executive Summary - Data Table on Incremental Growth
Executive Summary - Chart on Company Market Positioning

2. Technavio Analysis

2.1 Analysis of price sensitivity, lifecycle, customer purchase basket, adoption rates, and purchase criteria

2.2 Criticality of inputs and Factors of differentiation

Chart on Overview on criticality of inputs and factors of differentiation

2.3 Factors of disruption

Chart on Overview on factors of disruption

2.4 Impact of drivers and challenges

Chart on Impact of drivers and challenges in 2024 and 2029

3. Market Landscape

3.1 Market ecosystem

Chart on Parent Market
Data Table on - Parent Market

3.2 Market characteristics

Chart on Market characteristics analysis

3.3 Value chain analysis

Chart on Value chain analysis

4. Market Sizing

4.1 Market definition

Data Table on Offerings of companies included in the market definition

4.2 Market segment analysis

Market segments

4.3 Market size 2024

4.4 Market outlook: Forecast for 2024-2029

Chart on Global - Market size and forecast 2024-2029 ($ million)
Data Table on Global - Market size and forecast 2024-2029 ($ million)
Chart on Global Market: Year-over-year growth 2024-2029 (%)
Data Table on Global Market: Year-over-year growth 2024-2029 (%)

5. Historic Market Size

5.1 Global AI Procurement Intelligence Market 2019 - 2023

Historic Market Size - Data Table on Global AI Procurement Intelligence Market 2019 - 2023 ($ million)

5.2 Component segment analysis 2019 - 2023

Historic Market Size - Component Segment 2019 - 2023 ($ million)

5.3 Deployment segment analysis 2019 - 2023

Historic Market Size - Deployment Segment 2019 - 2023 ($ million)

5.4 End-user segment analysis 2019 - 2023

Historic Market Size - End-user Segment 2019 - 2023 ($ million)

5.5 Geography segment analysis 2019 - 2023

Historic Market Size - Geography Segment 2019 - 2023 ($ million)

5.6 Country segment analysis 2019 - 2023

Historic Market Size - Country Segment 2019 - 2023 ($ million)

6. Five Forces Analysis

6.1 Five forces summary

Five forces analysis - Comparison between 2024 and 2029

6.2 Bargaining power of buyers

Bargaining power of buyers - Impact of key factors 2024 and 2029

6.3 Bargaining power of suppliers

Bargaining power of suppliers - Impact of key factors in 2024 and 2029

6.4 Threat of new entrants

Threat of new entrants - Impact of key factors in 2024 and 2029

6.5 Threat of substitutes

Threat of substitutes - Impact of key factors in 2024 and 2029

6.6 Threat of rivalry

Threat of rivalry - Impact of key factors in 2024 and 2029

6.7 Market condition

Chart on Market condition - Five forces 2024 and 2029

7. Market Segmentation by Component

7.1 Market segments

Chart on Component - Market share 2024-2029 (%)
Data Table on Component - Market share 2024-2029 (%)

7.2 Comparison by Component

Chart on Comparison by Component
Data Table on Comparison by Component

7.3 Software - Market size and forecast 2024-2029

Chart on Software - Market size and forecast 2024-2029 ($ million)
Data Table on Software - Market size and forecast 2024-2029 ($ million)
Chart on Software - Year-over-year growth 2024-2029 (%)
Data Table on Software - Year-over-year growth 2024-2029 (%)

7.4 Services - Market size and forecast 2024-2029

Chart on Services - Market size and forecast 2024-2029 ($ million)
Data Table on Services - Market size and forecast 2024-2029 ($ million)
Chart on Services - Year-over-year growth 2024-2029 (%)
Data Table on Services - Year-over-year growth 2024-2029 (%)

7.5 Market opportunity by Component

Market opportunity by Component ($ million)
Data Table on Market opportunity by Component ($ million)

8. Market Segmentation by Deployment

8.1 Market segments

Chart on Deployment - Market share 2024-2029 (%)
Data Table on Deployment - Market share 2024-2029 (%)

8.2 Comparison by Deployment

Chart on Comparison by Deployment
Data Table on Comparison by Deployment

8.3 Cloud-based - Market size and forecast 2024-2029

Chart on Cloud-based - Market size and forecast 2024-2029 ($ million)
Data Table on Cloud-based - Market size and forecast 2024-2029 ($ million)
Chart on Cloud-based - Year-over-year growth 2024-2029 (%)
Data Table on Cloud-based - Year-over-year growth 2024-2029 (%)

8.4 On-premises - Market size and forecast 2024-2029

Chart on On-premises - Market size and forecast 2024-2029 ($ million)
Data Table on On-premises - Market size and forecast 2024-2029 ($ million)
Chart on On-premises - Year-over-year growth 2024-2029 (%)
Data Table on On-premises - Year-over-year growth 2024-2029 (%)

8.5 Market opportunity by Deployment

Market opportunity by Deployment ($ million)
Data Table on Market opportunity by Deployment ($ million)

9. Market Segmentation by End-user

9.1 Market segments

Chart on End-user - Market share 2024-2029 (%)
Data Table on End-user - Market share 2024-2029 (%)

9.2 Comparison by End-user

Chart on Comparison by End-user
Data Table on Comparison by End-user

9.3 Large enterprises - Market size and forecast 2024-2029

Chart on Large enterprises - Market size and forecast 2024-2029 ($ million)
Data Table on Large enterprises - Market size and forecast 2024-2029 ($ million)
Chart on Large enterprises - Year-over-year growth 2024-2029 (%)
Data Table on Large enterprises - Year-over-year growth 2024-2029 (%)

9.4 SMEs - Market size and forecast 2024-2029

Chart on SMEs - Market size and forecast 2024-2029 ($ million)
Data Table on SMEs - Market size and forecast 2024-2029 ($ million)
Chart on SMEs - Year-over-year growth 2024-2029 (%)
Data Table on SMEs - Year-over-year growth 2024-2029 (%)

9.5 Government and public sector - Market size and forecast 2024-2029

Chart on Government and public sector - Market size and forecast 2024-2029 ($ million)
Data Table on Government and public sector - Market size and forecast 2024-2029 ($ million)
Chart on Government and public sector - Year-over-year growth 2024-2029 (%)
Data Table on Government and public sector - Year-over-year growth 2024-2029 (%)

9.6 Market opportunity by End-user

Market opportunity by End-user ($ million)
Data Table on Market opportunity by End-user ($ million)

10. Customer Landscape

10.1 Customer landscape overview

Analysis of price sensitivity, lifecycle, customer purchase basket, adoption rates, and purchase criteria

11. Geographic Landscape

11.1 Geographic segmentation

Chart on Market share by geography 2024-2029 (%)
Data Table on Market share by geography 2024-2029 (%)

11.2 Geographic comparison

Chart on Geographic comparison
Data Table on Geographic comparison

11.3 North America - Market size and forecast 2024-2029

Chart on North America - Market size and forecast 2024-2029 ($ million)
Data Table on North America - Market size and forecast 2024-2029 ($ million)
Chart on North America - Year-over-year growth 2024-2029 (%)
Data Table on North America - Year-over-year growth 2024-2029 (%)
Chart on Regional Comparison - North America
Data Table on Regional Comparison - North America

11.3.1 US - Market size and forecast 2024-2029

Chart on US - Market size and forecast 2024-2029 ($ million)
Data Table on US - Market size and forecast 2024-2029 ($ million)
Chart on US - Year-over-year growth 2024-2029 (%)
Data Table on US - Year-over-year growth 2024-2029 (%)

11.3.2 Canada - Market size and forecast 2024-2029

Chart on Canada - Market size and forecast 2024-2029 ($ million)
Data Table on Canada - Market size and forecast 2024-2029 ($ million)
Chart on Canada - Year-over-year growth 2024-2029 (%)
Data Table on Canada - Year-over-year growth 2024-2029 (%)

11.3.3 Mexico - Market size and forecast 2024-2029

Chart on Mexico - Market size and forecast 2024-2029 ($ million)
Data Table on Mexico - Market size and forecast 2024-2029 ($ million)
Chart on Mexico - Year-over-year growth 2024-2029 (%)
Data Table on Mexico - Year-over-year growth 2024-2029 (%)

11.4 Europe - Market size and forecast 2024-2029

Chart on Europe - Market size and forecast 2024-2029 ($ million)
Data Table on Europe - Market size and forecast 2024-2029 ($ million)
Chart on Europe - Year-over-year growth 2024-2029 (%)
Data Table on Europe - Year-over-year growth 2024-2029 (%)
Chart on Regional Comparison - Europe
Data Table on Regional Comparison - Europe

11.4.1 Germany - Market size and forecast 2024-2029

Chart on Germany - Market size and forecast 2024-2029 ($ million)
Data Table on Germany - Market size and forecast 2024-2029 ($ million)
Chart on Germany - Year-over-year growth 2024-2029 (%)
Data Table on Germany - Year-over-year growth 2024-2029 (%)

11.4.2 UK - Market size and forecast 2024-2029

Chart on UK - Market size and forecast 2024-2029 ($ million)
Data Table on UK - Market size and forecast 2024-2029 ($ million)
Chart on UK - Year-over-year growth 2024-2029 (%)
Data Table on UK - Year-over-year growth 2024-2029 (%)

11.4.3 France - Market size and forecast 2024-2029

Chart on France - Market size and forecast 2024-2029 ($ million)
Data Table on France - Market size and forecast 2024-2029 ($ million)
Chart on France - Year-over-year growth 2024-2029 (%)
Data Table on France - Year-over-year growth 2024-2029 (%)

11.4.4 The Netherlands - Market size and forecast 2024-2029

Chart on The Netherlands - Market size and forecast 2024-2029 ($ million)
Data Table on The Netherlands - Market size and forecast 2024-2029 ($ million)
Chart on The Netherlands - Year-over-year growth 2024-2029 (%)
Data Table on The Netherlands - Year-over-year growth 2024-2029 (%)

11.4.5 Italy - Market size and forecast 2024-2029

Chart on Italy - Market size and forecast 2024-2029 ($ million)
Data Table on Italy - Market size and forecast 2024-2029 ($ million)
Chart on Italy - Year-over-year growth 2024-2029 (%)
Data Table on Italy - Year-over-year growth 2024-2029 (%)

11.4.6 Spain - Market size and forecast 2024-2029

Chart on Spain - Market size and forecast 2024-2029 ($ million)
Data Table on Spain - Market size and forecast 2024-2029 ($ million)
Chart on Spain - Year-over-year growth 2024-2029 (%)
Data Table on Spain - Year-over-year growth 2024-2029 (%)

11.5 APAC - Market size and forecast 2024-2029

Chart on APAC - Market size and forecast 2024-2029 ($ million)
Data Table on APAC - Market size and forecast 2024-2029 ($ million)
Chart on APAC - Year-over-year growth 2024-2029 (%)
Data Table on APAC - Year-over-year growth 2024-2029 (%)
Chart on Regional Comparison - APAC
Data Table on Regional Comparison - APAC

11.5.1 China - Market size and forecast 2024-2029

Chart on China - Market size and forecast 2024-2029 ($ million)
Data Table on China - Market size and forecast 2024-2029 ($ million)
Chart on China - Year-over-year growth 2024-2029 (%)
Data Table on China - Year-over-year growth 2024-2029 (%)

11.5.2 Japan - Market size and forecast 2024-2029

Chart on Japan - Market size and forecast 2024-2029 ($ million)
Data Table on Japan - Market size and forecast 2024-2029 ($ million)
Chart on Japan - Year-over-year growth 2024-2029 (%)
Data Table on Japan - Year-over-year growth 2024-2029 (%)

11.5.3 India - Market size and forecast 2024-2029

Chart on India - Market size and forecast 2024-2029 ($ million)
Data Table on India - Market size and forecast 2024-2029 ($ million)
Chart on India - Year-over-year growth 2024-2029 (%)
Data Table on India - Year-over-year growth 2024-2029 (%)

11.5.4 Australia - Market size and forecast 2024-2029

Chart on Australia - Market size and forecast 2024-2029 ($ million)
Data Table on Australia - Market size and forecast 2024-2029 ($ million)
Chart on Australia - Year-over-year growth 2024-2029 (%)
Data Table on Australia - Year-over-year growth 2024-2029 (%)

11.5.5 South Korea - Market size and forecast 2024-2029

Chart on South Korea - Market size and forecast 2024-2029 ($ million)
Data Table on South Korea - Market size and forecast 2024-2029 ($ million)
Chart on South Korea - Year-over-year growth 2024-2029 (%)
Data Table on South Korea - Year-over-year growth 2024-2029 (%)

11.5.6 Indonesia - Market size and forecast 2024-2029

Chart on Indonesia - Market size and forecast 2024-2029 ($ million)
Data Table on Indonesia - Market size and forecast 2024-2029 ($ million)
Chart on Indonesia - Year-over-year growth 2024-2029 (%)
Data Table on Indonesia - Year-over-year growth 2024-2029 (%)

11.6 South America - Market size and forecast 2024-2029

Chart on South America - Market size and forecast 2024-2029 ($ million)
Data Table on South America - Market size and forecast 2024-2029 ($ million)
Chart on South America - Year-over-year growth 2024-2029 (%)
Data Table on South America - Year-over-year growth 2024-2029 (%)
Chart on Regional Comparison - South America
Data Table on Regional Comparison - South America

11.6.1 Brazil - Market size and forecast 2024-2029

Chart on Brazil - Market size and forecast 2024-2029 ($ million)
Data Table on Brazil - Market size and forecast 2024-2029 ($ million)
Chart on Brazil - Year-over-year growth 2024-2029 (%)
Data Table on Brazil - Year-over-year growth 2024-2029 (%)

11.6.2 Argentina - Market size and forecast 2024-2029

Chart on Argentina - Market size and forecast 2024-2029 ($ million)
Data Table on Argentina - Market size and forecast 2024-2029 ($ million)
Chart on Argentina - Year-over-year growth 2024-2029 (%)
Data Table on Argentina - Year-over-year growth 2024-2029 (%)

11.6.3 Colombia - Market size and forecast 2024-2029

Chart on Colombia - Market size and forecast 2024-2029 ($ million)
Data Table on Colombia - Market size and forecast 2024-2029 ($ million)
Chart on Colombia - Year-over-year growth 2024-2029 (%)
Data Table on Colombia - Year-over-year growth 2024-2029 (%)

11.7 Middle East and Africa - Market size and forecast 2024-2029

Chart on Middle East and Africa - Market size and forecast 2024-2029 ($ million)
Data Table on Middle East and Africa - Market size and forecast 2024-2029 ($ million)
Chart on Middle East and Africa - Year-over-year growth 2024-2029 (%)
Data Table on Middle East and Africa - Year-over-year growth 2024-2029 (%)
Chart on Regional Comparison - Middle East and Africa
Data Table on Regional Comparison - Middle East and Africa

11.7.1 Saudi Arabia - Market size and forecast 2024-2029

Chart on Saudi Arabia - Market size and forecast 2024-2029 ($ million)
Data Table on Saudi Arabia - Market size and forecast 2024-2029 ($ million)
Chart on Saudi Arabia - Year-over-year growth 2024-2029 (%)
Data Table on Saudi Arabia - Year-over-year growth 2024-2029 (%)

11.7.2 UAE - Market size and forecast 2024-2029

Chart on UAE - Market size and forecast 2024-2029 ($ million)
Data Table on UAE - Market size and forecast 2024-2029 ($ million)
Chart on UAE - Year-over-year growth 2024-2029 (%)
Data Table on UAE - Year-over-year growth 2024-2029 (%)

11.7.3 South Africa - Market size and forecast 2024-2029

Chart on South Africa - Market size and forecast 2024-2029 ($ million)
Data Table on South Africa - Market size and forecast 2024-2029 ($ million)
Chart on South Africa - Year-over-year growth 2024-2029 (%)
Data Table on South Africa - Year-over-year growth 2024-2029 (%)

11.7.4 Israel - Market size and forecast 2024-2029

Chart on Israel - Market size and forecast 2024-2029 ($ million)
Data Table on Israel - Market size and forecast 2024-2029 ($ million)
Chart on Israel - Year-over-year growth 2024-2029 (%)
Data Table on Israel - Year-over-year growth 2024-2029 (%)

11.7.5 Turkey - Market size and forecast 2024-2029

Chart on Turkey - Market size and forecast 2024-2029 ($ million)
Data Table on Turkey - Market size and forecast 2024-2029 ($ million)
Chart on Turkey - Year-over-year growth 2024-2029 (%)
Data Table on Turkey - Year-over-year growth 2024-2029 (%)

11.8 Market opportunity by geography

Market opportunity by geography ($ million)
Data Tables on Market opportunity by geography ($ million)

12. Drivers, Challenges, and Opportunity

12.1 Market drivers

Imperative for cost optimization and efficiency amid global economic volatility
Heightened focus on supply chain resilience and proactive risk mitigation
Proliferation of advanced AI technologies and increasing data sophistication

12.2 Market challenges

Pervasive data quality, integration, and security issues
High implementation complexity, change management, and a persistent talent gap
Navigating ethical considerations, AI model transparency, and an evolving regulatory landscape

12.3 Impact of drivers and challenges

Impact of drivers and challenges in 2024 and 2029

12.4 Market opportunities

Proliferation of generative AI and hyper-automation in predictive sourcing
Heightened emphasis on AI-driven ESG monitoring and supply chain resilience
Evolution toward AI-centric supplier relationship management and proactive risk mitigation

13. Competitive Landscape

13.1 Overview

13.2

Overview on criticality of inputs and factors of differentiation

13.3 Landscape disruption

Overview on factors of disruption

13.4 Industry risks

Impact of key risks on business

14. Competitive Analysis

14.1 Companies profiled

Companies covered

14.2 Company ranking index

14.3 Market positioning of companies

Matrix on companies position and classification

14.4 Basware Corp.

Basware Corp. - Overview
Basware Corp. - Product / Service
Basware Corp. - Key offerings
SWOT

14.5 Coupa Software Inc.

Coupa Software Inc. - Overview
Coupa Software Inc. - Product / Service
Coupa Software Inc. - Key offerings
SWOT

14.6 EcoVadis

EcoVadis - Overview
EcoVadis - Product / Service
EcoVadis - Key offerings
SWOT

14.7 GEP

GEP - Overview
GEP - Product / Service
GEP - Key offerings
SWOT

14.8 Ivalua Inc.

Ivalua Inc. - Overview
Ivalua Inc. - Product / Service
Ivalua Inc. - Key offerings
SWOT

14.9 JAGGAER LLC

JAGGAER LLC - Overview
JAGGAER LLC - Product / Service
JAGGAER LLC - Key offerings
SWOT

14.10 Keelvar

Keelvar - Overview
Keelvar - Product / Service
Keelvar - Key offerings
SWOT

14.11 Microsoft Corp.

Microsoft Corp. - Overview
Microsoft Corp. - Business segments
Microsoft Corp. - Key news
Microsoft Corp. - Key offerings
Microsoft Corp. - Segment focus
SWOT

14.12 Oracle Corp.

Oracle Corp. - Overview
Oracle Corp. - Business segments
Oracle Corp. - Key news
Oracle Corp. - Key offerings
Oracle Corp. - Segment focus
SWOT

14.13 Pactum AI Inc

Pactum AI Inc - Overview
Pactum AI Inc - Product / Service
Pactum AI Inc - Key offerings
SWOT

14.14 SAP SE

SAP SE - Overview
SAP SE - Business segments
SAP SE - Key news
SAP SE - Key offerings
SAP SE - Segment focus
SWOT

14.15 Scoutbee

Scoutbee - Overview
Scoutbee - Product / Service
Scoutbee - Key offerings
SWOT

14.16 Sievo

Sievo - Overview
Sievo - Product / Service
Sievo - Key offerings
SWOT

14.17 TealBook

TealBook - Overview
TealBook - Product / Service
TealBook - Key offerings
SWOT

14.18 Zycus Inc.

Zycus Inc. - Overview
Zycus Inc. - Product / Service
Zycus Inc. - Key offerings
SWOT

15. Appendix

15.1 Scope of the report

Market definition
Objectives
Notes and caveats

15.2 Inclusions and exclusions checklist

Inclusions checklist
Exclusions checklist

15.3 Currency conversion rates for US$

15.4 Research methodology

15.5 Data procurement

Information sources

15.6 Data validation

15.7 Validation techniques employed for market sizing

15.8 Data synthesis

15.9 360 degree market analysis

15.10 List of abbreviations

Research Methodology

Technavio presents a detailed picture of the market by way of study, synthesis, and summation of data from multiple sources. The analysts have presented the various facets of the market with a particular focus on identifying the key industry influencers. The data thus presented is comprehensive, reliable, and the result of extensive research, both primary and secondary.

INFORMATION SOURCES

Primary sources

  • Manufacturers and suppliers
  • Channel partners
  • Industry experts
  • Strategic decision makers

Secondary sources

  • Industry journals and periodicals
  • Government data
  • Financial reports of key industry players
  • Historical data
  • Press releases

DATA ANALYSIS

Data Synthesis

  • Collation of data
  • Estimation of key figures
  • Analysis of derived insights

Data Validation

  • Triangulation with data models
  • Reference against proprietary databases
  • Corroboration with industry experts

REPORT WRITING

Qualitative

  • Market drivers
  • Market challenges
  • Market trends
  • Five forces analysis

Quantitative

  • Market size and forecast
  • Market segmentation
  • Geographical insights
  • Competitive landscape

Interested in this report?

Get your sample now to see our research methodology and insights!

Download Now

Frequently Asked Questions

AI Procurement Intelligence market growth will increase by USD 14464.1 million during 2025-2029.

The AI Procurement Intelligence market is expected to grow at a CAGR of 42.9% during 2025-2029.

AI Procurement Intelligence market is segmented by Component (Software, Services) Deployment (Cloud-based, On-premises) End-user (Large enterprises, SMEs, Government and public sector)

Arkestro Inc, Basware Corp., Coupa Software Inc., EcoVadis, GEP, Globality Inc, Icertis Inc., Ivalua Inc., JAGGAER LLC, Keelvar, Microsoft Corp., Oracle Corp., Pactum AI Inc, SAP SE, Scoutbee, Sievo, TealBook, Zycus Inc. are a few of the key vendors in the AI Procurement Intelligence market.

North America will register the highest growth rate of 37.3% among the other regions. Therefore, the AI Procurement Intelligence market in North America is expected to garner significant business opportunities for the vendors during the forecast period.

US, Canada, Mexico, Germany, UK, France, The Netherlands, Italy, Spain, China, Japan, India, Australia, South Korea, Indonesia, Brazil, Argentina, Colombia, Saudi Arabia, UAE, South Africa, Israel, Turkey

  • Imperative for cost optimization and efficiency amid global economic volatility is the driving factor this market.

The AI Procurement Intelligence market vendors should focus on grabbing business opportunities from the Component segment as it accounted for the largest market share in the base year.