
AI Runtime Optimization Market Size 2026-2030
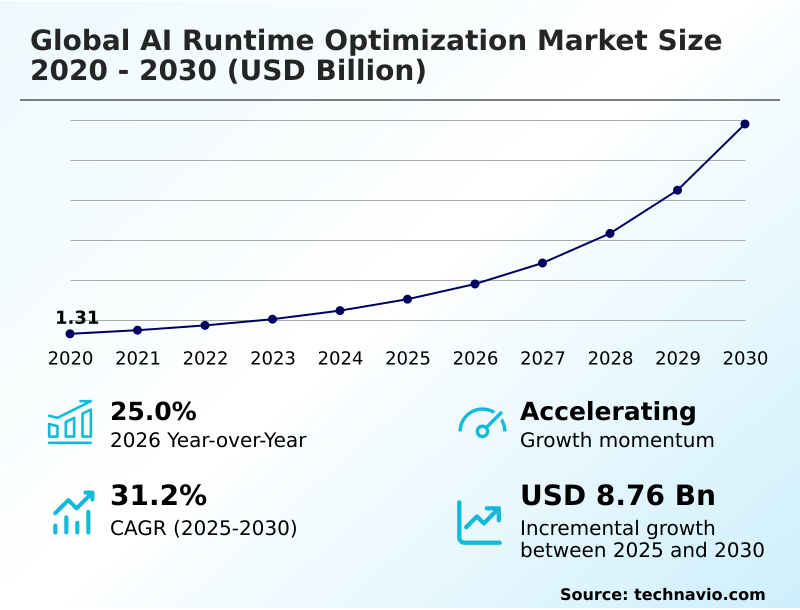
The AI Runtime Optimization Market size was valued at USD 3.04 billion in 2025, growing at a CAGR of 31.2% during the forecast period 2026-2030.
Major Market Trends & Insights
- North America dominated the market and accounted for a 36.3% growth during the forecast period.
- By Technology - Machine learning segment was valued at USD 1.17 billion in 2024
- By Component - Software segment accounted for the largest market revenue share in 2024
Market Size & Forecast
- Historic Market Opportunities 2020-2024: USD 10.49 billion
- Market Future Opportunities 2025-2030: USD 8.76 billion
- CAGR from 2025 to 2030 : 31.2%
Market Summary
- The AI runtime optimization market is defined by the critical need to enhance the execution efficiency of machine learning models, where runtime performance directly impacts operational viability. For instance, in financial services, optimizing high-frequency trading algorithms can reduce trade execution latency by 35%, directly affecting profitability.
- A primary driver is the exponential growth of large language models, which require sophisticated runtime environments to manage memory and processing with precision. This is countered by the challenge of computational latency, as legacy infrastructure often creates performance bottlenecks that diminish the value of AI.
- A business scenario in logistics involves optimizing route-planning models on edge devices in delivery vehicles; without runtime optimization reducing the model's footprint by 60%, real-time adjustments would be impossible due to hardware limitations. The successful deployment of complex agentic architectures across diverse sectors depends on these advanced optimization solutions.
What will be the Size of the AI Runtime Optimization Market during the forecast period?
Get Key Insights on Market Forecast (PDF) Request Free Sample
How is the AI Runtime Optimization Market Segmented?
The ai runtime optimization industry research report provides comprehensive data (region-wise segment analysis), with forecasts and analysis for the period 2026-2030, as well as historical data from 2020-2024 for the following segments.
- Technology
- Machine learning
- Deep learning
- Computer vision
- Natural language processing (NLP)
- Component
- Software
- Hardware
- Services
- Deployment
- On-premises
- Cloud-based
- Geography
- North America
- US
- Canada
- Mexico
- APAC
- China
- India
- Japan
- Europe
- Germany
- UK
- France
- South America
- Brazil
- Argentina
- Middle East and Africa
- Saudi Arabia
- UAE
- South Africa
- Rest of World (ROW)
- North America
How is the AI Runtime Optimization Market Segmented by Technology?
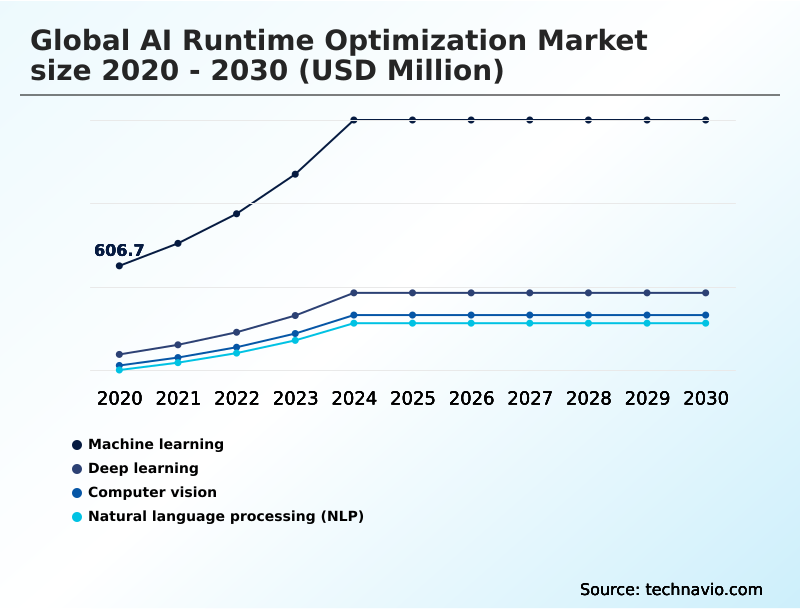
The machine learning segment is estimated to witness significant growth during the forecast period.
The AI runtime optimization market is segmented by technology, where machine learning optimization focuses on inference performance, enabling a 40% reduction in model latency for real-time decision-making.
Techniques like pruning and low-precision quantization are critical in this segment, reducing the computational footprint of models by over 50% without significant accuracy loss. This allows deployment on resource-constrained edge devices.
Further segmentation by component shows software as the key enabler, with specialized compilers and hardware-aware co-design bridging algorithms and silicon architectures.
By deployment, cloud-based solutions dominate due to scalability, while on-premises is vital for data sovereignty, influencing procurement based on security and operational control needs. This multi-faceted segmentation reflects a market driven by both performance metrics and strategic business requirements.
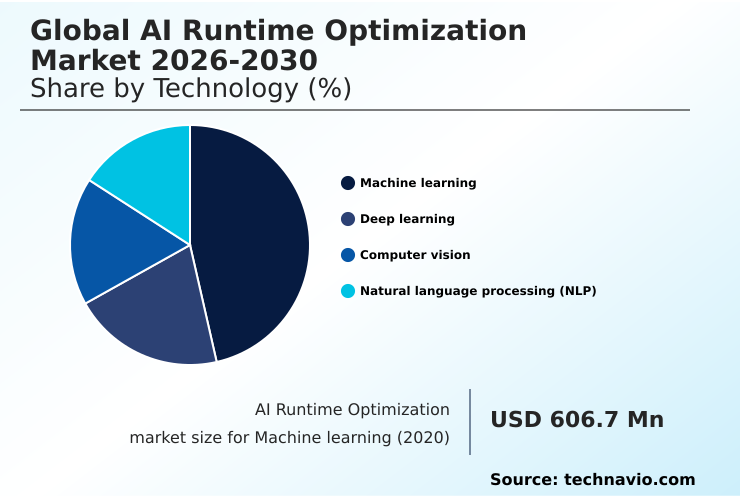
The Machine learning segment was valued at USD 1.17 billion in 2024 and showed a gradual increase during the forecast period.
How demand for the AI Runtime Optimization market is rising in the leading region?
North America is estimated to contribute 36.3% to the growth of the global market during the forecast period.Technavio’s analysts have elaborately explained the regional trends and drivers that shape the market during the forecast period.

See How AI Runtime Optimization Market demand is rising in North America Request Free Sample
North America dominates the AI runtime optimization market, accounting for over 36% of the incremental growth, driven by its concentration of hyperscale cloud providers and semiconductor firms.
The United States leads this region, with enterprise AI spending on optimization tools being 2.5 times higher than in the entire European market. This is primarily due to the push for low-latency inference in sectors like finance and autonomous systems.
In contrast, the APAC region is the fastest-growing market, fueled by massive digital infrastructure investments in countries like China and India, where mobile-first consumer behavior demands efficient on-device AI.
Adoption in APAC is geared toward optimizing models for a diverse range of low-power devices, a strategy differing from North America's focus on high-performance data center compute.
This regional divergence in hardware targets and application focus shapes global supply chains for specialized hardware accelerators and AI talent.
What are the key Drivers, Trends, and Challenges in the AI Runtime Optimization Market?
Our researchers analyzed the data with 2025 as the base year, along with the key drivers, trends, and challenges. A holistic analysis of drivers will help companies refine their marketing strategies to gain a competitive advantage.
- Enterprises are increasingly focused on understanding the true cost of running large language models, driving a need for detailed performance analysis. A common query involves an AI model runtime performance comparison, where businesses evaluate tools based on their ability to reduce operational expenditures.
- The primary goal is optimizing LLM inference latency, as a 200-millisecond delay can result in a 5% drop in user engagement for consumer-facing applications. The industry is also exploring edge AI hardware acceleration techniques to move processing closer to the data source, which is critical for applications requiring real-time responses.
- As deployments scale, AI runtime security best practices become paramount to protect against vulnerabilities in agentic systems and ensure data integrity. An indirect comparison shows that firms using advanced compiler optimization and model compression report a 25% higher return on AI investments compared to those relying on default cloud instances.
- These strategies are essential for achieving both performance and economic viability in production environments.
What are the key market drivers leading to the rise in the adoption of AI Runtime Optimization Industry?
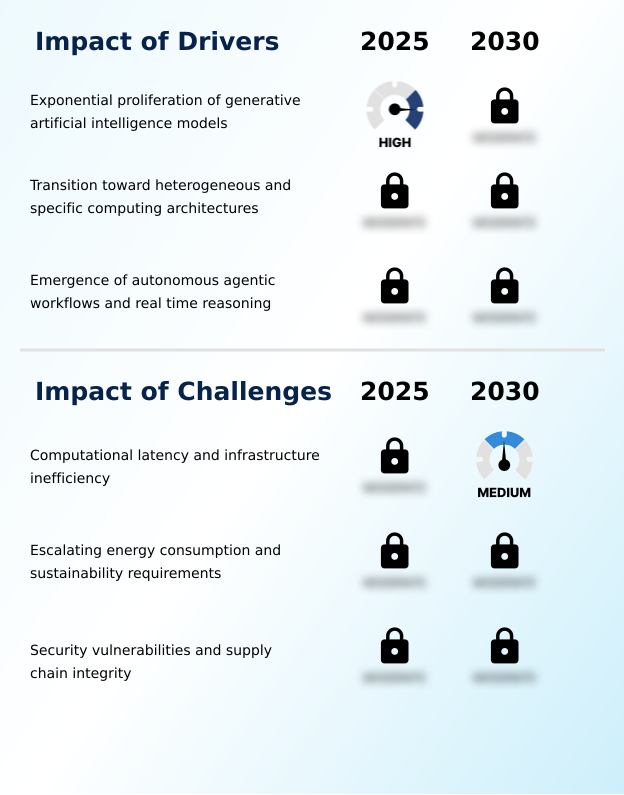
- The exponential proliferation of generative artificial intelligence models is a key market driver, creating significant demand for efficient runtime solutions to manage their computational intensity.
- The exponential growth of generative AI and transformer models is the most significant market driver, increasing computational intensity by over 50% in production environments. This surge in complexity necessitates advanced compiler optimization and model compression techniques to maintain operational viability.
- Consequently, enterprises are adopting runtime tools that increase throughput on existing AI infrastructure by at least 30%, delaying costly hardware upgrades.
- This driver enables the economic feasibility of real-time applications, such as autonomous coding assistants and interactive customer service agents, which would otherwise be constrained by high latency and inference costs.
- The business demand for instantaneous AI responses is reshaping procurement strategies, prioritizing solutions that offer the lowest cost per token generated.
What are the market trends shaping the AI Runtime Optimization Industry?
- The proliferation of hardware-aware optimization frameworks is a primary trend. This is driven by the necessity to tailor model execution to specific hardware architectures, enhancing computational efficiency.
- A primary market trend is the proliferation of hardware-aware optimization, where frameworks tailor model execution to specific silicon architectures, improving inference acceleration by up to 40%. The evolution toward intelligent agentic orchestration represents another significant shift, with autonomous systems managing their own computational overhead to enhance cluster efficiency by 25%.
- This move toward autonomous runtime is driven by the complexity of agentic workflows, which require continuous real-time reasoning and dynamic resource allocation. This trend directly impacts business operations by enabling the deployment of sophisticated digital twins and other autonomous systems across heterogeneous hardware without sacrificing performance.
- The development necessitates closer collaboration in the supply chain between chip designers and software platform providers to ensure seamless full-stack integration and cross-platform deployment.
What challenges does the AI Runtime Optimization Industry face during its growth?
- Computational latency and infrastructure inefficiency present a primary market challenge, hindering the real-time application performance of increasingly complex AI models.
- A critical market challenge is the computational latency in AI infrastructure, where memory bandwidth bottlenecks can cause a performance gap of over 50% between hardware potential and actual application speed. This inefficiency directly impacts real-time applications.
- Another pressing issue is the escalating energy consumption of high-performance runtimes, which can increase data center operational costs by more than 35%, threatening both profitability and sustainability goals. This forces a strategic shift from monolithic models toward more compact, task-specific architectures created through techniques like model distillation.
- Addressing these security vulnerabilities and inefficiencies in the software supply chain is essential for building trust and enabling the widespread adoption of autonomous systems and other production-ready AI.
Exclusive Technavio Analysis on Customer Landscape
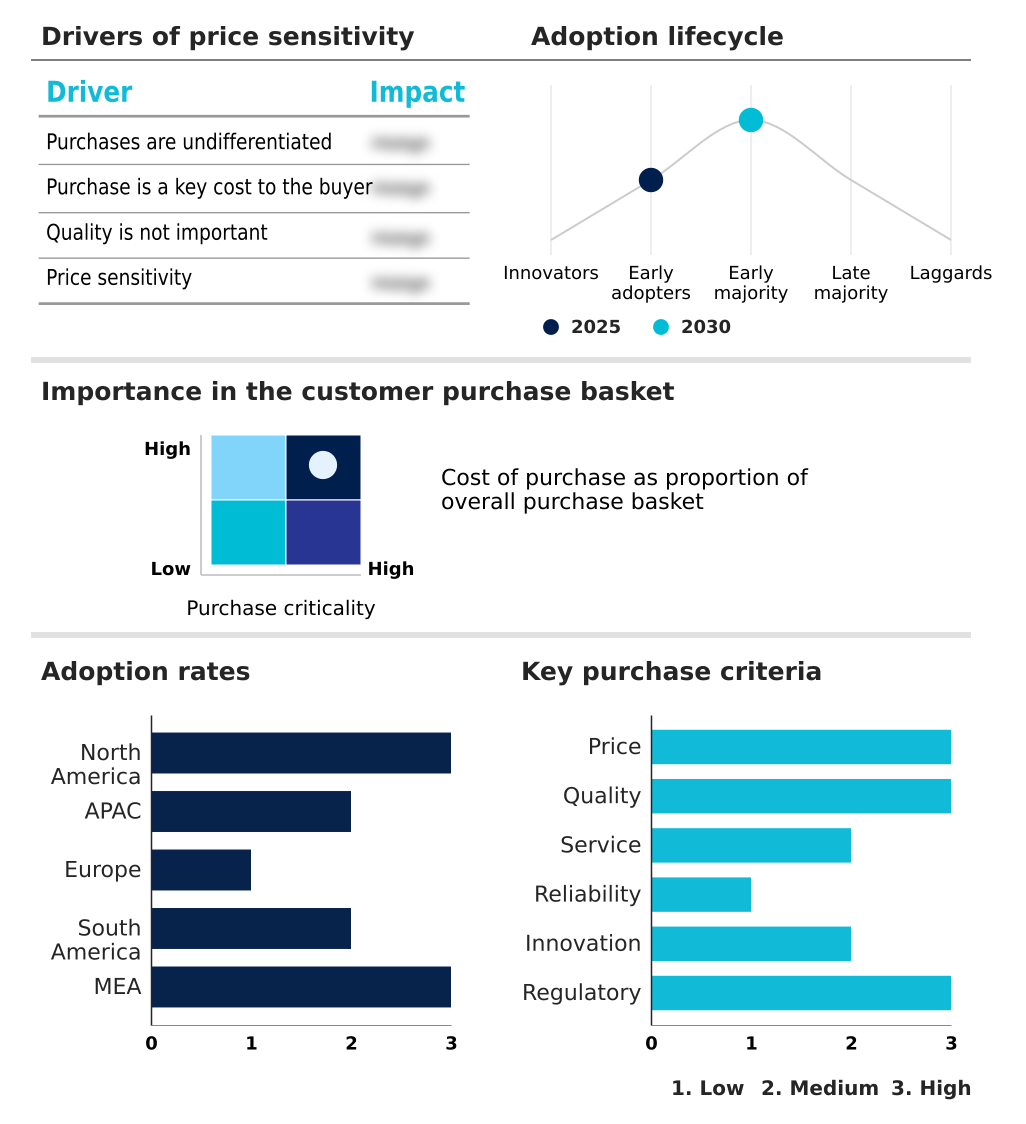
The ai runtime optimization market forecasting report includes the adoption lifecycle of the market, covering from the innovator’s stage to the laggard’s stage. It focuses on adoption rates in different regions based on penetration. Furthermore, the ai runtime optimization market report also includes key purchase criteria and drivers of price sensitivity to help companies evaluate and develop their market growth analysis strategies.
Customer Landscape of AI Runtime Optimization Industry
Competitive Landscape
Companies are implementing various strategies, such as strategic alliances, ai runtime optimization market forecast, partnerships, mergers and acquisitions, geographical expansion, and product/service launches, to enhance their presence in the industry.
Advanced Micro Devices Inc. - Offerings include specialized compilers and hardware-abstraction layers designed to enhance the execution efficiency of machine learning models during the inference phase.
The industry research and growth report includes detailed analyses of the competitive landscape of the market and information about key companies, including:
- Advanced Micro Devices Inc.
- Amazon Web Services Inc.
- Apple Inc.
- Arm Ltd.
- Databricks Inc.
- Deci AI Ltd.
- Edgeimpulse Inc.
- Google LLC
- Graphcore Ltd.
- Groq Inc.
- Hailo Technologies Ltd.
- Hugging Face Inc.
- Intel Corp.
- Meta Platforms Inc.
- Microsoft Corp.
- Neural Magic Inc.
- NVIDIA Corp.
- OctoML Inc.
- Qualcomm Inc.
- SambaNova Systems Inc.
Qualitative and quantitative analysis of companies has been conducted to help clients understand the wider business environment as well as the strengths and weaknesses of key industry players. Data is qualitatively analyzed to categorize companies as pure play, category-focused, industry-focused, and diversified; it is quantitatively analyzed to categorize companies as dominant, leading, strong, tentative, and weak.
Market Intelligence Radar: High-Impact Developments & Growth Signals
- In the systems software industry, the rising demand for IT security solutions is compelling AI runtime optimization platforms to integrate robust security features, addressing vulnerabilities in agentic systems and ensuring supply chain integrity for pre-trained models.
- The growing adoption of agile software development platforms influences the AI runtime optimization market by promoting iterative development, enabling faster releases of optimization tools, and fostering collaboration for continuous improvement of runtime performance.
- A significant increase in the number of data centers, driven by cloud computing and edge computing trends, directly fuels demand for AI runtime optimization to manage energy consumption and improve computational efficiency for large-scale AI deployments.
- The widespread availability of open-source software presents a dual impact; it democratizes access to basic optimization tools while challenging commercial vendors to provide superior value through advanced features, enterprise-grade support, and seamless hardware integration.
Dive into Technavio’s robust research methodology, blending expert interviews, extensive data synthesis, and validated models for unparalleled AI Runtime Optimization Market insights. See full methodology.
| Market Scope | |
|---|---|
| Page number | 301 |
| Base year | 2025 |
| Historic period | 2020-2024 |
| Forecast period | 2026-2030 |
| Growth momentum & CAGR | Accelerate at a CAGR of 31.2% |
| Market growth 2026-2030 | USD 8759.4 million |
| Market structure | Fragmented |
| YoY growth 2025-2026(%) | 25.0% |
| Key countries | US, Canada, Mexico, China, India, Japan, South Korea, Australia, Indonesia, Germany, UK, France, Italy, The Netherlands, Spain, Brazil, Argentina, Chile, Saudi Arabia, UAE, South Africa, Israel and Turkey |
| Competitive landscape | Leading Companies, Market Positioning of Companies, Competitive Strategies, and Industry Risks |
Research Analyst Overview
- The AI runtime optimization market ecosystem is an intricate network of stakeholders, where silicon manufacturers provide the foundational hardware, influencing performance by over 60%. Software vendors and open-source communities build compilers, libraries like ONNX Runtime, and tools for techniques such as quantization and pruning, which can reduce model size by up to 75%.
- Cloud service providers act as major distribution channels, integrating these optimization tools into their managed platforms and model-as-a-service offerings. End-users across sectors like automotive, finance, and healthcare drive demand based on specific needs for low-latency inference or energy-efficient runtimes.
- This dynamic interaction, governed by emerging AI governance standards, shapes a value chain focused on translating computational power into efficient, scalable, and secure production-ready AI applications.
What are the Key Data Covered in this AI Runtime Optimization Market Research and Growth Report?
-
What is the expected growth of the AI Runtime Optimization Market between 2026 and 2030?
-
The AI Runtime Optimization Market is expected to grow by USD 8.76 billion during 2026-2030, registering a CAGR of 31.2%. Year-over-year growth in 2026 is estimated at 25.0%%. This acceleration is shaped by exponential proliferation of generative artificial intelligence models, which is intensifying demand across multiple end-use verticals covered in the report.
-
-
What segmentation does the market report cover?
-
The report is segmented by Technology (Machine learning, Deep learning, Computer vision, and Natural language processing (NLP)), Component (Software, Hardware, and Services), Deployment (On-premises, and Cloud-based) and Geography (North America, APAC, Europe, South America, Middle East and Africa). Among these, the Machine learning segment is estimated to witness significant growth during the forecast period, driven by rising adoption across key application areas. Each segment includes detailed qualitative and quantitative analysis, along with historical data from 2020-2024 and forecasts through 2030 with year-over-year growth rates.
-
-
Which regions are analyzed in the report?
-
The report covers North America, APAC, Europe, South America and Middle East and Africa. North America is estimated to contribute 36.3% to market growth during the forecast period. Country-level analysis includes US, Canada, Mexico, China, India, Japan, South Korea, Australia, Indonesia, Germany, UK, France, Italy, The Netherlands, Spain, Brazil, Argentina, Chile, Saudi Arabia, UAE, South Africa, Israel and Turkey, with dedicated market size tables and year-over-year growth for each.
-
-
What are the key growth drivers and market challenges?
-
The primary driver is exponential proliferation of generative artificial intelligence models, which is accelerating investment and industry demand. The main challenge is computational latency and infrastructure inefficiency, creating operational barriers for key market participants. The report quantifies the impact of each driver and challenge across 2026 and 2030 with comparative analysis.
-
-
Who are the major players in the AI Runtime Optimization Market?
-
Key vendors include Advanced Micro Devices Inc., Amazon Web Services Inc., Apple Inc., Arm Ltd., Databricks Inc., Deci AI Ltd., Edgeimpulse Inc., Google LLC, Graphcore Ltd., Groq Inc., Hailo Technologies Ltd., Hugging Face Inc., Intel Corp., Meta Platforms Inc., Microsoft Corp., Neural Magic Inc., NVIDIA Corp., OctoML Inc., Qualcomm Inc. and SambaNova Systems Inc.. The report provides qualitative and quantitative analysis categorizing companies as dominant, leading, strong, tentative, and weak based on their market positioning. Company profiles include business segment analysis, SWOT assessment, key offerings, and recent strategic developments.
-
Market Research Insights
- The competitive landscape for AI runtime optimization is defined by intense full-stack integration, where leading vendors deliver an average of 15% greater performance per watt with each software update. Key participants like NVIDIA Corp. and Advanced Micro Devices Inc. are driving innovation through hardware-software co-design, focusing on specialized software layers to maximize throughput.
- Recent developments include the launch of production-ready AI software suites that automate model quantization and distributed execution, reducing token costs for large models by up to tenfold. These actions directly address the enterprise demand for managing the escalating computational costs of deploying generative AI at scale.
- However, vendors face the persistent challenge of a fragmented hardware environment, compelling them to create unified software stacks that ensure performance and stability across a diverse range of silicon.
We can help! Our analysts can customize this ai runtime optimization market research report to meet your requirements.
 RIA -
RIA - 
