
AI Servers Market Size 2024-2028
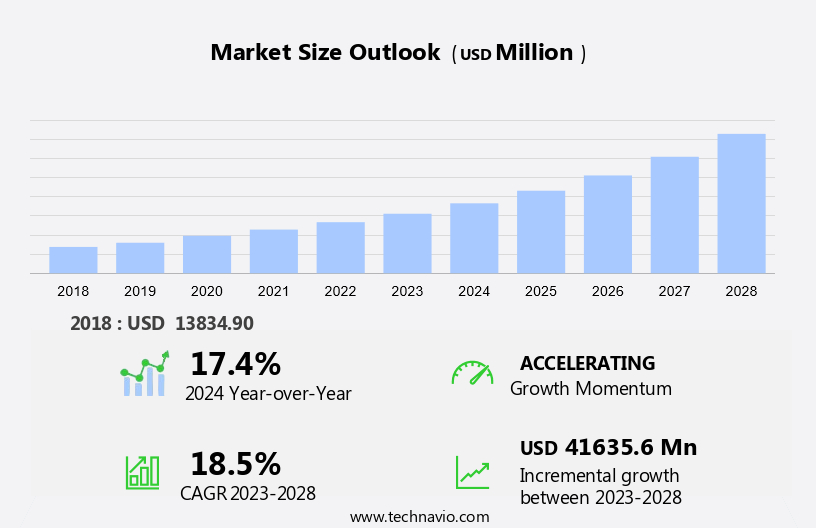
The AI servers market size is forecast to increase by USD 41.64 billion at a CAGR of 18.5% between 2023 and 2028.
- The market for advanced server technology is experiencing significant growth due to the increasing demand for data processing and neural network training. Key drivers include the digital transformation in various industries and the rapid development of AI-specific hardware, such as Tensor Processing Units (TPUs) and Graphics Processing Units (GPUs). However, high initial costs remain a challenge for some organizations. Integration, testing, and customization requirements add to the complexity of implementation. Furthermore, the increasing use of cameras and other data sources necessitates substantial bandwidth use. Deep learning applications, in particular, require massive amounts of data and computational power. Hardware investment is essential to remain competitive in this evolving landscape. The market analysis report provides insights into these trends and challenges, enabling businesses to make informed decisions regarding their hardware investments.
What will be the Size of the Market During the Forecast Period?
- Artificial Intelligence (AI) has become an essential component of business strategies across various industries. AI servers play a crucial role in facilitating the deployment, scalability, and performance of AI applications. In this context, AI servers refer to specialized hardware and software solutions designed to support AI workloads. AI servers enable businesses to process large volumes of data and execute complex AI algorithms efficiently. The integration of AI servers in business operations leads to enhanced data analysis capabilities, improved decision-making processes, and increased operational efficiency. AI servers offer several advantages, including high performance, scalability, compatibility, and reliability.
- Furthermore, these servers are specifically designed to handle the unique requirements of AI workloads, such as high computational power, large memory capacity, and GPU processing capabilities. AI server hardware is optimized to deliver superior performance, with advanced cooling systems to maintain optimal operating temperatures. The software component of AI servers offers features such as virtualization, integration with various AI frameworks, and monitoring tools to ensure optimal performance and maintain AI models. AI server security is another critical aspect, with robust encryption and access control mechanisms to protect sensitive data and prevent unauthorized access.
- Additionally, AI server maintenance is essential to ensure continuous operation and minimize downtime. The adoption of AI servers is on the rise, driven by the increasing demand for data-driven decision-making and the need for real-time processing of large data sets. AI servers are being used in various sectors, including finance, retail, healthcare, transportation, and logistics, to name a few. In conclusion, AI servers are a vital component of modern business operations, providing the necessary infrastructure for deploying, scaling, and maintaining AI applications. Their high performance, scalability, compatibility, reliability, and security make them an essential investment for businesses looking to leverage AI to gain a competitive edge.
How is this market segmented and which is the largest segment?
The market research report provides comprehensive data (region-wise segment analysis), with forecasts and estimates in "USD billion" for the period 2024-2028, as well as historical data from 2018-2022 for the following segments.
- Type
- GPU-based servers
- Edge AI servers
- AI cloud servers
- TPU-based AI servers
- Others
- End-user
- IT and cloud service providers
- Financial services and banking
- Healthcare
- Automotive
- Others
- Geography
- North America
- Canada
- US
- APAC
- China
- India
- Japan
- South Korea
- Europe
- Germany
- UK
- France
- South America
- Brazil
- Middle East and Africa
- North America
By Type Insights
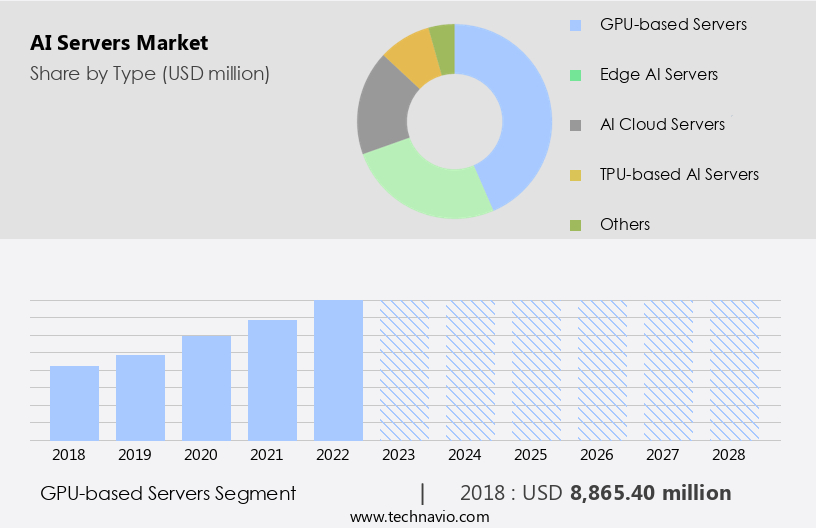
- The GPU-based servers segment is estimated to witness significant growth during the forecast period.
The market encompasses various types, with GPU-based servers being a significant segment due to their energy efficiency and ability to handle computationally intensive tasks. These servers incorporate one or more GPUs, which offer increased power and speed, making them suitable for demanding applications such as video rendering, data analytics, and machine learning. Dedicated GPU servers often include specialized CPUs, substantial RAM, and storage.
Furthermore, the parallel architecture of GPUs, initially engineered for graphics and video processing, allows these servers to process multiple tasks simultaneously at faster rates than traditional CPU-based servers. This technology's sustainability and cost-effectiveness make it an essential component of IT infrastructure for AI-driven applications, including natural language processing and machine learning technologies. Companies prioritize the integration of energy-efficient AI servers into their operations to enhance customer services and remain competitive in today's market.
Get a glance at the market report of share of various segments Request Free Sample
The GPU-based servers segment was valued at USD 8.87 billion in 2018 and showed a gradual increase during the forecast period.
Regional Analysis
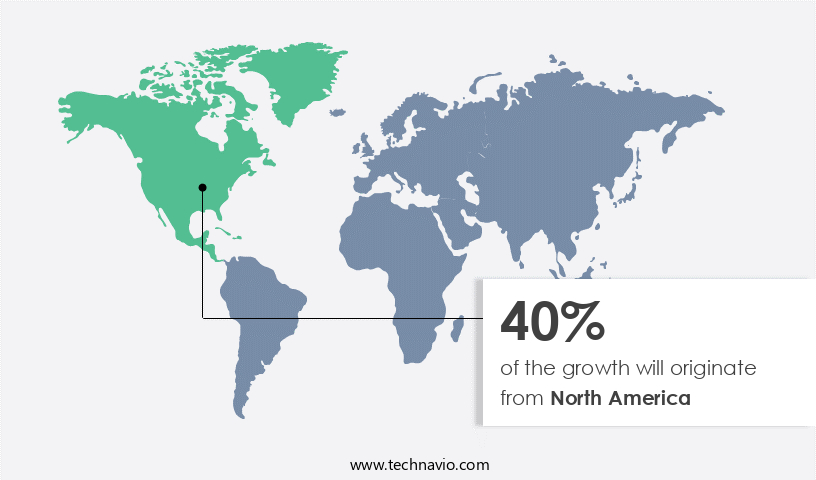
- North America is estimated to contribute 40% to the growth of the global market during the forecast period.
Technavio's analysts have elaborately explained the regional trends and drivers that shape the market during the forecast period.
For more insights on the market share of various regions Request Free Sample
North America is a major player in the global market for AI servers, fueled by substantial investments in advanced data center infrastructure and the increasing implementation of AI technologies across various sectors. The region's advanced technological environment and regulatory landscape position it as a leader in AI server deployment and innovation. In September 2024, EDC VENTURE LLC unveiled its first North American data center in Atlanta, Georgia, which is part of the larger 168 MW Edged Atlanta campus.
Furthermore, this cutting-edge facility, which utilizes waterless cooling technology, signifies a significant leap forward in the U.S. Data center sector, responding to the escalating demand for energy-efficient and powerful data centers to accommodate AI applications. The adoption of cloud-based AI services, complex AI algorithms, computer vision, and edge AI, along with the utilization of AI hardware such as GPUs for AI tasks, sensors for data collection, and the pursuit of reliability and maintenance, are key factors driving the growth of the market in North America.
Market Dynamics
Our researchers analyzed the data with 2023 as the base year, along with the key drivers, trends, and challenges. A holistic analysis of drivers will help companies refine their marketing strategies to gain a competitive advantage.
What are the key market drivers leading to the rise in adoption of AI Servers Market ?
Digital transformation across industries is the key driver of the market.
- The market is experiencing significant growth due to the extensive digital transformation taking place across numerous industries. Digital transformation signifies the integration of digital technology into all business aspects, fundamentally altering how companies operate and deliver value to their customers. This trend is not only improving operational efficiency but also fostering new business models and revenue streams. According to the World Economic Forum, digital transformation could generate up to USD 100 trillion in societal and industrial value by 2025, underlining its profound impact on the global economy. Digital transformation spending is projected to reach USD 1.8 trillion in 2022, with an anticipated increase to approximately USD 2.7 trillion by 2025.
- Moreover, this substantial investment underscores the importance of digital transformation in contemporary business strategies. AI servers, including AI data servers and AI training servers, play a crucial role in this digital transformation by enabling the deployment and optimization of machine learning models and AI capabilities. AI servers, such as AI inference servers, are essential for handling the computational demands of AI applications. They provide the necessary processing power and compatibility with various AI models.
- Furthermore, the increasing adoption of edge devices, which require AI processing at the source, is driving the demand for AI servers that can deliver high performance and efficiency. In conclusion, the digital transformation trend is fueling the growth of the market. The substantial investment in digital transformation and the far-reaching impact of this trend on the global economy underscore the importance of AI servers in enabling businesses to leverage AI capabilities effectively.
What are the market trends shaping the AI Servers Market?
The rapid development of AI-specific hardware is the upcoming trend in the market.
- The market is experiencing notable expansion due to the advancement of Application-Specific Integrated Circuits (ASICs) designed for AI applications. ASICs, such as GPUs, TPUs, and FPGAs, are specifically engineered to optimize AI workloads, including neural networks and machine learning algorithms. Compared to standard CPUs, these sophisticated chips deliver substantial performance enhancements, enabling quicker training and inference of AI models. This technological progression is essential for high-performance computing tasks in natural language processing, computer vision, and predictive analytics, thereby fueling the adoption of AI in numerous industries.
- For instance, Atos SE unveiled the BullSequana AI 600 in May 2024, a collaboration with AMD, to cater to the growing demand for advanced AI servers. This technological innovation plays a pivotal role in driving the growth of the market. From a business perspective, companies are increasingly investing in AI to gain a competitive edge and streamline operations, making the market an attractive investment opportunity.
What challenges does AI Servers Market face during the growth?
High initial costs are key challenges affecting the market growth.
- The market in the United States is witnessing substantial expansion due to the escalating use of Artificial Intelligence (AI) in various sectors. However, the high upfront investment required for AI servers poses a significant obstacle to market growth. The cost of AI servers can significantly differ based on the hardware and software specifications necessary for diverse applications. Entry-level AI servers, outfitted with standard GPUs and processors, can cost anywhere from USD5,000 to USD10,000. These servers cater to less complex AI tasks but might not suffice for more intricate applications. Mid-range AI servers, which incorporate mid-tier GPUs and processors, have costs ranging from USD20,000 to USD50,000.
- However, Google's Tensor Processing Units (TPUs) have emerged as a popular choice for data processing and neural network training due to their high performance and efficiency. Integration and testing of these advanced hardware components add to the overall investment. Bandwidth usage is another factor influencing the cost of AI servers. Deep learning applications necessitate high-performance hardware, leading to increased server costs. To cater to the varying needs of the market, customization options are increasingly being offered by hardware manufacturers. In conclusion, while the benefits of AI are undeniable, the high initial investment required for AI servers remains a significant challenge. Companies must carefully consider their requirements and budgets before investing in AI servers.
Exclusive Customer Landscape
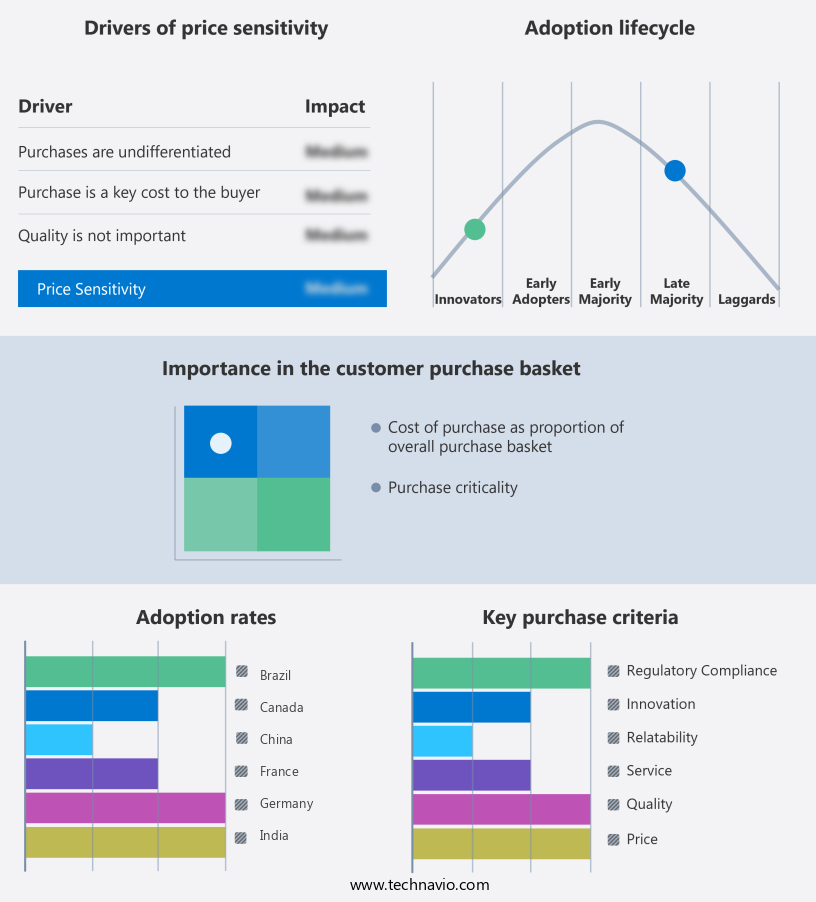
The market forecasting report includes the adoption lifecycle of the market, covering from the innovator's stage to the laggard's stage. It focuses on adoption rates in different regions based on penetration. Furthermore, the market report also includes key purchase criteria and drivers of price sensitivity to help companies evaluate and develop their market growth analysis strategies.
Customer Landscape
Key Companies & Market Insights
Companies are implementing various strategies, such as strategic alliances, market forecast, partnerships, mergers and acquisitions, geographical expansion, and product/service launches, to enhance their presence in the market. The market research and growth report includes detailed analyses of the competitive landscape of the market and information about key companies, including:
- 2CRSi
- Advanced Micro Devices Inc.
- Aivres
- ASUSTeK Computer Inc.
- Atos SE
- Cisco Systems Inc.
- Dell Technologies Inc.
- Edgecore Networks Corp.
- Gigabyte Technology Co. Ltd.
- Hewlett Packard Enterprise Co.
- Huawei Technologies Co. Ltd.
- International Business Machines Corp.
- Intel Corp.
- Lenovo Group Ltd.
- Microsoft Corp.
- New H3C Technologies Co. Ltd.
- NVIDIA Corp.
- OVH Groupe SA
- Penguin Solutions Inc
- Super Micro Computer Inc.
Qualitative and quantitative analysis of companies has been conducted to help clients understand the wider business environment as well as the strengths and weaknesses of key market players. Data is qualitatively analyzed to categorize companies as pure play, category-focused, industry-focused, and diversified; it is quantitatively analyzed to categorize companies as dominant, leading, strong, tentative, and weak.
Research Analyst Overview
Artificial Intelligence (AI) servers have become a crucial component of IT infrastructure as businesses increasingly adopt AI-driven applications in various sectors such as healthcare, finance, and automotive. Cloud-based AI servers offer scalability, energy efficiency, and cost-effectiveness, making them an attractive option for businesses looking to process massive datasets and run complex AI algorithms in real-time. These servers are designed to handle the computational load of AI tasks, including machine learning, natural language processing, computer vision, and deep learning. Edge AI servers are gaining popularity due to their ability to process data at the edge, reducing the need for constant data transmission to the cloud.
Furthermore, they are particularly useful in industries where real-time data processing is essential, such as robotics automation and IoT devices. AI servers can be powered by GPUs or TPUs, providing the necessary computing power for AI tasks. The use of AI servers in IT platforms has led to faster decision-making, improved customer services, and more efficient operational activities. AI technology has revolutionized industries, from healthcare to finance, enabling businesses to gain valuable insights from data and make informed decisions. The flexibility of cloud-based AI infrastructure allows businesses to customize their solutions to meet their specific needs and integrate with existing systems.
Moreover, AI servers are becoming increasingly energy-efficient and environmentally friendly, making them a sustainable investment for businesses. The competitive positions of AI server infrastructure providers depend on their ability to offer high-performance computing, reliability, and compatibility with various AI models and algorithms. The future of AI servers lies in their ability to handle the increasing demands of AI-driven applications and provide cost-effective, energy-efficient, and sustainable solutions. Furthermore, AI for risk management, AI for fraud detection, and AI for predictive analytics are shaping the future of AI in retail, AI in transportation, and AI in the enterprise, all supported by cloud AI infrastructure and edge computing solutions.
|
Market Scope |
|
|
Report Coverage |
Details |
|
Page number |
224 |
|
Base year |
2023 |
|
Historic period |
2018-2022 |
|
Forecast period |
2024-2028 |
|
Growth momentum & CAGR |
Accelerate at a CAGR of 18.5% |
|
Market growth 2024-2028 |
USD 41.64 billion |
|
Market structure |
Fragmented |
|
YoY growth 2023-2024(%) |
17.4 |
|
Key countries |
US, China, Japan, Germany, UK, South Korea, India, Canada, Brazil, and France |
|
Competitive landscape |
Leading Companies, Market Positioning of Companies, Competitive Strategies, and Industry Risks |
What are the Key Data Covered in this Market Research and Growth Report?
- CAGR of the market during the forecast period
- Detailed information on factors that will drive the market growth and forecasting between 2024 and 2028
- Precise estimation of the size of the market and its contribution of the market in focus to the parent market
- Accurate predictions about upcoming market growth and trends and changes in consumer behaviour
- Growth of the market across North America, APAC, Europe, South America, and Middle East and Africa
- Thorough analysis of the market's competitive landscape and detailed information about companies
- Comprehensive analysis of factors that will challenge the growth of market companies
We can help! Our analysts can customize this market research report to meet your requirements. Get in touch
 RIA -
RIA - 
