Graphics Processing Unit (GPU) Market Size 2025-2029
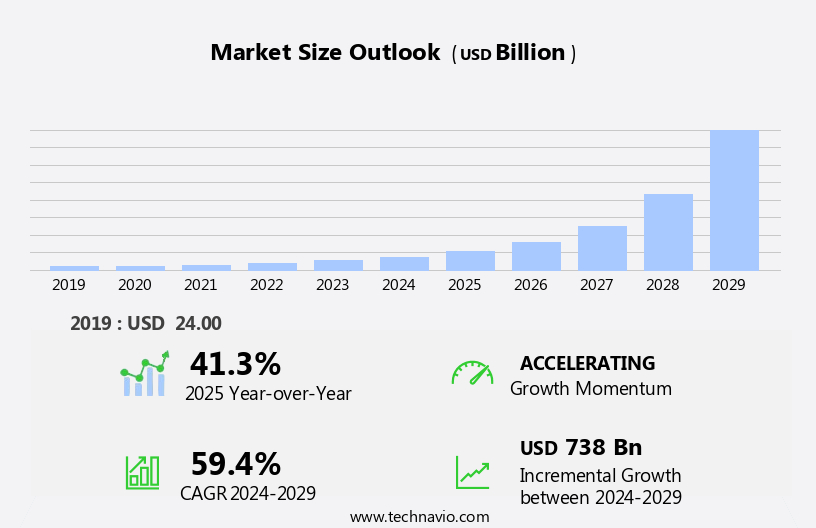
The graphics processing unit (gpu) market size is forecast to increase by USD 738 billion, at a CAGR of 59.4% between 2024 and 2029.
- The market is experiencing significant growth, driven by the increasing demand for advanced gaming and Virtual Reality (VR) experiences. These applications require high-performance graphics capabilities, leading to a surge in demand for more powerful GPUs. Additionally, the rise in demand for High-Performance Computing (HPC) applications, such as scientific simulations and machine learning, is also fueling market growth. However, challenges persist in the form of difficulties in upgrading GPUs in notebooks due to size and power constraints. Companies seeking to capitalize on market opportunities should focus on developing compact, power-efficient GPUs that can meet the demands of both gaming and HPC applications.
- Navigating the challenges of GPU upgrading in notebooks will require innovative solutions and collaboration between hardware manufacturers and OEMs. Overall, the GPU market presents significant opportunities for growth, particularly in the areas of gaming, VR, and HPC, while also posing challenges that require strategic solutions.
What will be the Size of the Graphics Processing Unit (GPU) Market during the forecast period?
Explore in-depth regional segment analysis with market size data - historical 2019-2023 and forecasts 2025-2029 - in the full report.
Request Free Sample
The GPU market continues to evolve, driven by advancements in technology and diverse applications across various sectors. High-end PCs integrate GPUs for texture filtering and game development, while AI chips utilize these components for deep learning acceleration. Cooling solutions and power management are crucial considerations for managing the increased power consumption of modern GPUs. Gaming consoles and server farms leverage GPU architecture for compute performance, with streaming multiprocessors and shader units enhancing graphics rendering and parallel processing capabilities. Memory bandwidth and clock speeds are essential factors in scientific computing and professional workstations. Data centers employ GPU clusters for data analytics, machine learning, and floating-point operations, while virtual reality and cloud gaming require GPUs for rendering complex graphics and handling real-time processing.
HBM2E and tensor cores are among the latest innovations, offering improved memory efficiency and neural network acceleration. The graphics pipeline undergoes constant refinement, with ray tracing and compute shaders pushing the boundaries of visual realism. Thermal throttling and fan noise are ongoing concerns, necessitating advancements in cooling technology. The GPU market's continuous dynamism underscores its significance in driving technological progress and innovation.
How is this Graphics Processing Unit (GPU) Industry segmented?
The graphics processing unit (gpu) industry research report provides comprehensive data (region-wise segment analysis), with forecasts and estimates in "USD billion" for the period 2025-2029, as well as historical data from 2019-2023 for the following segments.
- Type
- Integrated GPUs
- Discrete GPUs
- Application
- Computers
- Tablets and smartphones
- Television
- Gaming consoles
- End-user
- Electronics
- IT and telecom
- Defense and intelligence
- Media and entertainment
- Others
- Geography
- North America
- US
- Canada
- Europe
- France
- Germany
- UK
- APAC
- Australia
- China
- India
- Japan
- South Korea
- Rest of World (ROW)
- North America
By Type Insights
The integrated gpus segment is estimated to witness significant growth during the forecast period.
The market continues to evolve with advancements in technology, as integrated GPUs become more prevalent. Unlike discrete GPUs, integrated GPUs are part of the processor and utilize system memory shared with the Central Processing Unit (CPU). This results in reduced power consumption and heat generation, extending battery life. In January 2024, AMD introduced the Ryzen 8000G series, which includes the Ryzen 7 8700G CPU and the Radeon 780M integrated GPU. This solution offers enhanced performance for gaming and graphics-intensive tasks, surpassing entry-level discrete GPUs while maintaining energy efficiency. Advancements in GPU architecture include texture filtering, which improves image quality, and ray tracing, which creates more realistic lighting effects in games and virtual reality (VR).
Deep learning acceleration, powered by tensor cores and streaming multiprocessors, enables faster machine learning and artificial intelligence (AI) processing. High-bandwidth memory (HBM2E) and memory clock speeds enhance memory access and data analytics capabilities. Compute performance is a critical factor, with CUDA cores and shader units enabling parallel processing for scientific computing, professional workstations, and high-performance computing (HPC) applications. Data centers and server farms rely on GPUs for AI chips, neural network acceleration, and performance benchmarks. Power consumption remains a concern, with cooling solutions and fan noise reduction essential for maintaining optimal GPU performance. VR headsets and high-end PCs require powerful GPUs for immersive gaming experiences.
Gaming consoles and GPU clusters are also significant markets, driving the demand for advanced GPU architecture. In summary, the GPU market is dynamic, with ongoing advancements in technology addressing the needs of various industries, from gaming to scientific computing and data analytics. Integrated GPUs offer energy efficiency and cost savings, while discrete GPUs deliver superior performance for demanding applications. The future of GPUs lies in their ability to adapt to evolving market requirements and deliver harmonious, immersive, and strike-the-right-balance solutions.
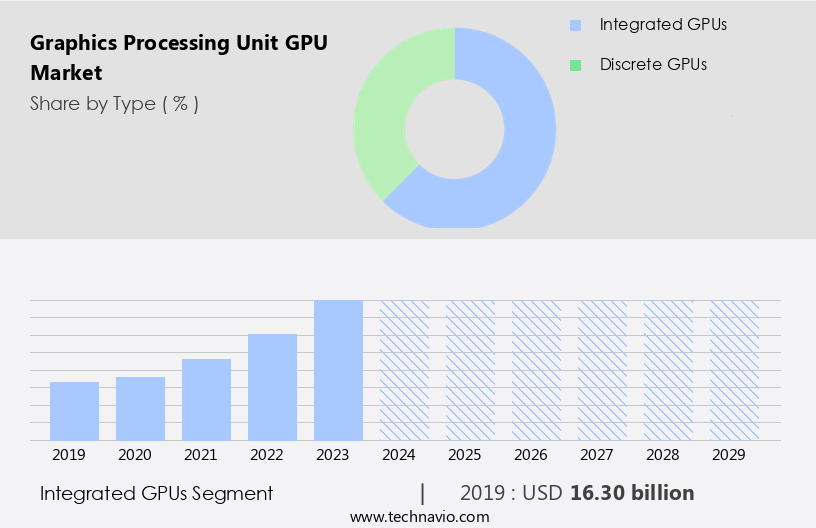
The Integrated GPUs segment was valued at USD 16.30 billion in 2019 and showed a gradual increase during the forecast period.
Regional Analysis
APAC is estimated to contribute 46% to the growth of the global market during the forecast period.Technavio’s analysts have elaborately explained the regional trends and drivers that shape the market during the forecast period.
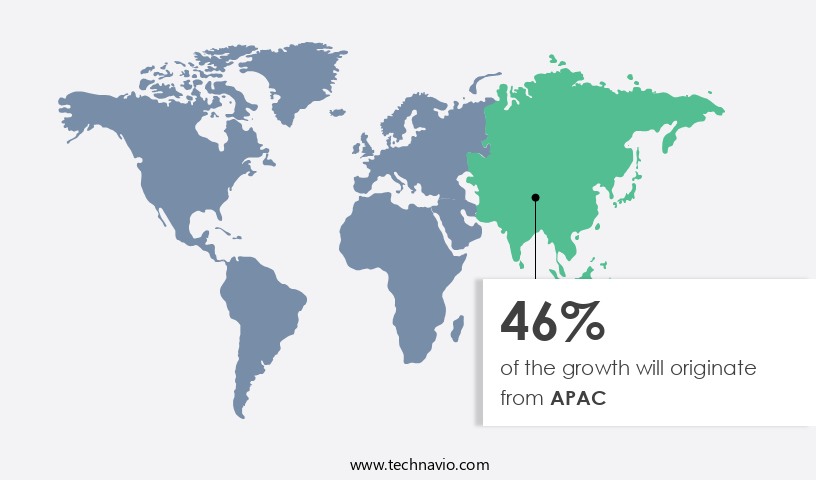
In the global GPU market, APAC holds a significant position due to technological advancements and increasing demand for gaming, virtual reality (VR), and data analytics applications. The region's continual investment in research and development, particularly in countries like China, Japan, and South Korea, has led to the creation of advanced GPUs with high-performance capabilities. These GPUs cater to various industries, including gaming and entertainment, scientific computing, professional workstations, and artificial intelligence (AI). Advancements in GPU architecture, such as high-bandwidth memory (HBM2E) and tensor cores, have revolutionized compute performance and neural network acceleration. Power consumption remains a concern, but innovations in cooling solutions and power management have mitigated this issue.
Ray tracing and real-time rendering have become essential for immersive gaming experiences and VR headsets, driving demand for high-end GPUs. Cloud gaming and server farms have emerged as significant markets for GPUs, offering access to high-performance computing resources on-demand. Data centers and AI chips have also adopted GPUs for their parallel processing capabilities, leading to growth in the market. Compute shaders, streaming multiprocessors, and shader units have become essential components of modern GPUs, enabling efficient and versatile graphics processing. Memory clock speeds, memory bandwidth, and floating-point operations have become critical factors in GPU performance benchmarks. GPU overclocking and thermal throttling continue to be topics of interest for enthusiasts and professionals seeking maximum performance.
The GPU market's evolution reflects the ongoing convergence of gaming, entertainment, and professional applications, underscoring its importance in driving technological innovation.
Market Dynamics
Our researchers analyzed the data with 2024 as the base year, along with the key drivers, trends, and challenges. A holistic analysis of drivers will help companies refine their marketing strategies to gain a competitive advantage.
What are the key market drivers leading to the rise in the adoption of Graphics Processing Unit (GPU) Industry?
- The surge in demand for advanced gaming and virtual reality (VR) experiences serves as the primary catalyst for market growth in this sector.
- The market is experiencing substantial growth due to the escalating demand for advanced gaming and Virtual Reality (VR) experiences. The gaming industry's continuous evolution, with developers continually pushing the boundaries to create more immersive and realistic experiences, is a primary factor fueling this demand. High-performance GPUs are essential to meet the computational requirements of these advanced gaming technologies. Moreover, the advent of cloud gaming and data centers has further boosted the market's growth. Cloud gaming services enable users to access games over the internet, requiring powerful GPUs to deliver seamless gaming experiences. Similarly, data centers rely on GPUs for data analytics, machine learning, and artificial intelligence applications, which demand high parallel processing capabilities and floating-point operations.
- GPU clusters, consisting of multiple GPUs working together, are increasingly being adopted for handling complex computational tasks. Tensor cores, a specialized type of GPU architecture designed for artificial intelligence and machine learning applications, are gaining popularity due to their ability to accelerate these workloads. VR headsets, with their immersive experiences, also require high-performance GPUs to render the graphics in real-time. Memory clock speeds and parallel processing capabilities are critical factors influencing GPU performance. The market's competitive landscape is dynamic, with companies continually innovating to deliver GPUs with superior performance and energy efficiency.
What are the market trends shaping the Graphics Processing Unit (GPU) Industry?
- The increasing demand for high-performance computing (HPC) represents a significant market trend. HPC solutions are increasingly sought after due to their ability to process complex data and perform intensive computations efficiently.
- The market is experiencing notable growth due to the escalating demand for high-performance computing (HPC) in various sectors. This expansion can be attributed to several factors, including the increasing need for sophisticated graphics capabilities in industries such as gaming, virtual reality (VR), and animation. The complexity of modern video games and the burgeoning popularity of VR experiences necessitate GPUs that can deliver high-resolution graphics and seamless performance. In response, manufacturers are developing advanced GPUs specifically designed for HPC, empowering game developers and content creators to explore new frontiers of visual quality and realism. Moreover, the advent of artificial intelligence (AI) chips and cooling solutions has further fueled the demand for GPUs in server farms and professional workstations.
- These technologies rely on GPUs to process large amounts of data and perform complex computations, making them indispensable for scientific computing and other data-intensive applications. GPU architecture continues to evolve, with an increasing emphasis on streaming multiprocessors, shader units, and memory bandwidth. These advancements enable GPUs to handle increasingly complex workloads, making them a versatile solution for a wide range of applications. Overall, the GPU market is poised for continued growth as the demand for high-performance computing and advanced graphics capabilities continues to escalate.
What challenges does the Graphics Processing Unit (GPU) Industry face during its growth?
- The upgrading of graphics processing units (GPUs) in notebooks poses a significant challenge to the industry's growth due to various technical complexities and compatibility issues.
- The global GPU market is experiencing a significant challenge with upgrading graphics processing units (GPUs) in notebooks. This issue is a concern for both manufacturers and consumers due to the rapid advancements in graphics technology. The compact design of notebooks, prioritizing portability over expansion, restricts the ability to accommodate larger and more powerful GPUs. Desktop computers, on the other hand, offer more room for expansion and can easily accommodate upgrades. High-performance computing, artificial intelligence, and neural network acceleration are driving the demand for advanced GPUs. These applications require massive parallel processing capabilities, which GPUs excel at providing. However, the limitations in notebook design hinder their ability to keep up with these advancements.
- GPU memory types, such as GDDR5 and GDDR6, play a crucial role in GPU performance. Overclocking GPUs can also enhance their capabilities, but it comes with the risk of fan noise and thermal throttling. Render farms and compute shaders are essential tools in the graphics pipeline, but they require powerful GPUs to run efficiently. Manufacturers are addressing this issue by incorporating more powerful GPUs into notebook designs, but it remains a challenge. Thermal management is a significant concern, as GPUs generate a considerable amount of heat. Neural network acceleration is another area where GPUs shine, but it requires even more processing power than traditional graphics applications.
- In conclusion, the GPU market is evolving rapidly, and the limitations in notebook design present a significant challenge. Manufacturers must find ways to accommodate more powerful GPUs while maintaining compactness and thermal management. Despite these challenges, the demand for high-performance GPUs continues to grow, driven by applications in high-performance computing, artificial intelligence, and neural network acceleration.
Exclusive Customer Landscape
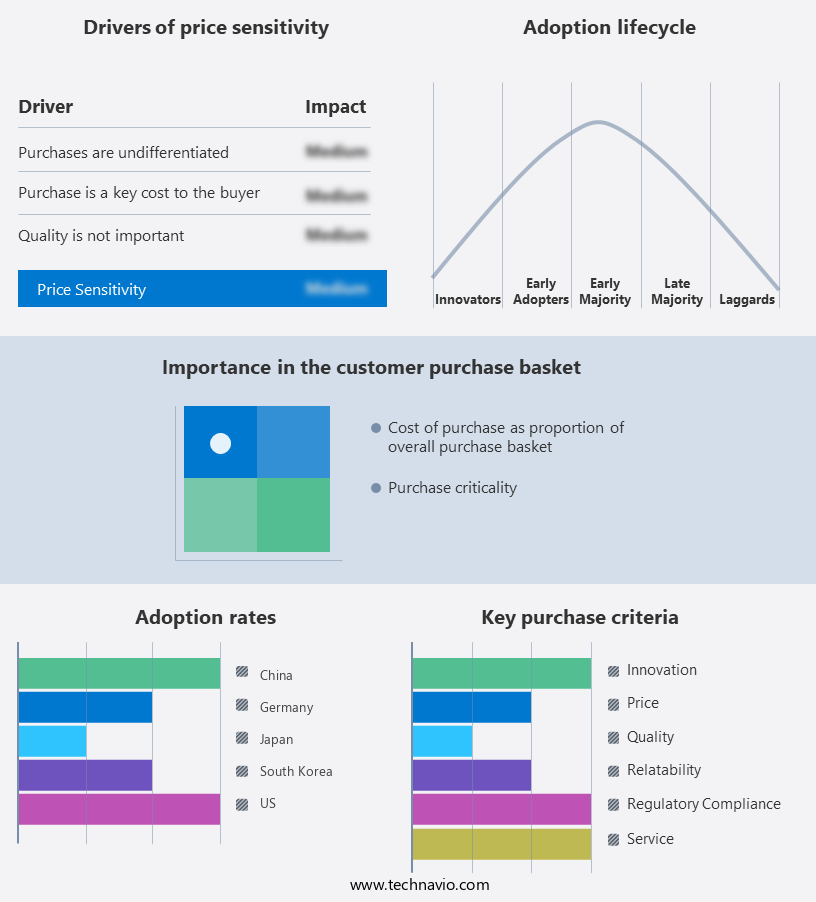
The graphics processing unit (gpu) market forecasting report includes the adoption lifecycle of the market, covering from the innovator’s stage to the laggard’s stage. It focuses on adoption rates in different regions based on penetration. Furthermore, the graphics processing unit (gpu) market report also includes key purchase criteria and drivers of price sensitivity to help companies evaluate and develop their market growth analysis strategies.
Customer Landscape
Key Companies & Market Insights
Companies are implementing various strategies, such as strategic alliances, graphics processing unit (gpu) market forecast, partnerships, mergers and acquisitions, geographical expansion, and product/service launches, to enhance their presence in the industry.
Advanced Micro Devices Inc. - The company specializes in graphics processing units, providing advanced solutions for workstations with Radeon PRO series, desktops featuring AMD Advantage and Radeon RX, and laptops equipped with Radeon Mobile Graphics. These GPUs cater to various computing needs, ensuring optimal performance and efficiency. AMD's innovative technology enhances visual experiences, making it a preferred choice for professionals and enthusiasts alike.
The industry research and growth report includes detailed analyses of the competitive landscape of the market and information about key companies, including:
- Advanced Micro Devices Inc.
- Alphabet Inc.
- Apple Inc.
- Arm Ltd.
- ASUSTeK Computer Inc.
- Broadcom Inc.
- Fujitsu Ltd.
- Galaxy Microsystems Ltd.
- Gigabyte Technology Co. Ltd.
- Imagination Technologies Ltd.
- Intel Corp.
- International Business Machines Corp.
- NVIDIA Corp.
- Qualcomm Inc.
- Samsung Electronics Co. Ltd.
- SAPPHIRE Technology Ltd.
- Sony Group Corp.
- Taiwan Semiconductor Manufacturing Co. Ltd.
- Zebra Technologies Corp.
- Zotac Technology Ltd.
Qualitative and quantitative analysis of companies has been conducted to help clients understand the wider business environment as well as the strengths and weaknesses of key industry players. Data is qualitatively analyzed to categorize companies as pure play, category-focused, industry-focused, and diversified; it is quantitatively analyzed to categorize companies as dominant, leading, strong, tentative, and weak.
Recent Development and News in Graphics Processing Unit (GPU) Market
- In February 2023, Nvidia, a leading GPU manufacturer, unveiled its groundbreaking Hopper architecture GPU, Grace, designed specifically for artificial intelligence (AI) and high-performance computing (HPC) applications. This architectural leap is expected to deliver significant improvements in energy efficiency and performance, positioning Nvidia to maintain its dominance in the GPU market (Nvidia Press Release, 2023).
- In March 2024, AMD, a major GPU competitor, announced a strategic partnership with Microsoft to collaborate on custom GPU solutions for Microsoft's Azure cloud platform. This collaboration is expected to enhance AMD's presence in the cloud computing market and strengthen its competitive position against Nvidia (AMD Press Release, 2024).
- In May 2024, Intel, the world's largest chipmaker, completed the acquisition of Tower Semiconductor's 12-inch wafer fabrication facility in Israel. This acquisition will enable Intel to expand its manufacturing capabilities and increase its GPU production capacity, aiming to challenge Nvidia and AMD in the GPU market (Intel Press Release, 2024).
- In October 2025, Samsung Electronics, a prominent player in the semiconductor industry, introduced its new 3nm GPU, the Exynos 2300. This advanced GPU promises improved performance and power efficiency, positioning Samsung to compete more effectively with Nvidia and AMD in the high-end GPU market (Samsung Press Release, 2025).
Research Analyst Overview
- The GPU market continues to evolve, with trends such as AI hardware integration and improved GPU power efficiency driving innovation. GPU-based rendering, a key application, is gaining traction in industries like medical imaging and visual effects. Real-time rendering and edge computing are also on the rise, pushing the boundaries of what's possible in 3D graphics. companies are responding with new GPU roadmaps, focusing on GPU hardware design, manufacturing processes, and price performance. Sustainability is a growing concern, with efforts underway to enhance GPU utilization and reduce energy consumption.
- Cloud computing and high-performance computing clusters are increasingly relying on GPUs for processing power. GPU software development and benchmarking tools are essential for optimizing GPU performance and reliability. The future of GPUs lies in their ability to handle complex computations and deliver stunning visual effects for various applications, from scientific visualization to gaming.
Dive into Technavio’s robust research methodology, blending expert interviews, extensive data synthesis, and validated models for unparalleled Graphics Processing Unit (GPU) Market insights. See full methodology.
|
Market Scope |
|
|
Report Coverage |
Details |
|
Page number |
236 |
|
Base year |
2024 |
|
Historic period |
2019-2023 |
|
Forecast period |
2025-2029 |
|
Growth momentum & CAGR |
Accelerate at a CAGR of 59.4% |
|
Market growth 2025-2029 |
USD 738 billion |
|
Market structure |
Fragmented |
|
YoY growth 2024-2025(%) |
41.3 |
|
Key countries |
US, Canada, Japan, India, China, South Korea, UK, Germany, France, and Australia |
|
Competitive landscape |
Leading Companies, Market Positioning of Companies, Competitive Strategies, and Industry Risks |
What are the Key Data Covered in this Graphics Processing Unit (GPU) Market Research and Growth Report?
- CAGR of the Graphics Processing Unit (GPU) industry during the forecast period
- Detailed information on factors that will drive the growth and forecasting between 2025 and 2029
- Precise estimation of the size of the market and its contribution of the industry in focus to the parent market
- Accurate predictions about upcoming growth and trends and changes in consumer behaviour
- Growth of the market across APAC, North America, Europe, South America, and Middle East and Africa
- Thorough analysis of the market’s competitive landscape and detailed information about companies
- Comprehensive analysis of factors that will challenge the graphics processing unit (gpu) market growth of industry companies
We can help! Our analysts can customize this graphics processing unit (gpu) market research report to meet your requirements.
 RIA -
RIA - 
