AI Speakers Market Analysis, Size, and Forecast 2025-2029: North America (US, Canada, and Mexico), Europe (Germany, UK, and France), APAC (China, India, and Japan), South America (Brazil, Argentina, and Colombia), Middle East and Africa (UAE, Saudi Arabia, and South Africa), and Rest of World (ROW)

AI Speakers Market Analysis, Size, and Forecast 2025-2029:
North America (US, Canada, and Mexico), Europe (Germany, UK, and France), APAC (China, India, and Japan), South America (Brazil, Argentina, and Colombia), Middle East and Africa (UAE, Saudi Arabia, and South Africa), and Rest of World (ROW)

Published: Dec 2025 296 Pages SKU: IRTNTR81078

Market Overview at a Glance

$12.69 B
Market Opportunity
23.1%
CAGR 2024 - 2029
31.4%
North America Growth
$3.61 B
Smart speaker segment 2023

AI Speakers Market Size 2025-2029

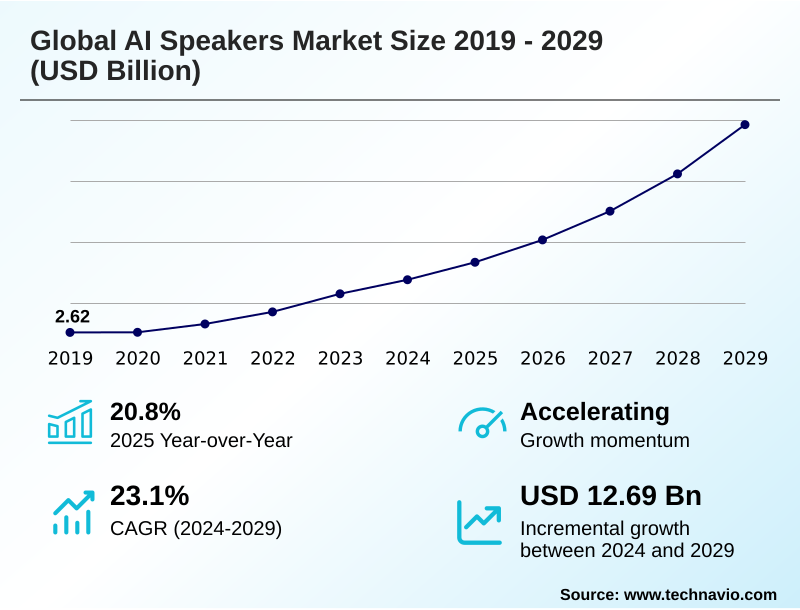
The ai speakers market size is valued to increase by USD 12.69 billion, at a CAGR of 23.1% from 2024 to 2029. Integration of advanced generative AI and large language models will drive the ai speakers market.

Major Market Trends & Insights

  • North America dominated the market and accounted for a 31.4% growth during the forecast period.
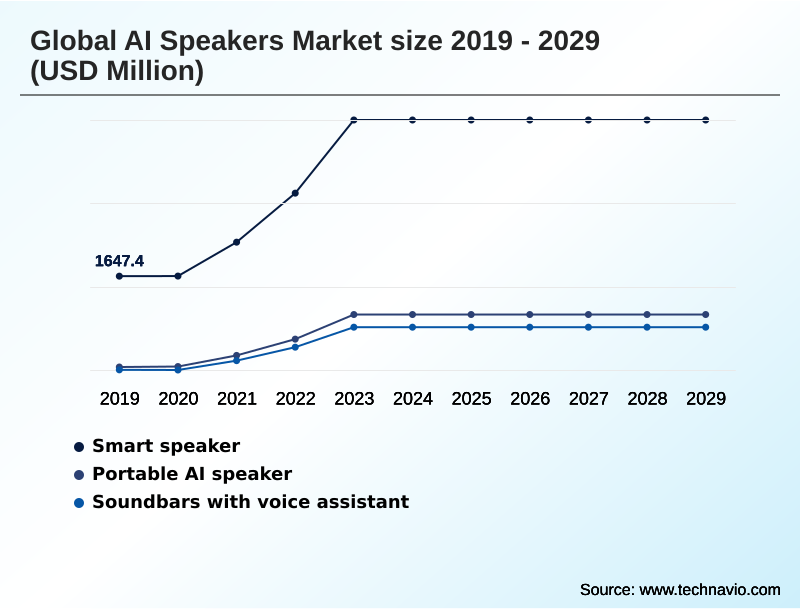
  • By Product Type - Smart speaker segment was valued at USD 3.61 billion in 2023
  • By Component - Hardware segment accounted for the largest market revenue share in 2023

Market Size & Forecast

  • Market Opportunities: USD 17.00 billion
  • Market Future Opportunities: USD 12.69 billion
  • CAGR from 2024 to 2029 : 23.1%

Market Summary

  • The AI speakers market is transitioning from novelty devices to essential components of the connected home. This evolution is propelled by the integration of sophisticated large language models and a focus on creating a seamless ambient computing ecosystem.
  • As these devices become more intelligent, they move beyond simple music playback to serve as a central hub for controlling a diverse range of IoT devices. A key trend is the push for on-device AI processing to address privacy concerns and improve response times.
  • However, the market faces challenges related to saturation in developed regions and the need for compelling innovation to spur upgrades. For example, in a commercial setting, a hospitality chain can deploy AI speakers to streamline guest services, from room-service ordering to controlling room ambiance, thereby improving operational efficiency without major infrastructure changes.
  • The success of AI speakers hinges on balancing advanced, proactive assistance with robust security and a trustworthy user experience, making them indispensable in both residential and commercial environments.

What will be the Size of the AI Speakers Market during the forecast period?

Get Key Insights on Market Forecast (PDF) Request Free Sample

How is the AI Speakers Market Segmented?

The ai speakers industry research report provides comprehensive data (region-wise segment analysis), with forecasts and estimates in "USD million" for the period 2025-2029, as well as historical data from 2019-2023 for the following segments.

  • Product type
    • Smart speaker
    • Portable AI speaker
    • Soundbars with voice assistant
  • Component
    • Hardware
    • Software
    • Services
  • Connectivity
    • Wi-Fi
    • Bluetooth
    • Cellular or LTE
    • Others
  • Geography
    • North America
      • US
      • Canada
      • Mexico
    • Europe
      • Germany
      • UK
      • France
    • APAC
      • China
      • India
      • Japan
    • South America
      • Brazil
      • Argentina
      • Colombia
    • Middle East and Africa
      • UAE
      • Saudi Arabia
      • South Africa
    • Rest of World (ROW)

By Product Type Insights

The smart speaker segment is estimated to witness significant growth during the forecast period.

The smart speaker segment is evolving from a functional device for music playback into a sophisticated home automation hub.

This transformation is driven by the integration of advanced computational audio technology and on-device AI processing, which ensures a low-latency response for commands.

The adoption of the Matter connectivity standard is critical, allowing these devices to act as a centralized command center for an increasingly interoperable smart home.

This enhancement, which includes functionality as thread border routers, solidifies the device's role in the ambient computing ecosystem.

For instance, integrated smart energy management routines now enable automated cost savings, with some systems demonstrating a 15% reduction in off-peak energy consumption.

This shift toward practical utility, powered by advanced acoustic engineering and seamless ecosystem integration, defines the segment's current trajectory, moving beyond commoditized hardware functions toward delivering tangible value through software-defined features and voice-activated user interface.

Request Free Sample

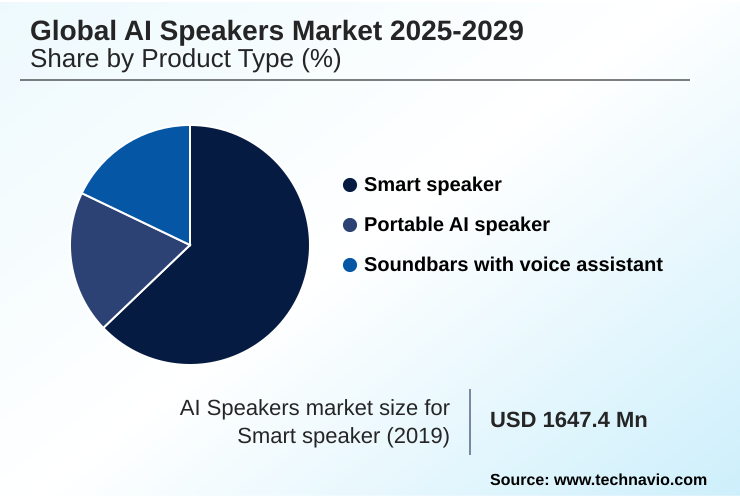
The Smart speaker segment was valued at USD 3.61 billion in 2023 and showed a gradual increase during the forecast period.

Request Free Sample

Regional Analysis

North America is estimated to contribute 31.4% to the growth of the global market during the forecast period.Technavio’s analysts have elaborately explained the regional trends and drivers that shape the market during the forecast period.

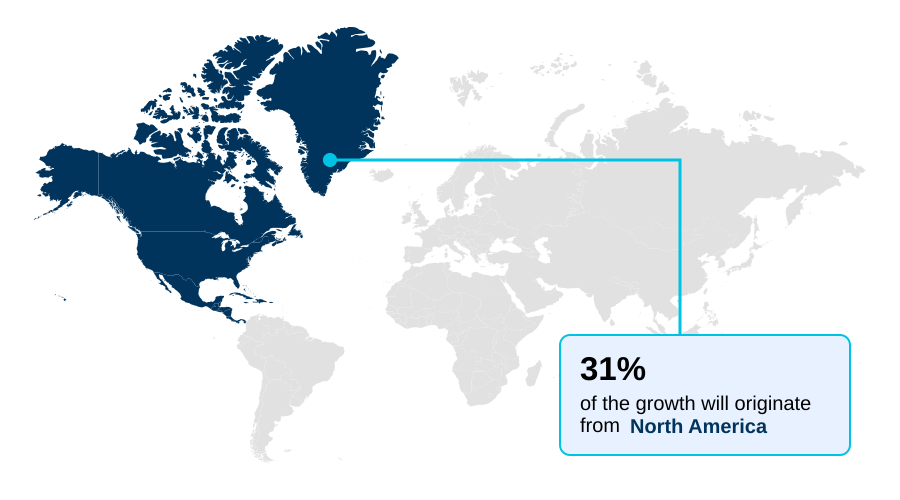
See How AI Speakers Market Demand is Rising in North America Request Free Sample

The geographic landscape of the market is distinctly divided. North America and Europe represent mature regions, where growth is driven by upgrades and ecosystem expansion, with over 60% of households owning at least one smart device.

In contrast, the APAC region is the fastest-growing, fueled by a rising middle class and localized content delivery. This region's expansion is nearly 25% faster than that of South America.

European market strategies are heavily influenced by stringent data governance frameworks, promoting privacy-preserving architecture and on-device AI processing. In Asia, domestic leaders focus on deep IoT device integration and proactive assistance within their ecosystems.

This regional fragmentation requires manufacturers to tailor not only voice assistant platforms and third-party skill ecosystems but also hardware features and pricing models to succeed, balancing global technology with local market demands for smart energy management and seamless ecosystem integration.
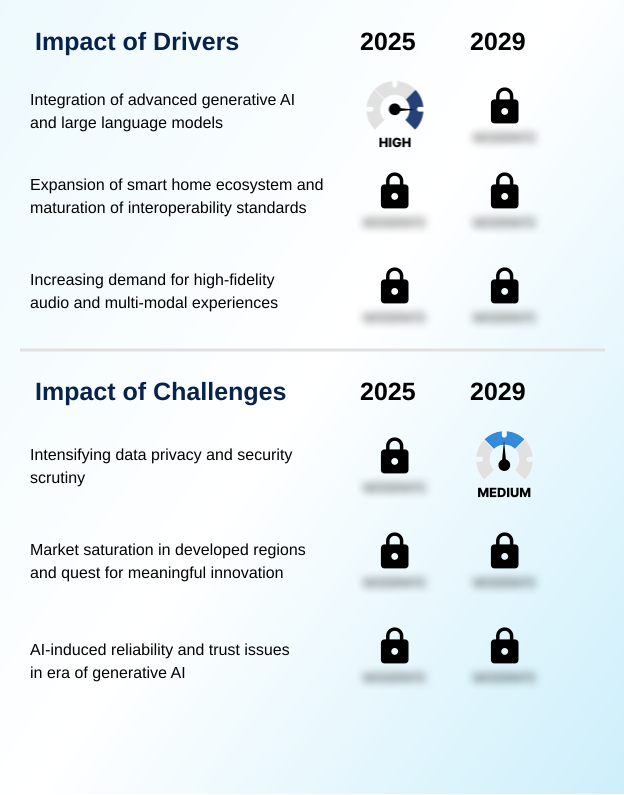
Market Dynamics

Our researchers analyzed the data with 2024 as the base year, along with the key drivers, trends, and challenges. A holistic analysis of drivers will help companies refine their marketing strategies to gain a competitive advantage.

  • The strategic direction of the AI speakers market is increasingly shaped by nuanced technical and user-experience considerations. A central debate involves comparing on-device vs cloud AI processing, with a clear trend toward hybrid models to balance privacy and power.
  • The impact of Matter standard on speaker utility is profound, transforming standalone devices into true home automation hubs and eliminating ecosystem fragmentation. This is pushing the role of Thread border routers in speakers from a niche feature to a core component for robust IoT connectivity.
  • Concurrently, the rise of generative AI for personalized content creation is redefining user engagement, allowing for unique interactions like custom stories or music. However, this raises the privacy implications of advanced voice assistants, compelling vendors to invest in voice biometrics security and transparent data policies.
  • Key growth vectors include using AI speakers for ambient health monitoring and the integration of voice assistants in automotive settings, extending the ecosystem beyond the home. Addressing market challenges from AI model unreliability is now critical; mitigating AI hallucinations in voice response is a top R&D priority, with some systems improving factual accuracy by over 30% through retrieval-augmented generation.
  • Success now depends on a holistic strategy encompassing everything from high-fidelity audio in smart speaker design to developing localized AI for emerging markets.

What are the key market drivers leading to the rise in the adoption of AI Speakers Industry?

  • The integration of advanced generative AI and large language models is a key driver transforming AI speakers into more conversational and capable assistants.

  • Market growth is driven by a technological leap in core intelligence and ecosystem utility. The integration of large language models is enabling context-aware interaction and proactive assistance, transforming the user experience.
  • This AI evolution is attracting new user segments, with some platforms reporting a 25% increase in engagement for complex, multi-step tasks.
  • The expansion of the smart home, unified by the Matter connectivity standard, makes the AI speaker a critical home automation hub.
  • As consumers add more connected devices, the value of a centralized command center with a voice-activated user interface increases significantly. Furthermore, the demand for premium, high-fidelity audio, supported by advanced acoustic engineering and high-fidelity audio drivers, is creating higher-margin opportunities.
  • This is complemented by the growth of multi-modal interfaces, where smart display functionality broadens use cases for everything from video calls to recipe tutorials.

What are the market trends shaping the AI Speakers Industry?

  • The proliferation of generative AI is driving a shift toward multimodal functionality, redefining user interaction with AI-powered devices. This evolution is reshaping expectations for conversational intelligence and context-aware capabilities.

  • Key market trends are converging to create more intelligent and autonomous devices. The move toward a privacy-preserving architecture is accelerating, with on-device processing reducing reliance on the cloud by up to 40% for common commands. This complements the expansion of the interoperable smart home, where seamless ecosystem integration is paramount.
  • The incorporation of premium audio components and sophisticated digital signal processors is creating a distinct high-fidelity segment, appealing to users seeking audiophile-grade sound. This focus on audio-visual products enhances the cinematic audio experience in soundbars. Concurrently, the development of conversational AI companions is making interactions more natural.
  • However, this advanced functionality requires a robust data governance framework to maintain user trust, especially as these devices find use in sensitive areas like ambient health monitoring and automotive voice control.

What challenges does the AI Speakers Industry face during its growth?

  • Intensifying scrutiny over data privacy and security presents a key challenge, potentially impeding consumer trust and market growth.

  • The market faces significant hurdles that temper its growth trajectory, primarily centered on trust and commoditization. Intensifying scrutiny over data privacy has created a consumer trust deficit, with surveys indicating that over 50% of non-adopters cite security as their main concern.
  • This challenge is magnified by AI-induced hallucinations from new generative models, undermining device reliability and demanding sophisticated fact-checking mechanisms and retrieval-augmented generation systems. In mature markets, market saturation challenges are leading to slowing sales and intense price competition, eroding margins.
  • The core utility of many devices has become a set of commoditized hardware functions, making it difficult to convince users to upgrade, contributing to lengthening device replacement cycles. This forces a difficult quest for meaningful innovation beyond incremental improvements, pushing companies to invest heavily in next-generation conversational AI to prove tangible new value and escape the cycle of price-based competition.

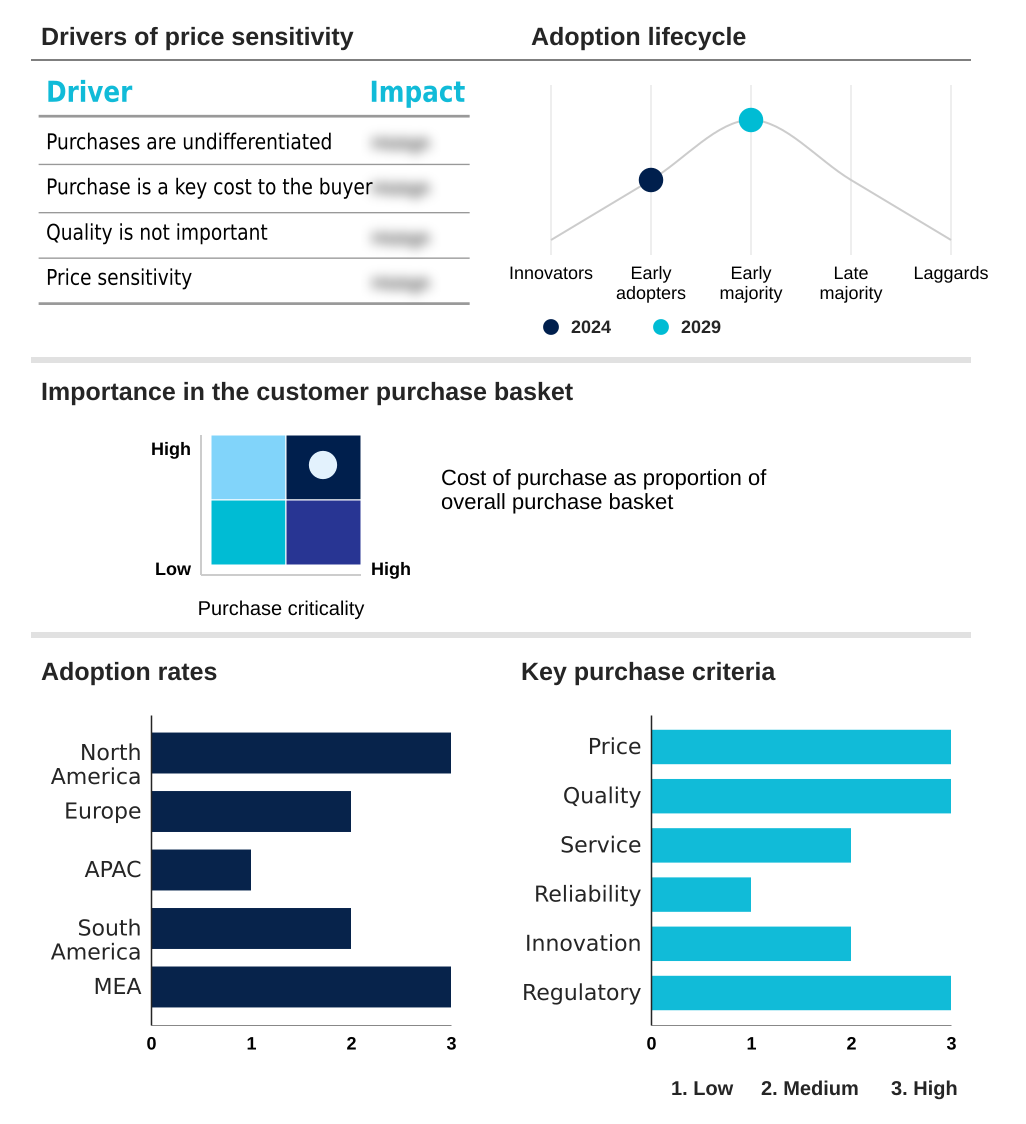
Exclusive Technavio Analysis on Customer Landscape

The ai speakers market forecasting report includes the adoption lifecycle of the market, covering from the innovator’s stage to the laggard’s stage. It focuses on adoption rates in different regions based on penetration. Furthermore, the ai speakers market report also includes key purchase criteria and drivers of price sensitivity to help companies evaluate and develop their market growth analysis strategies.

Customer Landscape of AI Speakers Industry

Competitive Landscape

Companies are implementing various strategies, such as strategic alliances, ai speakers market forecast, partnerships, mergers and acquisitions, geographical expansion, and product/service launches, to enhance their presence in the industry.

Amazon.com Inc. - Core offerings center on voice-assistant-powered hardware, enabling expansive smart home and media control ecosystems.

The industry research and growth report includes detailed analyses of the competitive landscape of the market and information about key companies, including:

  • Amazon.com Inc.
  • Anker Technology UK Ltd.
  • Apple Inc.
  • Bang and Olufsen Group
  • Bose Corp.
  • Google LLC
  • Huawei Technologies Co. Ltd.
  • LG Electronics Inc.
  • Panasonic Holdings Corp.
  • Samsung Electronics Co. Ltd.
  • Sonos Inc.
  • Sonova AG
  • Sony Group Corp.
  • Xiaomi Inc.
  • Yandex NV

Qualitative and quantitative analysis of companies has been conducted to help clients understand the wider business environment as well as the strengths and weaknesses of key industry players. Data is qualitatively analyzed to categorize companies as pure play, category-focused, industry-focused, and diversified; it is quantitatively analyzed to categorize companies as dominant, leading, strong, tentative, and weak.

Recent Development and News in Ai speakers market

  • In September, 2024, Sonova AG unveils a new line of premium AI speakers featuring advanced on-device processing and robust voice biometrics, aiming to capture the privacy-conscious consumer segment with high-fidelity audio.
  • In November, 2024, Google LLC announces a strategic partnership with a leading healthcare consortium to pilot ambient health monitoring services through its Nest Hub devices in assisted living facilities across North America.
  • In January, 2025, The Connectivity Standards Alliance officially releases the Matter 1.4 specification, introducing standardized support for home energy management systems and advanced appliances, enhancing the role of AI speakers as central home controllers.
  • In April, 2025, Xiaomi Inc. launches a new range of affordable AI speakers with integrated Thread border routers and enhanced local language support, targeting rapid market penetration in India and Southeast Asia.

Dive into Technavio’s robust research methodology, blending expert interviews, extensive data synthesis, and validated models for unparalleled AI Speakers Market insights. See full methodology.

Market Scope
Page number 296
Base year 2024
Historic period 2019-2023
Forecast period 2025-2029
Growth momentum & CAGR Accelerate at a CAGR of 23.1%
Market growth 2025-2029 USD 12691.2 million
Market structure Fragmented
YoY growth 2024-2025(%) 20.8%
Key countries US, Canada, Mexico, Germany, UK, France, Italy, Spain, The Netherlands, China, India, Japan, South Korea, Australia, Indonesia, Brazil, Argentina, Colombia, UAE, Saudi Arabia, South Africa, Israel and Turkey
Competitive landscape Leading Companies, Market Positioning of Companies, Competitive Strategies, and Industry Risks

Request Free Sample

Research Analyst Overview

  • The AI speakers market is undergoing a critical transformation, shifting from hardware-centric sales to a model predicated on the intelligence and utility of the underlying voice assistant platforms. This evolution is driven by generative AI integration, which enables more natural, multi-turn dialogue and user intent inference.
  • A key boardroom consideration is the pivot to on-device AI processing and custom silicon design, a direct response to consumer privacy demands and stringent data governance frameworks that can impact market access.
  • This move toward edge AI capabilities reduces reliance on the hybrid cloud model and improves low-latency response, with some advanced microphone arrays and system-on-chip processors achieving a 20% faster wake-word detection. The focus on computational audio technology and high-fidelity audio drivers continues to segment the market, creating premium tiers.
  • Meanwhile, the maturation of the Matter connectivity standard is making devices with integrated Thread border routers indispensable as a home automation hub, simplifying IoT device integration and fostering a cohesive ambient computing ecosystem through natural language processing.

What are the Key Data Covered in this AI Speakers Market Research and Growth Report?

  • What is the expected growth of the AI Speakers Market between 2025 and 2029?

    • USD 12.69 billion, at a CAGR of 23.1%

  • What segmentation does the market report cover?

    • The report is segmented by Product Type (Smart speaker, Portable AI speaker, Soundbars with voice assistant), Component (Hardware, Software, Services), Connectivity (Wi-Fi, Bluetooth, Cellular or LTE, Others) and Geography (North America, Europe, APAC, South America, Middle East and Africa)

  • Which regions are analyzed in the report?

    • North America, Europe, APAC, South America and Middle East and Africa

  • What are the key growth drivers and market challenges?

    • Integration of advanced generative AI and large language models, Intensifying data privacy and security scrutiny

  • Who are the major players in the AI Speakers Market?

    • Amazon.com Inc., Anker Technology UK Ltd., Apple Inc., Bang and Olufsen Group, Bose Corp., Google LLC, Huawei Technologies Co. Ltd., LG Electronics Inc., Panasonic Holdings Corp., Samsung Electronics Co. Ltd., Sonos Inc., Sonova AG, Sony Group Corp., Xiaomi Inc. and Yandex NV

Market Research Insights

  • Market dynamics are shaped by the pivot toward subscription-based services and B2B vertical applications, which promise new revenue streams beyond hardware sales. The focus on creating an interoperable smart home, where devices offer cross-platform compatibility, has seen some integrations improve multi-device setup times by over 40%.
  • While smart display functionality enhances user engagement, challenges from AI-induced hallucinations and the consumer trust deficit require robust fact-checking mechanisms. The reliance on cloud-dependent processing is diminishing in favor of privacy-preserving architecture. Firms are navigating device replacement cycles in saturated markets by offering audiophile-grade sound and tangible software-defined features.
  • This strategic shift from commoditized hardware functions to developing conversational AI companions has improved user retention by 25% in certain premium segments, illustrating a move toward qualitative enhancements over quantitative expansion.

We can help! Our analysts can customize this ai speakers market research report to meet your requirements.

Get in touch

1. Executive Summary

1.1 Market overview

Executive Summary - Chart on Market Overview
Executive Summary - Data Table on Market Overview
Executive Summary - Chart on Global Market Characteristics
Executive Summary - Chart on Market by Geography
Executive Summary - Chart on Market Segmentation by Product Type
Executive Summary - Chart on Market Segmentation by Component
Executive Summary - Chart on Market Segmentation by Connectivity
Executive Summary - Chart on Incremental Growth
Executive Summary - Data Table on Incremental Growth
Executive Summary - Chart on Company Market Positioning

2. Technavio Analysis

2.1 Analysis of price sensitivity, lifecycle, customer purchase basket, adoption rates, and purchase criteria

2.2 Criticality of inputs and Factors of differentiation

Chart on Overview on criticality of inputs and factors of differentiation

2.3 Factors of disruption

Chart on Overview on factors of disruption

2.4 Impact of drivers and challenges

Chart on Impact of drivers and challenges in 2024 and 2029

3. Market Landscape

3.1 Market ecosystem

Chart on Parent Market
Data Table on - Parent Market

3.2 Market characteristics

Chart on Market characteristics analysis

3.3 Value chain analysis

Chart on Value chain analysis

4. Market Sizing

4.1 Market definition

Data Table on Offerings of companies included in the market definition

4.2 Market segment analysis

Market segments

4.3 Market size 2024

4.4 Market outlook: Forecast for 2024-2029

Chart on Global - Market size and forecast 2024-2029 ($ million)
Data Table on Global - Market size and forecast 2024-2029 ($ million)
Chart on Global Market: Year-over-year growth 2024-2029 (%)
Data Table on Global Market: Year-over-year growth 2024-2029 (%)

5. Historic Market Size

5.1 Global AI Speakers Market 2019 - 2023

Historic Market Size - Data Table on Global AI Speakers Market 2019 - 2023 ($ million)

5.2 Product Type segment analysis 2019 - 2023

Historic Market Size - Product Type Segment 2019 - 2023 ($ million)

5.3 Component segment analysis 2019 - 2023

Historic Market Size - Component Segment 2019 - 2023 ($ million)

5.4 Connectivity segment analysis 2019 - 2023

Historic Market Size - Connectivity Segment 2019 - 2023 ($ million)

5.5 Geography segment analysis 2019 - 2023

Historic Market Size - Geography Segment 2019 - 2023 ($ million)

5.6 Country segment analysis 2019 - 2023

Historic Market Size - Country Segment 2019 - 2023 ($ million)

6. Five Forces Analysis

6.1 Five forces summary

Five forces analysis - Comparison between 2024 and 2029

6.2 Bargaining power of buyers

Bargaining power of buyers - Impact of key factors 2024 and 2029

6.3 Bargaining power of suppliers

Bargaining power of suppliers - Impact of key factors in 2024 and 2029

6.4 Threat of new entrants

Threat of new entrants - Impact of key factors in 2024 and 2029

6.5 Threat of substitutes

Threat of substitutes - Impact of key factors in 2024 and 2029

6.6 Threat of rivalry

Threat of rivalry - Impact of key factors in 2024 and 2029

6.7 Market condition

Chart on Market condition - Five forces 2024 and 2029

7. Market Segmentation by Product Type

7.1 Market segments

Chart on Product Type - Market share 2024-2029 (%)
Data Table on Product Type - Market share 2024-2029 (%)

7.2 Comparison by Product Type

Chart on Comparison by Product Type
Data Table on Comparison by Product Type

7.3 Smart speaker - Market size and forecast 2024-2029

Chart on Smart speaker - Market size and forecast 2024-2029 ($ million)
Data Table on Smart speaker - Market size and forecast 2024-2029 ($ million)
Chart on Smart speaker - Year-over-year growth 2024-2029 (%)
Data Table on Smart speaker - Year-over-year growth 2024-2029 (%)

7.4 Portable AI speaker - Market size and forecast 2024-2029

Chart on Portable AI speaker - Market size and forecast 2024-2029 ($ million)
Data Table on Portable AI speaker - Market size and forecast 2024-2029 ($ million)
Chart on Portable AI speaker - Year-over-year growth 2024-2029 (%)
Data Table on Portable AI speaker - Year-over-year growth 2024-2029 (%)

7.5 Soundbars with voice assistant - Market size and forecast 2024-2029

Chart on Soundbars with voice assistant - Market size and forecast 2024-2029 ($ million)
Data Table on Soundbars with voice assistant - Market size and forecast 2024-2029 ($ million)
Chart on Soundbars with voice assistant - Year-over-year growth 2024-2029 (%)
Data Table on Soundbars with voice assistant - Year-over-year growth 2024-2029 (%)

7.6 Market opportunity by Product Type

Market opportunity by Product Type ($ million)
Data Table on Market opportunity by Product Type ($ million)

8. Market Segmentation by Component

8.1 Market segments

Chart on Component - Market share 2024-2029 (%)
Data Table on Component - Market share 2024-2029 (%)

8.2 Comparison by Component

Chart on Comparison by Component
Data Table on Comparison by Component

8.3 Hardware - Market size and forecast 2024-2029

Chart on Hardware - Market size and forecast 2024-2029 ($ million)
Data Table on Hardware - Market size and forecast 2024-2029 ($ million)
Chart on Hardware - Year-over-year growth 2024-2029 (%)
Data Table on Hardware - Year-over-year growth 2024-2029 (%)

8.4 Software - Market size and forecast 2024-2029

Chart on Software - Market size and forecast 2024-2029 ($ million)
Data Table on Software - Market size and forecast 2024-2029 ($ million)
Chart on Software - Year-over-year growth 2024-2029 (%)
Data Table on Software - Year-over-year growth 2024-2029 (%)

8.5 Services - Market size and forecast 2024-2029

Chart on Services - Market size and forecast 2024-2029 ($ million)
Data Table on Services - Market size and forecast 2024-2029 ($ million)
Chart on Services - Year-over-year growth 2024-2029 (%)
Data Table on Services - Year-over-year growth 2024-2029 (%)

8.6 Market opportunity by Component

Market opportunity by Component ($ million)
Data Table on Market opportunity by Component ($ million)

9. Market Segmentation by Connectivity

9.1 Market segments

Chart on Connectivity - Market share 2024-2029 (%)
Data Table on Connectivity - Market share 2024-2029 (%)

9.2 Comparison by Connectivity

Chart on Comparison by Connectivity
Data Table on Comparison by Connectivity

9.3 Wi-Fi - Market size and forecast 2024-2029

Chart on Wi-Fi - Market size and forecast 2024-2029 ($ million)
Data Table on Wi-Fi - Market size and forecast 2024-2029 ($ million)
Chart on Wi-Fi - Year-over-year growth 2024-2029 (%)
Data Table on Wi-Fi - Year-over-year growth 2024-2029 (%)

9.4 Bluetooth - Market size and forecast 2024-2029

Chart on Bluetooth - Market size and forecast 2024-2029 ($ million)
Data Table on Bluetooth - Market size and forecast 2024-2029 ($ million)
Chart on Bluetooth - Year-over-year growth 2024-2029 (%)
Data Table on Bluetooth - Year-over-year growth 2024-2029 (%)

9.5 Cellular or LTE - Market size and forecast 2024-2029

Chart on Cellular or LTE - Market size and forecast 2024-2029 ($ million)
Data Table on Cellular or LTE - Market size and forecast 2024-2029 ($ million)
Chart on Cellular or LTE - Year-over-year growth 2024-2029 (%)
Data Table on Cellular or LTE - Year-over-year growth 2024-2029 (%)

9.6 Others - Market size and forecast 2024-2029

Chart on Others - Market size and forecast 2024-2029 ($ million)
Data Table on Others - Market size and forecast 2024-2029 ($ million)
Chart on Others - Year-over-year growth 2024-2029 (%)
Data Table on Others - Year-over-year growth 2024-2029 (%)

9.7 Market opportunity by Connectivity

Market opportunity by Connectivity ($ million)
Data Table on Market opportunity by Connectivity ($ million)

10. Customer Landscape

10.1 Customer landscape overview

Analysis of price sensitivity, lifecycle, customer purchase basket, adoption rates, and purchase criteria

11. Geographic Landscape

11.1 Geographic segmentation

Chart on Market share by geography 2024-2029 (%)
Data Table on Market share by geography 2024-2029 (%)

11.2 Geographic comparison

Chart on Geographic comparison
Data Table on Geographic comparison

11.3 North America - Market size and forecast 2024-2029

Chart on North America - Market size and forecast 2024-2029 ($ million)
Data Table on North America - Market size and forecast 2024-2029 ($ million)
Chart on North America - Year-over-year growth 2024-2029 (%)
Data Table on North America - Year-over-year growth 2024-2029 (%)
Chart on Regional Comparison - North America
Data Table on Regional Comparison - North America

11.3.1 US - Market size and forecast 2024-2029

Chart on US - Market size and forecast 2024-2029 ($ million)
Data Table on US - Market size and forecast 2024-2029 ($ million)
Chart on US - Year-over-year growth 2024-2029 (%)
Data Table on US - Year-over-year growth 2024-2029 (%)

11.3.2 Canada - Market size and forecast 2024-2029

Chart on Canada - Market size and forecast 2024-2029 ($ million)
Data Table on Canada - Market size and forecast 2024-2029 ($ million)
Chart on Canada - Year-over-year growth 2024-2029 (%)
Data Table on Canada - Year-over-year growth 2024-2029 (%)

11.3.3 Mexico - Market size and forecast 2024-2029

Chart on Mexico - Market size and forecast 2024-2029 ($ million)
Data Table on Mexico - Market size and forecast 2024-2029 ($ million)
Chart on Mexico - Year-over-year growth 2024-2029 (%)
Data Table on Mexico - Year-over-year growth 2024-2029 (%)

11.4 Europe - Market size and forecast 2024-2029

Chart on Europe - Market size and forecast 2024-2029 ($ million)
Data Table on Europe - Market size and forecast 2024-2029 ($ million)
Chart on Europe - Year-over-year growth 2024-2029 (%)
Data Table on Europe - Year-over-year growth 2024-2029 (%)
Chart on Regional Comparison - Europe
Data Table on Regional Comparison - Europe

11.4.1 Germany - Market size and forecast 2024-2029

Chart on Germany - Market size and forecast 2024-2029 ($ million)
Data Table on Germany - Market size and forecast 2024-2029 ($ million)
Chart on Germany - Year-over-year growth 2024-2029 (%)
Data Table on Germany - Year-over-year growth 2024-2029 (%)

11.4.2 UK - Market size and forecast 2024-2029

Chart on UK - Market size and forecast 2024-2029 ($ million)
Data Table on UK - Market size and forecast 2024-2029 ($ million)
Chart on UK - Year-over-year growth 2024-2029 (%)
Data Table on UK - Year-over-year growth 2024-2029 (%)

11.4.3 France - Market size and forecast 2024-2029

Chart on France - Market size and forecast 2024-2029 ($ million)
Data Table on France - Market size and forecast 2024-2029 ($ million)
Chart on France - Year-over-year growth 2024-2029 (%)
Data Table on France - Year-over-year growth 2024-2029 (%)

11.4.4 Italy - Market size and forecast 2024-2029

Chart on Italy - Market size and forecast 2024-2029 ($ million)
Data Table on Italy - Market size and forecast 2024-2029 ($ million)
Chart on Italy - Year-over-year growth 2024-2029 (%)
Data Table on Italy - Year-over-year growth 2024-2029 (%)

11.4.5 Spain - Market size and forecast 2024-2029

Chart on Spain - Market size and forecast 2024-2029 ($ million)
Data Table on Spain - Market size and forecast 2024-2029 ($ million)
Chart on Spain - Year-over-year growth 2024-2029 (%)
Data Table on Spain - Year-over-year growth 2024-2029 (%)

11.4.6 The Netherlands - Market size and forecast 2024-2029

Chart on The Netherlands - Market size and forecast 2024-2029 ($ million)
Data Table on The Netherlands - Market size and forecast 2024-2029 ($ million)
Chart on The Netherlands - Year-over-year growth 2024-2029 (%)
Data Table on The Netherlands - Year-over-year growth 2024-2029 (%)

11.5 APAC - Market size and forecast 2024-2029

Chart on APAC - Market size and forecast 2024-2029 ($ million)
Data Table on APAC - Market size and forecast 2024-2029 ($ million)
Chart on APAC - Year-over-year growth 2024-2029 (%)
Data Table on APAC - Year-over-year growth 2024-2029 (%)
Chart on Regional Comparison - APAC
Data Table on Regional Comparison - APAC

11.5.1 China - Market size and forecast 2024-2029

Chart on China - Market size and forecast 2024-2029 ($ million)
Data Table on China - Market size and forecast 2024-2029 ($ million)
Chart on China - Year-over-year growth 2024-2029 (%)
Data Table on China - Year-over-year growth 2024-2029 (%)

11.5.2 India - Market size and forecast 2024-2029

Chart on India - Market size and forecast 2024-2029 ($ million)
Data Table on India - Market size and forecast 2024-2029 ($ million)
Chart on India - Year-over-year growth 2024-2029 (%)
Data Table on India - Year-over-year growth 2024-2029 (%)

11.5.3 Japan - Market size and forecast 2024-2029

Chart on Japan - Market size and forecast 2024-2029 ($ million)
Data Table on Japan - Market size and forecast 2024-2029 ($ million)
Chart on Japan - Year-over-year growth 2024-2029 (%)
Data Table on Japan - Year-over-year growth 2024-2029 (%)

11.5.4 South Korea - Market size and forecast 2024-2029

Chart on South Korea - Market size and forecast 2024-2029 ($ million)
Data Table on South Korea - Market size and forecast 2024-2029 ($ million)
Chart on South Korea - Year-over-year growth 2024-2029 (%)
Data Table on South Korea - Year-over-year growth 2024-2029 (%)

11.5.5 Australia - Market size and forecast 2024-2029

Chart on Australia - Market size and forecast 2024-2029 ($ million)
Data Table on Australia - Market size and forecast 2024-2029 ($ million)
Chart on Australia - Year-over-year growth 2024-2029 (%)
Data Table on Australia - Year-over-year growth 2024-2029 (%)

11.5.6 Indonesia - Market size and forecast 2024-2029

Chart on Indonesia - Market size and forecast 2024-2029 ($ million)
Data Table on Indonesia - Market size and forecast 2024-2029 ($ million)
Chart on Indonesia - Year-over-year growth 2024-2029 (%)
Data Table on Indonesia - Year-over-year growth 2024-2029 (%)

11.6 South America - Market size and forecast 2024-2029

Chart on South America - Market size and forecast 2024-2029 ($ million)
Data Table on South America - Market size and forecast 2024-2029 ($ million)
Chart on South America - Year-over-year growth 2024-2029 (%)
Data Table on South America - Year-over-year growth 2024-2029 (%)
Chart on Regional Comparison - South America
Data Table on Regional Comparison - South America

11.6.1 Brazil - Market size and forecast 2024-2029

Chart on Brazil - Market size and forecast 2024-2029 ($ million)
Data Table on Brazil - Market size and forecast 2024-2029 ($ million)
Chart on Brazil - Year-over-year growth 2024-2029 (%)
Data Table on Brazil - Year-over-year growth 2024-2029 (%)

11.6.2 Argentina - Market size and forecast 2024-2029

Chart on Argentina - Market size and forecast 2024-2029 ($ million)
Data Table on Argentina - Market size and forecast 2024-2029 ($ million)
Chart on Argentina - Year-over-year growth 2024-2029 (%)
Data Table on Argentina - Year-over-year growth 2024-2029 (%)

11.6.3 Colombia - Market size and forecast 2024-2029

Chart on Colombia - Market size and forecast 2024-2029 ($ million)
Data Table on Colombia - Market size and forecast 2024-2029 ($ million)
Chart on Colombia - Year-over-year growth 2024-2029 (%)
Data Table on Colombia - Year-over-year growth 2024-2029 (%)

11.7 Middle East and Africa - Market size and forecast 2024-2029

Chart on Middle East and Africa - Market size and forecast 2024-2029 ($ million)
Data Table on Middle East and Africa - Market size and forecast 2024-2029 ($ million)
Chart on Middle East and Africa - Year-over-year growth 2024-2029 (%)
Data Table on Middle East and Africa - Year-over-year growth 2024-2029 (%)
Chart on Regional Comparison - Middle East and Africa
Data Table on Regional Comparison - Middle East and Africa

11.7.1 UAE - Market size and forecast 2024-2029

Chart on UAE - Market size and forecast 2024-2029 ($ million)
Data Table on UAE - Market size and forecast 2024-2029 ($ million)
Chart on UAE - Year-over-year growth 2024-2029 (%)
Data Table on UAE - Year-over-year growth 2024-2029 (%)

11.7.2 Saudi Arabia - Market size and forecast 2024-2029

Chart on Saudi Arabia - Market size and forecast 2024-2029 ($ million)
Data Table on Saudi Arabia - Market size and forecast 2024-2029 ($ million)
Chart on Saudi Arabia - Year-over-year growth 2024-2029 (%)
Data Table on Saudi Arabia - Year-over-year growth 2024-2029 (%)

11.7.3 South Africa - Market size and forecast 2024-2029

Chart on South Africa - Market size and forecast 2024-2029 ($ million)
Data Table on South Africa - Market size and forecast 2024-2029 ($ million)
Chart on South Africa - Year-over-year growth 2024-2029 (%)
Data Table on South Africa - Year-over-year growth 2024-2029 (%)

11.7.4 Israel - Market size and forecast 2024-2029

Chart on Israel - Market size and forecast 2024-2029 ($ million)
Data Table on Israel - Market size and forecast 2024-2029 ($ million)
Chart on Israel - Year-over-year growth 2024-2029 (%)
Data Table on Israel - Year-over-year growth 2024-2029 (%)

11.7.5 Turkey - Market size and forecast 2024-2029

Chart on Turkey - Market size and forecast 2024-2029 ($ million)
Data Table on Turkey - Market size and forecast 2024-2029 ($ million)
Chart on Turkey - Year-over-year growth 2024-2029 (%)
Data Table on Turkey - Year-over-year growth 2024-2029 (%)

11.8 Market opportunity by geography

Market opportunity by geography ($ million)
Data Tables on Market opportunity by geography ($ million)

12. Drivers, Challenges, and Opportunity

12.1 Market drivers

Integration of advanced generative AI and large language models
Expansion of smart home ecosystem and maturation of interoperability standards
Increasing demand for high-fidelity audio and multi-modal experiences

12.2 Market challenges

Intensifying data privacy and security scrutiny
Market saturation in developed regions and quest for meaningful innovation
AI-induced reliability and trust issues in era of generative AI

12.3 Impact of drivers and challenges

Impact of drivers and challenges in 2024 and 2029

12.4 Market opportunities

Proliferation of generative AI and multimodal functionality
Prioritization of on-device processing for enhanced privacy and security
Deepening integration with matter and ambient computing ecosystem

13. Competitive Landscape

13.1 Overview

13.2

Overview on criticality of inputs and factors of differentiation

13.3 Landscape disruption

Overview on factors of disruption

13.4 Industry risks

Impact of key risks on business

14. Competitive Analysis

14.1 Companies profiled

Companies covered

14.2 Company ranking index

14.3 Market positioning of companies

Matrix on companies position and classification

14.4 Amazon.com Inc.

Amazon.com Inc. - Overview
Amazon.com Inc. - Business segments
Amazon.com Inc. - Key news
Amazon.com Inc. - Key offerings
Amazon.com Inc. - Segment focus
SWOT

14.5 Anker Technology UK Ltd.

Anker Technology UK Ltd. - Overview
Anker Technology UK Ltd. - Product / Service
Anker Technology UK Ltd. - Key offerings
SWOT

14.6 Apple Inc.

Apple Inc. - Overview
Apple Inc. - Business segments
Apple Inc. - Key news
Apple Inc. - Key offerings
Apple Inc. - Segment focus
SWOT

14.7 Bang and Olufsen Group

Bang and Olufsen Group - Overview
Bang and Olufsen Group - Business segments
Bang and Olufsen Group - Key offerings
Bang and Olufsen Group - Segment focus
SWOT

14.8 Bose Corp.

Bose Corp. - Overview
Bose Corp. - Product / Service
Bose Corp. - Key news
Bose Corp. - Key offerings
SWOT

14.9 Google LLC

Google LLC - Overview
Google LLC - Product / Service
Google LLC - Key offerings
SWOT

14.10 Huawei Technologies Co. Ltd.

Huawei Technologies Co. Ltd. - Overview
Huawei Technologies Co. Ltd. - Product / Service
Huawei Technologies Co. Ltd. - Key news
Huawei Technologies Co. Ltd. - Key offerings
SWOT

14.11 LG Electronics Inc.

LG Electronics Inc. - Overview
LG Electronics Inc. - Product / Service
LG Electronics Inc. - Key offerings
SWOT

14.12 Panasonic Holdings Corp.

Panasonic Holdings Corp. - Overview
Panasonic Holdings Corp. - Business segments
Panasonic Holdings Corp. - Key news
Panasonic Holdings Corp. - Key offerings
Panasonic Holdings Corp. - Segment focus
SWOT

14.13 Samsung Electronics Co. Ltd.

Samsung Electronics Co. Ltd. - Overview
Samsung Electronics Co. Ltd. - Business segments
Samsung Electronics Co. Ltd. - Key news
Samsung Electronics Co. Ltd. - Key offerings
Samsung Electronics Co. Ltd. - Segment focus
SWOT

14.14 Sonos Inc.

Sonos Inc. - Overview
Sonos Inc. - Product / Service
Sonos Inc. - Key news
Sonos Inc. - Key offerings
SWOT

14.15 Sonova AG

Sonova AG - Overview
Sonova AG - Business segments
Sonova AG - Key offerings
Sonova AG - Segment focus
SWOT

14.16 Sony Group Corp.

Sony Group Corp. - Overview
Sony Group Corp. - Business segments
Sony Group Corp. - Key offerings
Sony Group Corp. - Segment focus
SWOT

14.17 Xiaomi Inc.

Xiaomi Inc. - Overview
Xiaomi Inc. - Business segments
Xiaomi Inc. - Key news
Xiaomi Inc. - Key offerings
Xiaomi Inc. - Segment focus
SWOT

14.18 Yandex NV

Yandex NV - Overview
Yandex NV - Product / Service
Yandex NV - Key offerings
SWOT

15. Appendix

15.1 Scope of the report

Market definition
Objectives
Notes and caveats

15.2 Inclusions and exclusions checklist

Inclusions checklist
Exclusions checklist

15.3 Currency conversion rates for US$

15.4 Research methodology

15.5 Data procurement

Information sources

15.6 Data validation

15.7 Validation techniques employed for market sizing

15.8 Data synthesis

15.9 360 degree market analysis

15.10 List of abbreviations

Research Methodology

Technavio presents a detailed picture of the market by way of study, synthesis, and summation of data from multiple sources. The analysts have presented the various facets of the market with a particular focus on identifying the key industry influencers. The data thus presented is comprehensive, reliable, and the result of extensive research, both primary and secondary.

INFORMATION SOURCES

Primary sources

  • Manufacturers and suppliers
  • Channel partners
  • Industry experts
  • Strategic decision makers

Secondary sources

  • Industry journals and periodicals
  • Government data
  • Financial reports of key industry players
  • Historical data
  • Press releases

DATA ANALYSIS

Data Synthesis

  • Collation of data
  • Estimation of key figures
  • Analysis of derived insights

Data Validation

  • Triangulation with data models
  • Reference against proprietary databases
  • Corroboration with industry experts

REPORT WRITING

Qualitative

  • Market drivers
  • Market challenges
  • Market trends
  • Five forces analysis

Quantitative

  • Market size and forecast
  • Market segmentation
  • Geographical insights
  • Competitive landscape

Interested in this report?

Get your sample now to see our research methodology and insights!

Download Now

Frequently Asked Questions

AI Speakers market growth will increase by USD 12691.2 million during 2025-2029.

The AI Speakers market is expected to grow at a CAGR of 23.1% during 2025-2029.

AI Speakers market is segmented by Product type (Smart speaker, Portable AI speaker, Soundbars with voice assistant) Component (Hardware, Software, Services) Connectivity (Wi-Fi, Bluetooth, Cellular or LTE, Others)

Amazon.com Inc., Anker Technology UK Ltd., Apple Inc., Bang and Olufsen Group, Bose Corp., Google LLC, Huawei Technologies Co. Ltd., LG Electronics Inc., Panasonic Holdings Corp., Samsung Electronics Co. Ltd., Sonos Inc., Sonova AG, Sony Group Corp., Xiaomi Inc., Yandex NV are a few of the key vendors in the AI Speakers market.

North America will register the highest growth rate of 31.4% among the other regions. Therefore, the AI Speakers market in North America is expected to garner significant business opportunities for the vendors during the forecast period.

US, Canada, Mexico, Germany, UK, France, Italy, Spain, The Netherlands, China, India, Japan, South Korea, Australia, Indonesia, Brazil, Argentina, Colombia, UAE, Saudi Arabia, South Africa, Israel, Turkey

  • Integration of advanced generative AI and large language models is the driving factor this market.

The AI Speakers market vendors should focus on grabbing business opportunities from the Product type segment as it accounted for the largest market share in the base year.