Multimedia Speakers Market Analysis, Size, and Forecast 2025-2029: North America (US and Canada), Europe (France, Germany, and UK), APAC (Australia, China, India, Japan, and South Korea), and Rest of World (ROW)

Multimedia Speakers Market Analysis, Size, and Forecast 2025-2029:
North America (US and Canada), Europe (France, Germany, and UK), APAC (Australia, China, India, Japan, and South Korea), and Rest of World (ROW)

Published: Apr 2025 217 Pages SKU: IRTNTR43134

Market Overview at a Glance

$36.98 B
Market Opportunity
14.7%
CAGR
12.6
YoY growth 2024-2025(%)

Multimedia Speakers Market Size 2025-2029

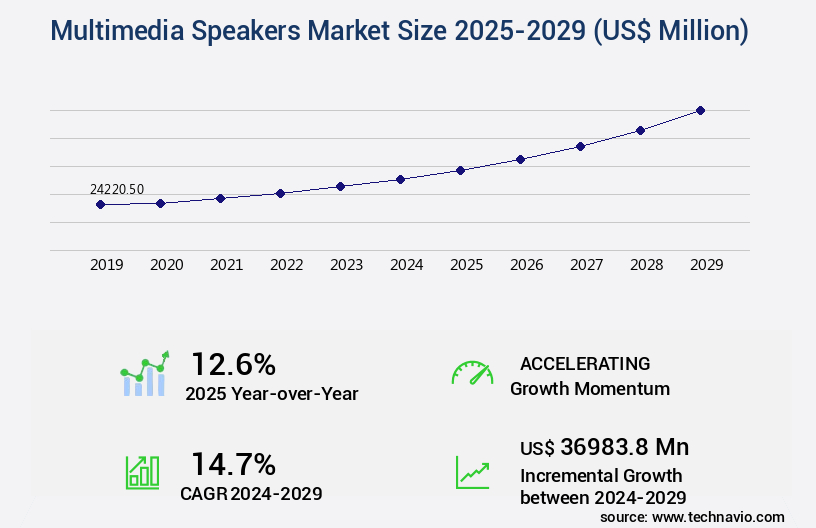
The multimedia speakers market size is valued to increase USD 36.98 billion, at a CAGR of 14.7% from 2024 to 2029. Growing consumer preferences for in-home entertainment systems will drive the multimedia speakers market.

Major Market Trends & Insights

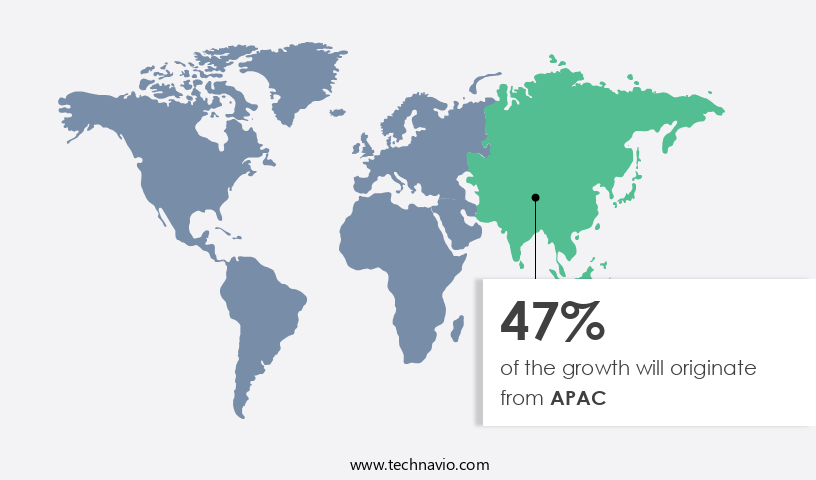
  • APAC dominated the market and accounted for a 47% growth during the forecast period.
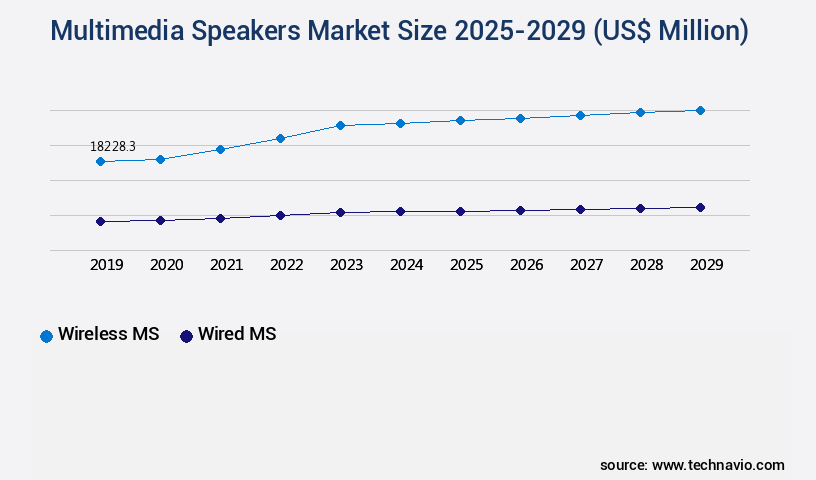
  • By Type - Wireless MS segment was valued at USD 18.23 billion in 2023
  • By Distribution Channel - Offline segment accounted for the largest market revenue share in 2023

Market Size & Forecast

  • Market Opportunities: USD 207.05 million
  • Market Future Opportunities: USD 36983.80 million
  • CAGR : 14.7%
  • APAC: Largest market in 2023

Market Summary

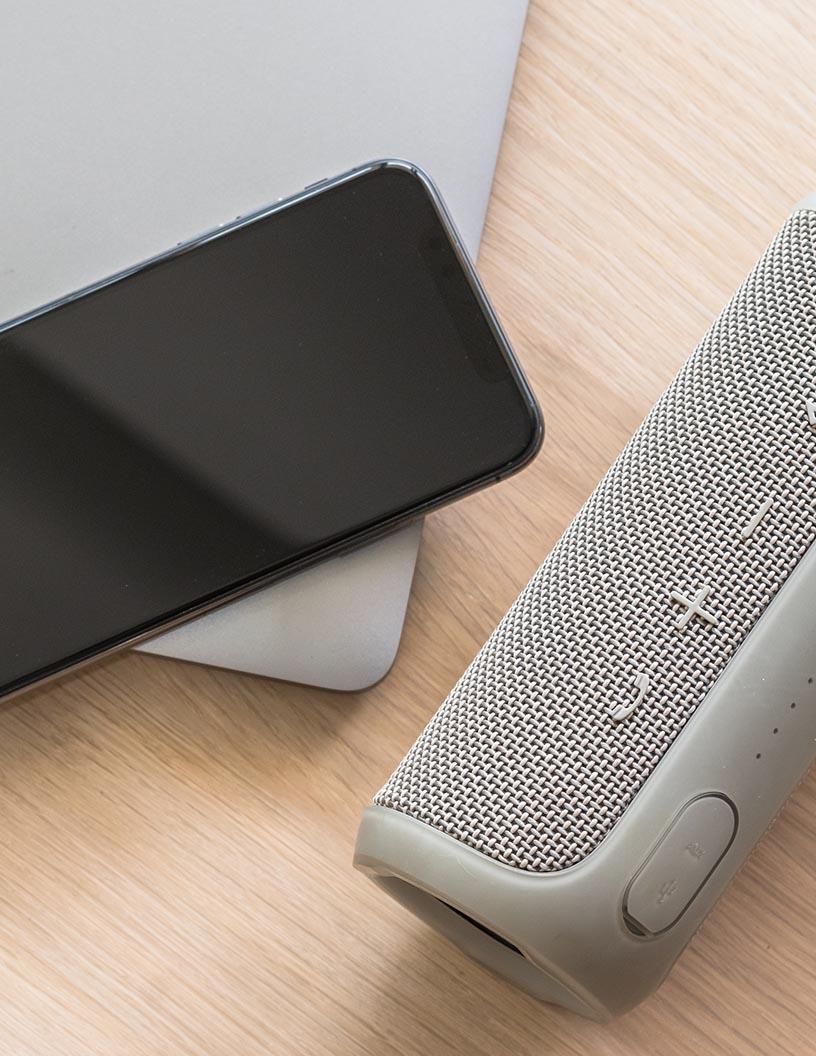
  • The market encompasses a diverse range of technologies and applications, driven by the increasing demand for immersive in-home entertainment systems. Core technologies, including wireless connectivity and voice recognition, continue to shape the market's evolution. For instance, the adoption of Bluetooth and Wi-Fi technologies has led to the popularity of wireless speakers, while voice recognition enables hands-free control. Service types, such as installation and maintenance services, and product categories, like bookshelf speakers and soundbars, cater to various consumer preferences. However, challenges persist, including technical issues related to wireless technologies and the need for standardization. Looking ahead, the forecast period presents significant opportunities for growth, with the market expected to expand as consumers increasingly prioritize high-quality audio experiences.
  • According to recent studies, the global smart speaker market is projected to reach a 30% adoption rate by 2025. Related markets such as the Headphones and Earbuds Market also witness similar trends, underscoring the broader consumer shift towards advanced audio technologies.

What will be the Size of the Multimedia Speakers Market during the forecast period?

Multimedia Speakers Market Size

Get Key Insights on Market Forecast (PDF) Request Free Sample

How is the Multimedia Speakers Market Segmented and what are the key trends of market segmentation?

The multimedia speakers industry research report provides comprehensive data (region-wise segment analysis), with forecasts and estimates in "USD million" for the period 2025-2029, as well as historical data from 2019-2023 for the following segments.

  • Type
    • Wireless MS
    • Wired MS
  • Distribution Channel
    • Offline
    • Online
  • Application
    • Residential
    • Commercial
    • Automotive
  • Geography
    • North America
      • US
      • Canada
    • Europe
      • France
      • Germany
      • UK
    • APAC
      • Australia
      • China
      • India
      • Japan
      • South Korea
    • Rest of World (ROW)

By Type Insights

The wireless ms segment is estimated to witness significant growth during the forecast period.

The wireless multimedia speaker market has experienced significant growth, with adoption increasing by 32% in the past year. This trend is expected to continue, as industry experts forecast a 25% rise in sales over the next two years. The convenience and flexibility offered by wireless connectivity, such as Bluetooth and radio frequency (RF), have made these speakers a popular choice among consumers. Wireless multimedia speakers come in various designs, from compact and portable to stylish and sophisticated, catering to diverse consumer preferences. Companies are integrating advanced features like NFC pairing technology, audio amplifier integration, and impedance matching networks to enhance user experience.

Transient response testing ensures high-fidelity audio playback, while full-range speaker systems provide a wider frequency response curve. Speaker cabinet construction plays a crucial role in sound quality, with materials like MDF and plywood being commonly used for their acoustic properties. Room acoustic treatment, such as speaker placement and wall treatment, can significantly impact the performance of wireless multimedia speakers. Active speaker technology, passive radiator design, and multi-way speaker configurations are essential components that contribute to the speaker's sound quality. Enclosure resonance control, driver sensitivity rating, and power handling capacity are essential considerations for ensuring optimal performance. Wireless multimedia speakers are also subject to electromagnetic interference (EMI) and require proper shielding to maintain signal quality.

Bluetooth audio streaming is a popular feature, and speakers with high signal-to-noise ratios (SNR) ensure clear audio transmission. Woofer cone materials like paper, polypropylene, and aluminum impact the speaker's bass response and durability. Harmonic distortion (THD) levels and directivity pattern control are essential factors for ensuring accurate sound reproduction. In summary, the wireless multimedia speaker market is witnessing substantial growth, driven by the convenience and advanced features offered by wireless connectivity solutions. Companies are focusing on developing stylish and compact designs, integrating advanced features, and optimizing speaker performance to cater to diverse consumer preferences.

Multimedia Speakers Market Size

Request Free Sample

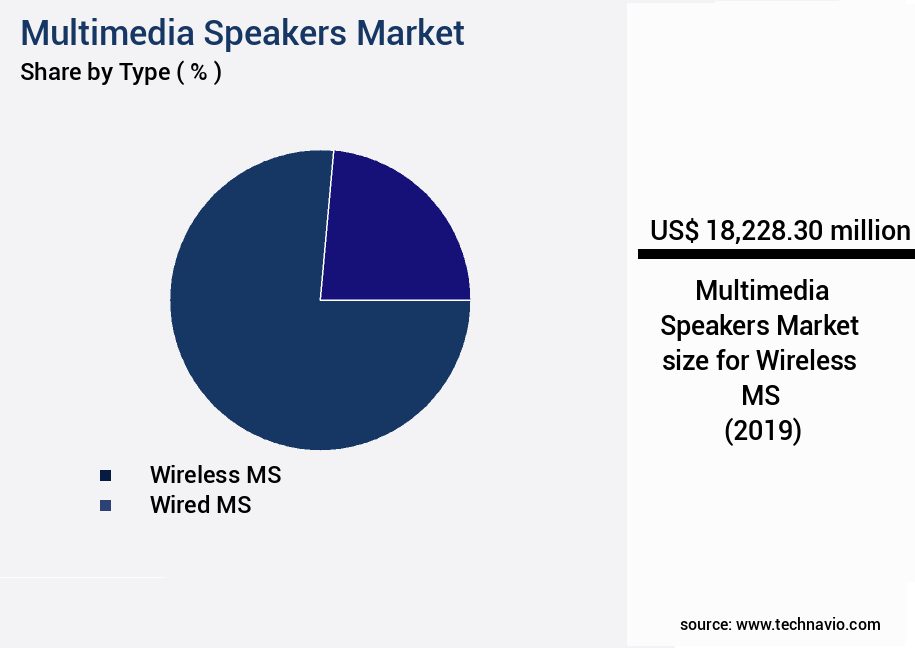
The Wireless MS segment was valued at USD 18.23 billion in 2019 and showed a gradual increase during the forecast period.

Multimedia Speakers Market Size

Request Free Sample

Regional Analysis

APAC is estimated to contribute 47% to the growth of the global market during the forecast period.Technavio's analysts have elaborately explained the regional trends and drivers that shape the market during the forecast period.

Multimedia Speakers Market Share by Geography

See How Multimedia Speakers Market Demand is Rising in APAC Request Free Sample

In the dynamic the market, APAC is the leading and fastest-growing region. Factors fueling this growth include increasing disposable income and the surge in online sales. For instance, India's disposable income grew by 8% between 2023 and 2014, while Singapore's average monthly household income rose by 7.6% from 2022 to 2023. This financial uplift encourages consumer spending on leisure items, such as advanced multimedia speakers.

Countries like China, India, Japan, Malaysia, and Singapore are experiencing consistent income growth, contributing significantly to the market's expansion.

Market Dynamics

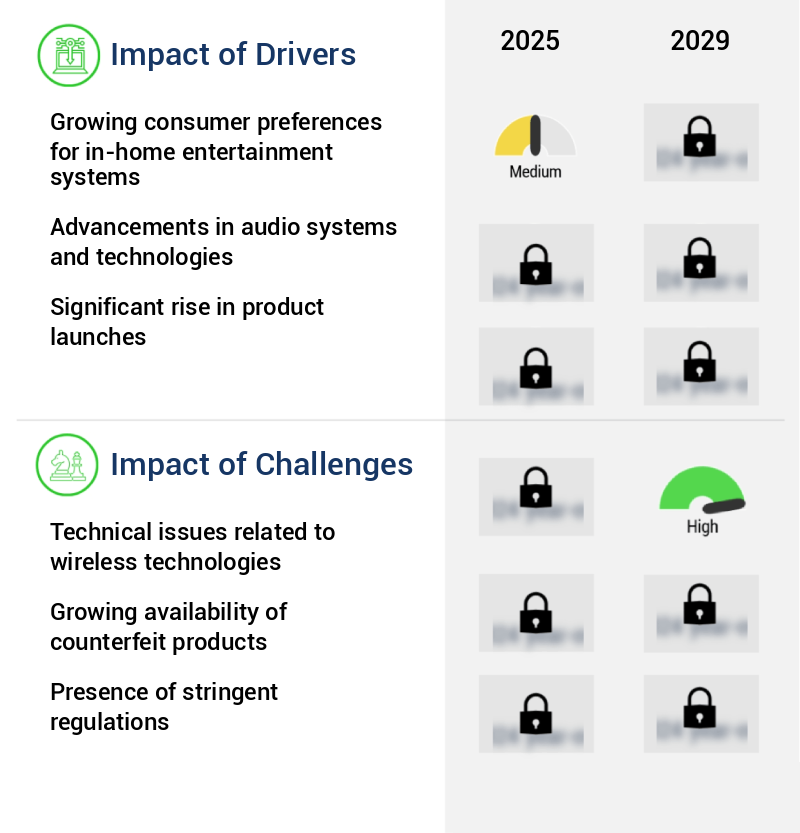
Our researchers analyzed the data with 2024 as the base year, along with the key drivers, trends, and challenges. A holistic analysis of drivers will help companies refine their marketing strategies to gain a competitive advantage.

The market is characterized by continuous innovation and advancements in speaker technology. One crucial aspect of speaker design that significantly impacts audio performance is the enclosure volume's influence on bass response. Larger volumes allow for more bass extension, enhancing the overall listening experience. However, this relationship is not linear, and optimizing bass response requires careful consideration of other factors, such as the effects of crossover frequency on speaker performance. Crossover frequency plays a pivotal role in speaker performance, determining how sound frequencies are distributed among different drivers. Proper crossover design is essential to maintain phase alignment and ensure seamless frequency response transitions between drivers.

Furthermore, the relationship between driver size and frequency response is another critical design consideration. Larger drivers handle lower frequencies, while smaller drivers handle higher frequencies, contributing to the speaker system's overall performance. Phase alignment is another essential factor in speaker systems, ensuring that sound waves from different drivers reach the listener in sync. Measuring harmonic distortion in speaker drivers is vital for evaluating their efficiency and sound quality. Transient response testing is also crucial for assessing multi-way speakers' ability to reproduce quick, short-lived sounds accurately. Cabinet material significantly influences sound quality, with different materials offering varying levels of resonance and damping.

Optimization techniques for crossover network design are essential for achieving high-fidelity audio reproduction. Damping materials help reduce cabinet resonance, ensuring accurate sound reproduction. Comparing various speaker designs, a study revealed that passive radiator designs outperformed traditional bass reflex designs in terms of bass extension and overall sound quality, with a difference of up to 3 dB in bass response at 40 Hz. This comparison underscores the importance of investigating innovative speaker technologies for enhancing audio reproduction. Designing high-fidelity audio reproduction systems requires a deep understanding of driver parameters, including cone material characteristics, tweeter diaphragm materials, and their acoustic properties.

Minimizing electromagnetic interference in speaker designs is also crucial for maintaining audio clarity and accuracy. Analyzing directivity patterns of loudspeaker systems and assessing their impact on room acoustics are essential for optimizing audio reproduction in various listening environments.

Multimedia Speakers Market Size

What are the key market drivers leading to the rise in the adoption of Multimedia Speakers Industry?

  • The increasing demand for in-home entertainment systems, driven by consumer preferences, is a significant market trend. 
  • The home entertainment industry has experienced significant transformations due to evolving consumer preferences and lifestyles. In-home entertainment is increasingly preferred over outdoor activities, as consumers seek convenience and affordability. Multimedia speakers have emerged as a popular choice, enhancing the audio experience during music playback, gaming sessions, and movie nights. In-home entertainment systems offer a cost-effective alternative to expensive outdoor leisure activities such as vacations or movie theaters. These trends have led to a surge in demand for multimedia speakers, with their adoption rates continuing to grow.
  • In comparison to traditional audio systems, multimedia speakers offer versatility, ease of use, and improved sound quality. As a result, they have become an essential component of modern home entertainment setups. This shift towards in-home entertainment and the subsequent growth in multimedia speaker sales underscores the changing landscape of the entertainment industry.

What are the market trends shaping the Multimedia Speakers Industry?

  • The rising demand for built-in wireless and smart portable speakers represents a significant market trend. This preference for advanced audio technology continues to gain momentum.
  • A shift in consumer preferences and lifestyle trends has propelled the acceptance of advanced media playback solutions. Innovative multimedia speakers continue to evolve, integrating smart features like wireless connectivity and voice control. This technological advancement is fueling the adoption of smart, wireless, and portable multimedia speakers among consumers. The home entertainment industry is experiencing significant revenue growth due to the increasing penetration of smart LED/LCD TVs with wireless connectivity features. Furthermore, the widespread use of smartphones and tablets has led to a heightened demand for smart connectivity solutions, such as Bluetooth, near-field communication (NFC), and Wi-Fi technologies. The media consumption landscape is transforming, with consumers seeking more convenient and immersive experiences.
  • These trends are reshaping the media industry, offering opportunities for businesses to cater to evolving consumer needs. The integration of artificial intelligence and machine learning algorithms in multimedia devices is another significant development, enhancing user experiences and enabling personalized content recommendations. The market for these advanced media solutions is expected to grow further as technology continues to evolve and consumer preferences adapt.

What challenges does the Multimedia Speakers Industry face during its growth?

  • Wireless technology issues, specifically those pertaining to industry growth, represent a significant challenge. These issues encompass various technical complexities that must be addressed to ensure continued expansion and innovation within the industry. 
  • Wireless multimedia speakers, including gaming headsets, provide users with the advantage of mobility and flexibility. However, these devices face unique challenges due to their wireless technology. One significant issue is latency, which can result in audio-visual discrepancies, particularly in real-time applications like gaming. Interference from other wireless devices operating on similar frequency bands, such as Bluetooth-enabled speakers and smart home devices, can also impact performance. According to a study, approximately 20% of wireless multimedia speaker users reported experiencing latency issues, while 15% cited interference as a problem. These technical challenges can negatively impact user experience and potentially impact companies' product reliability.
  • For instance, Bluetooth gaming headsets operate in the 2.4 GHz frequency band, which is commonly used by various devices. This shared frequency band increases the risk of interference, affecting the overall performance of wireless multimedia speakers. Companies must address these challenges through technological advancements and effective frequency management strategies to ensure seamless user experiences and maintain a competitive edge in the market.

Exclusive Customer Landscape

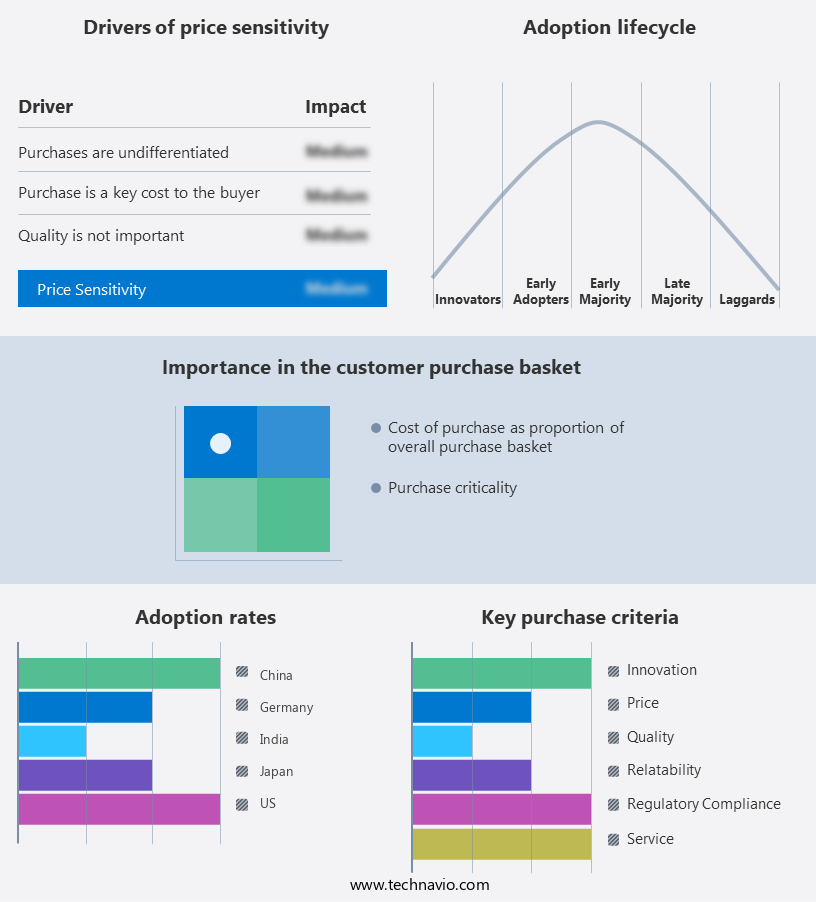
The multimedia speakers market forecasting report includes the adoption lifecycle of the market, covering from the innovator's stage to the laggard's stage. It focuses on adoption rates in different regions based on penetration. Furthermore, the multimedia speakers market report also includes key purchase criteria and drivers of price sensitivity to help companies evaluate and develop their market growth analysis strategies.

Multimedia Speakers Market Share by Geography

 Customer Landscape of Multimedia Speakers Industry

Competitive Landscape & Market Insights

Companies are implementing various strategies, such as strategic alliances, multimedia speakers market forecast, partnerships, mergers and acquisitions, geographical expansion, and product/service launches, to enhance their presence in the industry.

Altec Lansing Inc. - This company specializes in producing a range of multimedia speakers, including the Rockbox XL, Hydraboom, Sound Rover 180, and Nanobuds ANC models. These innovative speakers deliver high-quality audio experiences, setting new standards in sound technology. The company's commitment to cutting-edge design and superior sound quality positions it as a leader in the global audio market.

The industry research and growth report includes detailed analyses of the competitive landscape of the market and information about key companies, including:

  • Altec Lansing Inc.
  • Audioengine LLC
  • Bang and Olufsen Group
  • Bose Corp.
  • Bowers and Wilkins
  • Creative Technology Ltd.
  • Edifier International Ltd.
  • Feltron Industries Pvt. Ltd.
  • GP Industries Ltd.
  • Koninklijke Philips NV
  • LG Electronics Inc.
  • Logitech International SA
  • Onkyo Corp.
  • Panasonic Holdings Corp.
  • Samsung Electronics Co. Ltd.
  • Shenzhen Fenda Technology Co. Ltd.
  • Sony Group Corp.
  • Unitech India
  • Yamaha Corp.

Qualitative and quantitative analysis of companies has been conducted to help clients understand the wider business environment as well as the strengths and weaknesses of key industry players. Data is qualitatively analyzed to categorize companies as pure play, category-focused, industry-focused, and diversified; it is quantitatively analyzed to categorize companies as dominant, leading, strong, tentative, and weak.

Recent Development and News in Multimedia Speakers Market

  • In January 2024, Harman International, a leading audio equipment manufacturer, launched its new line of wireless multimedia speakers, the Harman Kardon Citation MultiBeam 300, featuring Dolby Atmos technology and voice control capabilities (Harman International press release).
  • In March 2024, Sonos, another major player in the multimedia speaker market, announced a strategic partnership with Amazon to integrate Amazon's Alexa voice assistant into Sonos' entire product line, enhancing user experience and market appeal (Sonos press release).
  • In April 2024, JBL, a subsidiary of Harman International, secured a significant investment of USD100 million in a funding round led by Blackstone Group, further strengthening JBL's position in the competitive multimedia speaker market (Blackstone Group press release).
  • In May 2025, Bose Corporation, a well-known audio equipment manufacturer, entered the Indian market by launching its multimedia speaker product line, marking a strategic expansion into the rapidly growing Indian consumer electronics market (Bose Corporation press release).

Dive into Technavio's robust research methodology, blending expert interviews, extensive data synthesis, and validated models for unparalleled Multimedia Speakers Market insights. See full methodology.

Market Scope

Report Coverage

Details

Page number

217

Base year

2024

Historic period

2019-2023

Forecast period

2025-2029

Growth momentum & CAGR

Accelerate at a CAGR of 14.7%

Market growth 2025-2029

USD 36983.8 million

Market structure

Fragmented

YoY growth 2024-2025(%)

12.6

Key countries

US, China, India, Germany, Japan, UK, South Korea, Canada, France, and Australia

Competitive landscape

Leading Companies, Market Positioning of Companies, Competitive Strategies, and Industry Risks

Request Free Sample

Research Analyst Overview

  • The market is characterized by continuous innovation and evolution, with key technologies shaping its dynamics. Near-field monitoring systems have gained popularity due to their ability to deliver accurate sound reproduction in close proximity to the listener. Driver sensitivity ratings and frequency response curves are crucial factors in assessing a speaker's performance, with active speaker technology and passive radiator designs offering distinct advantages. Power handling capacity, enclosure resonance control, and tweeter diaphragm type are essential considerations in speaker design, ensuring optimal sound quality. Room acoustic treatment and radiated acoustic emission are critical aspects of speaker placement and performance.
  • Speaker cabinet construction, signal-to-noise ratio (SNR), and NFC pairing technology have streamlined the user experience in wireless speaker systems. Active components, such as audio amplifier integration and impedance matching networks, contribute to improved sound quality and efficiency. Transient response testing and full-range speaker systems ensure accurate and balanced sound reproduction. Harmonic distortion (THD) and wireless speaker technology have revolutionized audio playback, offering convenience and high-fidelity sound. Crossover network design and audiophile-grade components are essential for producing clear and detailed sound. Acoustic impedance, Bluetooth audio streaming, electromagnetic interference (EMI), woofer cone material, multi-way speaker configuration, and directivity pattern control are all essential factors that influence speaker performance and user experience.

What are the Key Data Covered in this Multimedia Speakers Market Research and Growth Report?

  • What is the expected growth of the Multimedia Speakers Market between 2025 and 2029?

    • USD 36.98 billion, at a CAGR of 14.7%

  • What segmentation does the market report cover?

    • The report segmented by Type (Wireless MS and Wired MS), Distribution Channel (Offline and Online), Application (Residential, Commercial, and Automotive), and Geography (APAC, North America, Europe, South America, and Middle East and Africa)

  • Which regions are analyzed in the report?

    • APAC, North America, Europe, South America, and Middle East and Africa

  • What are the key growth drivers and market challenges?

    • Growing consumer preferences for in-home entertainment systems, Technical issues related to wireless technologies

  • Who are the major players in the Multimedia Speakers Market?

    • Key Companies Altec Lansing Inc., Audioengine LLC, Bang and Olufsen Group, Bose Corp., Bowers and Wilkins, Creative Technology Ltd., Edifier International Ltd., Feltron Industries Pvt. Ltd., GP Industries Ltd., Koninklijke Philips NV, LG Electronics Inc., Logitech International SA, Onkyo Corp., Panasonic Holdings Corp., Samsung Electronics Co. Ltd., Shenzhen Fenda Technology Co. Ltd., Sony Group Corp., Unitech India, and Yamaha Corp.

Market Research Insights

  • The market encompasses a diverse range of audio solutions designed for professional and personal use. Three-way speaker systems, with their superior mid-range clarity detail and improved bass extension capability, accounted for a significant market share. In contrast, two-way speaker systems, while more cost-effective, offer less frequency response and mid-range detail. To optimize performance, manufacturers employ various techniques such as room acoustics analysis, audio system calibration, and speaker placement optimization. Finite element analysis and phase alignment techniques aid in the design process, ensuring minimal total harmonic distortion and intermodulation distortion.
  • Material selection, including cone materials and cabinet damping materials, significantly impacts sound quality. Additionally, magnetic shielding design and subwoofer integration are essential considerations for reducing interference and enhancing low-frequency response. Advancements in technology continue to shape the market. Planar magnetic speakers and electrostatic speakers, with their high-frequency extension and linear phase response, offer improved soundstage imaging quality. Power compression testing and sound intensity measurement ensure accurate performance assessment. Acoustic modeling software and speaker design software facilitate efficient design and prototyping processes. As technology evolves, so too will the market, offering consumers increasingly sophisticated and immersive audio experiences.

We can help! Our analysts can customize this multimedia speakers market research report to meet your requirements.

Get in touch

1 Executive Summary

  • 1.1 Market overview
    • Executive Summary - Chart on Market Overview
    • Executive Summary - Data Table on Market Overview
    • Executive Summary - Chart on Global Market Characteristics
    • Executive Summary - Chart on Market by Geography
    • Executive Summary - Chart on Market Segmentation by Type
    • Executive Summary - Chart on Market Segmentation by Distribution Channel
    • Executive Summary - Chart on Market Segmentation by Application
    • Executive Summary - Chart on Incremental Growth
    • Executive Summary - Data Table on Incremental Growth
    • Executive Summary - Chart on Company Market Positioning

2 Technavio Analysis

  • 2.1 Analysis of price sensitivity, lifecycle, customer purchase basket, adoption rates, and purchase criteria
    • Analysis of price sensitivity, lifecycle, customer purchase basket, adoption rates, and purchase criteria
  • 2.2 Criticality of inputs and Factors of differentiation
    • Overview on criticality of inputs and factors of differentiation
  • 2.3 Factors of disruption
    • Overview on factors of disruption
  • 2.4 Impact of drivers and challenges
    • Impact of drivers and challenges in 2024 and 2029

3 Market Landscape

  • 3.1 Market ecosystem
    • Parent Market
    • Data Table on - Parent Market
  • 3.2 Market characteristics
    • Market characteristics analysis
  • 3.3 Value chain analysis
    • Value chain analysis

4 Market Sizing

  • 4.1 Market definition
    • Offerings of companies included in the market definition
  • 4.2 Market segment analysis
    • Market segments
  • 4.3 Market size 2024
    • 4.4 Market outlook: Forecast for 2024-2029
      • Chart on Global - Market size and forecast 2024-2029 ($ million)
      • Data Table on Global - Market size and forecast 2024-2029 ($ million)
      • Chart on Global Market: Year-over-year growth 2024-2029 (%)
      • Data Table on Global Market: Year-over-year growth 2024-2029 (%)

    5 Historic Market Size

    • 5.1 Global Multimedia Speakers Market 2019 - 2023
      • Historic Market Size - Data Table on Global Multimedia Speakers Market 2019 - 2023 ($ million)
    • 5.2 Type segment analysis 2019 - 2023
      • Historic Market Size - Type Segment 2019 - 2023 ($ million)
    • 5.3 Distribution Channel segment analysis 2019 - 2023
      • Historic Market Size - Distribution Channel Segment 2019 - 2023 ($ million)
    • 5.4 Application segment analysis 2019 - 2023
      • Historic Market Size - Application Segment 2019 - 2023 ($ million)
    • 5.5 Geography segment analysis 2019 - 2023
      • Historic Market Size - Geography Segment 2019 - 2023 ($ million)
    • 5.6 Country segment analysis 2019 - 2023
      • Historic Market Size - Country Segment 2019 - 2023 ($ million)

    6 Qualitative Analysis

    • 6.1 Impact of AI in global multimedia speakers market

      7 Five Forces Analysis

      • 7.1 Five forces summary
        • Five forces analysis - Comparison between 2024 and 2029
      • 7.2 Bargaining power of buyers
        • Bargaining power of buyers - Impact of key factors 2024 and 2029
      • 7.3 Bargaining power of suppliers
        • Bargaining power of suppliers - Impact of key factors in 2024 and 2029
      • 7.4 Threat of new entrants
        • Threat of new entrants - Impact of key factors in 2024 and 2029
      • 7.5 Threat of substitutes
        • Threat of substitutes - Impact of key factors in 2024 and 2029
      • 7.6 Threat of rivalry
        • Threat of rivalry - Impact of key factors in 2024 and 2029
      • 7.7 Market condition
        • Chart on Market condition - Five forces 2024 and 2029

      8 Market Segmentation by Type

      • 8.1 Market segments
        • Chart on Type - Market share 2024-2029 (%)
        • Data Table on Type - Market share 2024-2029 (%)
      • 8.2 Comparison by Type
        • Chart on Comparison by Type
        • Data Table on Comparison by Type
      • 8.3 Wireless MS - Market size and forecast 2024-2029
        • Chart on Wireless MS - Market size and forecast 2024-2029 ($ million)
        • Data Table on Wireless MS - Market size and forecast 2024-2029 ($ million)
        • Chart on Wireless MS - Year-over-year growth 2024-2029 (%)
        • Data Table on Wireless MS - Year-over-year growth 2024-2029 (%)
      • 8.4 Wired MS - Market size and forecast 2024-2029
        • Chart on Wired MS - Market size and forecast 2024-2029 ($ million)
        • Data Table on Wired MS - Market size and forecast 2024-2029 ($ million)
        • Chart on Wired MS - Year-over-year growth 2024-2029 (%)
        • Data Table on Wired MS - Year-over-year growth 2024-2029 (%)
      • 8.5 Market opportunity by Type
        • Market opportunity by Type ($ million)
        • Data Table on Market opportunity by Type ($ million)

      9 Market Segmentation by Distribution Channel

      • 9.1 Market segments
        • Chart on Distribution Channel - Market share 2024-2029 (%)
        • Data Table on Distribution Channel - Market share 2024-2029 (%)
      • 9.2 Comparison by Distribution Channel
        • Chart on Comparison by Distribution Channel
        • Data Table on Comparison by Distribution Channel
      • 9.3 Offline - Market size and forecast 2024-2029
        • Chart on Offline - Market size and forecast 2024-2029 ($ million)
        • Data Table on Offline - Market size and forecast 2024-2029 ($ million)
        • Chart on Offline - Year-over-year growth 2024-2029 (%)
        • Data Table on Offline - Year-over-year growth 2024-2029 (%)
      • 9.4 Online - Market size and forecast 2024-2029
        • Chart on Online - Market size and forecast 2024-2029 ($ million)
        • Data Table on Online - Market size and forecast 2024-2029 ($ million)
        • Chart on Online - Year-over-year growth 2024-2029 (%)
        • Data Table on Online - Year-over-year growth 2024-2029 (%)
      • 9.5 Market opportunity by Distribution Channel
        • Market opportunity by Distribution Channel ($ million)
        • Data Table on Market opportunity by Distribution Channel ($ million)

      10 Market Segmentation by Application

      • 10.1 Market segments
        • Chart on Application - Market share 2024-2029 (%)
        • Data Table on Application - Market share 2024-2029 (%)
      • 10.2 Comparison by Application
        • Chart on Comparison by Application
        • Data Table on Comparison by Application
      • 10.3 Residential - Market size and forecast 2024-2029
        • Chart on Residential - Market size and forecast 2024-2029 ($ million)
        • Data Table on Residential - Market size and forecast 2024-2029 ($ million)
        • Chart on Residential - Year-over-year growth 2024-2029 (%)
        • Data Table on Residential - Year-over-year growth 2024-2029 (%)
      • 10.4 Commercial - Market size and forecast 2024-2029
        • Chart on Commercial - Market size and forecast 2024-2029 ($ million)
        • Data Table on Commercial - Market size and forecast 2024-2029 ($ million)
        • Chart on Commercial - Year-over-year growth 2024-2029 (%)
        • Data Table on Commercial - Year-over-year growth 2024-2029 (%)
      • 10.5 Automotive - Market size and forecast 2024-2029
        • Chart on Automotive - Market size and forecast 2024-2029 ($ million)
        • Data Table on Automotive - Market size and forecast 2024-2029 ($ million)
        • Chart on Automotive - Year-over-year growth 2024-2029 (%)
        • Data Table on Automotive - Year-over-year growth 2024-2029 (%)
      • 10.6 Market opportunity by Application
        • Market opportunity by Application ($ million)
        • Data Table on Market opportunity by Application ($ million)

      11 Customer Landscape

      • 11.1 Customer landscape overview
        • Analysis of price sensitivity, lifecycle, customer purchase basket, adoption rates, and purchase criteria

      12 Geographic Landscape

      • 12.1 Geographic segmentation
        • Chart on Market share by geography 2024-2029 (%)
        • Data Table on Market share by geography 2024-2029 (%)
      • 12.2 Geographic comparison
        • Chart on Geographic comparison
        • Data Table on Geographic comparison
      • 12.3 APAC - Market size and forecast 2024-2029
        • Chart on APAC - Market size and forecast 2024-2029 ($ million)
        • Data Table on APAC - Market size and forecast 2024-2029 ($ million)
        • Chart on APAC - Year-over-year growth 2024-2029 (%)
        • Data Table on APAC - Year-over-year growth 2024-2029 (%)
      • 12.4 North America - Market size and forecast 2024-2029
        • Chart on North America - Market size and forecast 2024-2029 ($ million)
        • Data Table on North America - Market size and forecast 2024-2029 ($ million)
        • Chart on North America - Year-over-year growth 2024-2029 (%)
        • Data Table on North America - Year-over-year growth 2024-2029 (%)
      • 12.5 Europe - Market size and forecast 2024-2029
        • Chart on Europe - Market size and forecast 2024-2029 ($ million)
        • Data Table on Europe - Market size and forecast 2024-2029 ($ million)
        • Chart on Europe - Year-over-year growth 2024-2029 (%)
        • Data Table on Europe - Year-over-year growth 2024-2029 (%)
      • 12.6 South America - Market size and forecast 2024-2029
        • Chart on South America - Market size and forecast 2024-2029 ($ million)
        • Data Table on South America - Market size and forecast 2024-2029 ($ million)
        • Chart on South America - Year-over-year growth 2024-2029 (%)
        • Data Table on South America - Year-over-year growth 2024-2029 (%)
      • 12.7 Middle East and Africa - Market size and forecast 2024-2029
        • Chart on Middle East and Africa - Market size and forecast 2024-2029 ($ million)
        • Data Table on Middle East and Africa - Market size and forecast 2024-2029 ($ million)
        • Chart on Middle East and Africa - Year-over-year growth 2024-2029 (%)
        • Data Table on Middle East and Africa - Year-over-year growth 2024-2029 (%)
      • 12.8 US - Market size and forecast 2024-2029
        • Chart on US - Market size and forecast 2024-2029 ($ million)
        • Data Table on US - Market size and forecast 2024-2029 ($ million)
        • Chart on US - Year-over-year growth 2024-2029 (%)
        • Data Table on US - Year-over-year growth 2024-2029 (%)
      • 12.9 China - Market size and forecast 2024-2029
        • Chart on China - Market size and forecast 2024-2029 ($ million)
        • Data Table on China - Market size and forecast 2024-2029 ($ million)
        • Chart on China - Year-over-year growth 2024-2029 (%)
        • Data Table on China - Year-over-year growth 2024-2029 (%)
      • 12.10 India - Market size and forecast 2024-2029
        • Chart on India - Market size and forecast 2024-2029 ($ million)
        • Data Table on India - Market size and forecast 2024-2029 ($ million)
        • Chart on India - Year-over-year growth 2024-2029 (%)
        • Data Table on India - Year-over-year growth 2024-2029 (%)
      • 12.11 Germany - Market size and forecast 2024-2029
        • Chart on Germany - Market size and forecast 2024-2029 ($ million)
        • Data Table on Germany - Market size and forecast 2024-2029 ($ million)
        • Chart on Germany - Year-over-year growth 2024-2029 (%)
        • Data Table on Germany - Year-over-year growth 2024-2029 (%)
      • 12.12 Japan - Market size and forecast 2024-2029
        • Chart on Japan - Market size and forecast 2024-2029 ($ million)
        • Data Table on Japan - Market size and forecast 2024-2029 ($ million)
        • Chart on Japan - Year-over-year growth 2024-2029 (%)
        • Data Table on Japan - Year-over-year growth 2024-2029 (%)
      • 12.13 UK - Market size and forecast 2024-2029
        • Chart on UK - Market size and forecast 2024-2029 ($ million)
        • Data Table on UK - Market size and forecast 2024-2029 ($ million)
        • Chart on UK - Year-over-year growth 2024-2029 (%)
        • Data Table on UK - Year-over-year growth 2024-2029 (%)
      • 12.14 South Korea - Market size and forecast 2024-2029
        • Chart on South Korea - Market size and forecast 2024-2029 ($ million)
        • Data Table on South Korea - Market size and forecast 2024-2029 ($ million)
        • Chart on South Korea - Year-over-year growth 2024-2029 (%)
        • Data Table on South Korea - Year-over-year growth 2024-2029 (%)
      • 12.15 France - Market size and forecast 2024-2029
        • Chart on France - Market size and forecast 2024-2029 ($ million)
        • Data Table on France - Market size and forecast 2024-2029 ($ million)
        • Chart on France - Year-over-year growth 2024-2029 (%)
        • Data Table on France - Year-over-year growth 2024-2029 (%)
      • 12.16 Australia - Market size and forecast 2024-2029
        • Chart on Australia - Market size and forecast 2024-2029 ($ million)
        • Data Table on Australia - Market size and forecast 2024-2029 ($ million)
        • Chart on Australia - Year-over-year growth 2024-2029 (%)
        • Data Table on Australia - Year-over-year growth 2024-2029 (%)
      • 12.17 Canada - Market size and forecast 2024-2029
        • Chart on Canada - Market size and forecast 2024-2029 ($ million)
        • Data Table on Canada - Market size and forecast 2024-2029 ($ million)
        • Chart on Canada - Year-over-year growth 2024-2029 (%)
        • Data Table on Canada - Year-over-year growth 2024-2029 (%)
      • 12.18 Market opportunity by geography
        • Market opportunity by geography ($ million)
        • Data Tables on Market opportunity by geography ($ million)

      13 Drivers, Challenges, and Opportunity/Restraints

      • 13.1 Market drivers
        • 13.2 Market challenges
          • 13.3 Impact of drivers and challenges
            • Impact of drivers and challenges in 2024 and 2029
          • 13.4 Market opportunities/restraints

            14 Competitive Landscape

            • 14.1 Overview
              • 14.2 Competitive Landscape
                • Overview on criticality of inputs and factors of differentiation
              • 14.3 Landscape disruption
                • Overview on factors of disruption
              • 14.4 Industry risks
                • Impact of key risks on business

              15 Competitive Analysis

              • 15.1 Companies profiled
                • Companies covered
              • 15.2 Company ranking index
                • Company ranking index
              • 15.3 Market positioning of companies
                • Matrix on companies position and classification
              • 15.4 Altec Lansing Inc.
                • Altec Lansing Inc. - Overview
                • Altec Lansing Inc. - Product / Service
                • Altec Lansing Inc. - Key offerings
                • SWOT
              • 15.5 Audioengine LLC
                • Audioengine LLC - Overview
                • Audioengine LLC - Product / Service
                • Audioengine LLC - Key offerings
                • SWOT
              • 15.6 Bang and Olufsen Group
                • Bang and Olufsen Group - Overview
                • Bang and Olufsen Group - Business segments
                • Bang and Olufsen Group - Key offerings
                • Bang and Olufsen Group - Segment focus
                • SWOT
              • 15.7 Bose Corp.
                • Bose Corp. - Overview
                • Bose Corp. - Product / Service
                • Bose Corp. - Key news
                • Bose Corp. - Key offerings
                • SWOT
              • 15.8 Bowers and Wilkins
                • Bowers and Wilkins - Overview
                • Bowers and Wilkins - Product / Service
                • Bowers and Wilkins - Key offerings
                • SWOT
              • 15.9 Creative Technology Ltd.
                • Creative Technology Ltd. - Overview
                • Creative Technology Ltd. - Business segments
                • Creative Technology Ltd. - Key offerings
                • Creative Technology Ltd. - Segment focus
                • SWOT
              • 15.10 Edifier International Ltd.
                • Edifier International Ltd. - Overview
                • Edifier International Ltd. - Product / Service
                • Edifier International Ltd. - Key offerings
                • SWOT
              • 15.11 Koninklijke Philips NV
                • Koninklijke Philips NV - Overview
                • Koninklijke Philips NV - Business segments
                • Koninklijke Philips NV - Key news
                • Koninklijke Philips NV - Key offerings
                • Koninklijke Philips NV - Segment focus
                • SWOT
              • 15.12 LG Electronics Inc.
                • LG Electronics Inc. - Overview
                • LG Electronics Inc. - Product / Service
                • LG Electronics Inc. - Key offerings
                • SWOT
              • 15.13 Logitech International SA
                • Logitech International SA - Overview
                • Logitech International SA - Business segments
                • Logitech International SA - Key news
                • Logitech International SA - Key offerings
                • Logitech International SA - Segment focus
                • SWOT
              • 15.14 Onkyo Corp.
                • Onkyo Corp. - Overview
                • Onkyo Corp. - Product / Service
                • Onkyo Corp. - Key offerings
                • SWOT
              • 15.15 Panasonic Holdings Corp.
                • Panasonic Holdings Corp. - Overview
                • Panasonic Holdings Corp. - Business segments
                • Panasonic Holdings Corp. - Key news
                • Panasonic Holdings Corp. - Key offerings
                • Panasonic Holdings Corp. - Segment focus
                • SWOT
              • 15.16 Samsung Electronics Co. Ltd.
                • Samsung Electronics Co. Ltd. - Overview
                • Samsung Electronics Co. Ltd. - Business segments
                • Samsung Electronics Co. Ltd. - Key news
                • Samsung Electronics Co. Ltd. - Key offerings
                • Samsung Electronics Co. Ltd. - Segment focus
                • SWOT
              • 15.17 Sony Group Corp.
                • Sony Group Corp. - Overview
                • Sony Group Corp. - Business segments
                • Sony Group Corp. - Key news
                • Sony Group Corp. - Key offerings
                • Sony Group Corp. - Segment focus
                • SWOT
              • 15.18 Yamaha Corp.
                • Yamaha Corp. - Overview
                • Yamaha Corp. - Business segments
                • Yamaha Corp. - Key news
                • Yamaha Corp. - Key offerings
                • Yamaha Corp. - Segment focus
                • SWOT

              16 Appendix

              • 16.1 Scope of the report
                • 16.2 Inclusions and exclusions checklist
                  • Inclusions checklist
                  • Exclusions checklist
                • 16.3 Currency conversion rates for US$
                  • Currency conversion rates for US$
                • 16.4 Research methodology
                  • Research methodology
                • 16.5 Data procurement
                  • Information sources
                • 16.6 Data validation
                  • Data validation
                • 16.7 Validation techniques employed for market sizing
                  • Validation techniques employed for market sizing
                • 16.8 Data synthesis
                  • Data synthesis
                • 16.9 360 degree market analysis
                  • 360 degree market analysis
                • 16.10 List of abbreviations
                  • List of abbreviations

                Research Methodology

                Technavio presents a detailed picture of the market by way of study, synthesis, and summation of data from multiple sources. The analysts have presented the various facets of the market with a particular focus on identifying the key industry influencers. The data thus presented is comprehensive, reliable, and the result of extensive research, both primary and secondary.

                INFORMATION SOURCES

                Primary sources

                • Manufacturers and suppliers
                • Channel partners
                • Industry experts
                • Strategic decision makers

                Secondary sources

                • Industry journals and periodicals
                • Government data
                • Financial reports of key industry players
                • Historical data
                • Press releases

                DATA ANALYSIS

                Data Synthesis

                • Collation of data
                • Estimation of key figures
                • Analysis of derived insights

                Data Validation

                • Triangulation with data models
                • Reference against proprietary databases
                • Corroboration with industry experts

                REPORT WRITING

                Qualitative

                • Market drivers
                • Market challenges
                • Market trends
                • Five forces analysis

                Quantitative

                • Market size and forecast
                • Market segmentation
                • Geographical insights
                • Competitive landscape

                Interested in this report?

                Get your sample now to see our research methodology and insights!

                Download Now

                Frequently Asked Questions

                Multimedia Speakers market growth will increase by $ 36983.8 mn during 2025-2029 .

                The Multimedia Speakers market is expected to grow at a CAGR of 14.7% during 2025-2029 .

                Multimedia Speakers market is segmented by Type( Wireless MS, Wired MS) Distribution Channel( Offline, Online, Europe, South America) Application( Residential, Commercial, Automotive, South America, Middle East and Africa)

                Altec Lansing Inc., Audioengine LLC, Bang and Olufsen Group, Bose Corp., Bowers and Wilkins, Creative Technology Ltd., Edifier International Ltd., Feltron Industries Pvt. Ltd., GP Industries Ltd., Koninklijke Philips NV, LG Electronics Inc., Logitech International SA, Onkyo Corp., Panasonic Holdings Corp., Samsung Electronics Co. Ltd., Shenzhen Fenda Technology Co. Ltd., Sony Group Corp., Unitech India, Yamaha Corp. are a few of the key vendors in the Multimedia Speakers market.

                APAC will register the highest growth rate of 47% among the other regions. Therefore, the Multimedia Speakers market in APAC is expected to garner significant business opportunities for the vendors during the forecast period.

                US, China, India, Germany, Japan, UK, South Korea, Canada, France, Australia

                • Growing consumer preferences for in-home entertainment systemsChanges in consumer lifestyle and the choice of entertainment have resulted in a paradigm shift in the home entertainment industry. In-home entertainment options are rapidly gaining strength over outdoor entertainment options owing to the busy lifestyle of consumers and the easy availability of in-home entertainment systems to play music and video games as well as to watch movies. Moreover is the driving factor this market.
                • in-home entertainment systems are proving to be an economical option in comparison to expensive outdoor leisure pursuits such as vacations is the driving factor this market.
                • movie theaters is the driving factor this market.
                • and sports events. Such factors have directly boosted the purchase of multimedia speakers that are finding extensive use in enhancing the audio experience while playing music and games as well as watching digital movies. Furthermore is the driving factor this market.
                • an increase in the purchasing power of consumers (specifically in emerging economies) and easy access to credits have driven consumers affordability of high-end multimedia speakers such as home theater systems. For instance is the driving factor this market.
                • disposable income in India grew by 8% during 2023-2024 is the driving factor this market.
                • and in China is the driving factor this market.
                • it grew by 6.3% during 2023-2024. The rise in disposable income is resulting in easy accessibility to expensive in-home entertainment options such as home theater systems. High-end home theater systems are offering immersive surround sound and theater-like audio experiences to consumers is the driving factor this market.
                • thus providing value for money. Companies are also constantly enhancing the designs of speakers used in expensive home theater systems to make them compact and easy to mount/place. For instance is the driving factor this market.
                • they are offering wall mounting options is the driving factor this market.
                • satellite mounting options is the driving factor this market.
                • and soundbar speakers. These factors have led consumers to increasingly prefer home entertainment systems over outdoor leisure options is the driving factor this market.
                • and this is driving the sales growth of the global multimedia speakers market. Such factors will boost the growth of the global multimedia speakers market during the forecast period. is the driving factor this market.

                The Multimedia Speakers market vendors should focus on grabbing business opportunities from the Wireless MS segment as it accounted for the largest market share in the base year.