
AI System Debugging Market Size 2025-2029
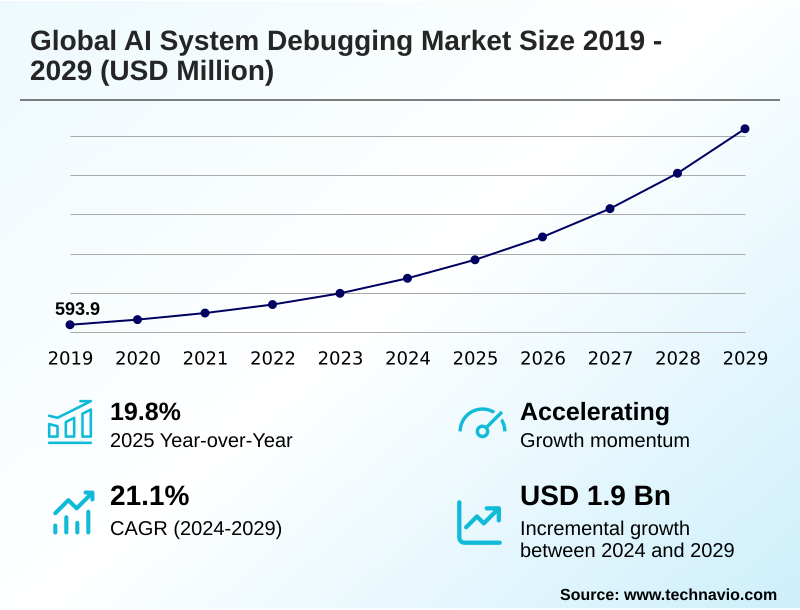
The ai system debugging market size is valued to increase by USD 1.90 billion, at a CAGR of 21.1% from 2024 to 2029. Increasing complexity of AI systems will drive the ai system debugging market.
Major Market Trends & Insights
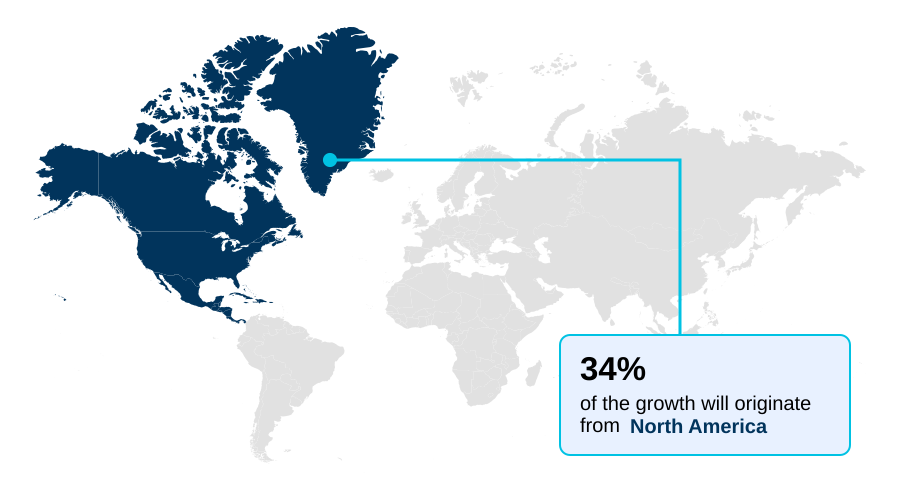
- North America dominated the market and accounted for a 34.2% growth during the forecast period.
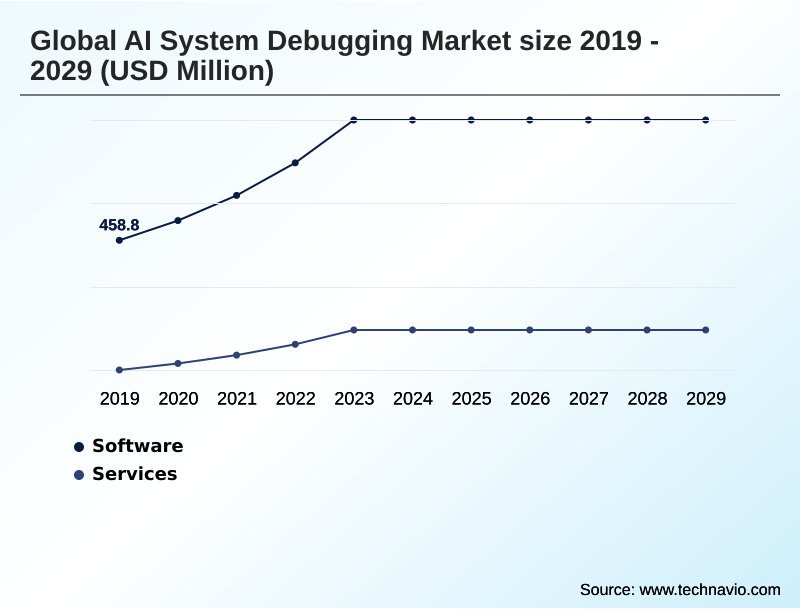
- By Component - Software segment was valued at USD 759 million in 2023
- By Deployment - Cloud-based segment accounted for the largest market revenue share in 2023
Market Size & Forecast
- Market Opportunities: USD 2.49 billion
- Market Future Opportunities: USD 1.90 billion
- CAGR from 2024 to 2029 : 21.1%
Market Summary
- The AI system debugging market is expanding as organizations embed complex AI into mission-critical operations. This growth is propelled by the need to ensure reliability, fairness, and transparency in systems powered by deep neural networks and large language models.
- Traditional software testing methods are insufficient for these probabilistic systems, creating demand for specialized tools focused on model validation, performance profiling, and root cause analysis. A key trend is the integration of explainable AI (XAI) techniques, which provide vital interpretability into otherwise black-box models.
- For instance, a financial services firm deploying an AI for credit scoring must use advanced debugging to perform algorithmic bias mitigation and demonstrate regulatory compliance, ensuring its models do not exhibit intersectional bias. This involves using tools for fairness metrics and counterfactual analysis.
- The shift towards proactive debugging within MLOps practices, supported by continuous validation and real-time monitoring, is critical for managing data drift and preventing model performance degradation in production environments, thereby enhancing overall AI application reliability. This requires a focus on model lifecycle management and adversarial robustness testing to ensure AI systems are secure and function as intended.
What will be the Size of the AI System Debugging Market during the forecast period?
Get Key Insights on Market Forecast (PDF) Get Free Sample
How is the AI System Debugging Market Segmented?
The ai system debugging industry research report provides comprehensive data (region-wise segment analysis), with forecasts and estimates in "USD million" for the period 2025-2029, as well as historical data from 2019-2023 for the following segments.
- Component
- Software
- Services
- Deployment
- Cloud-based
- On-premises
- Application
- Code debugging
- Model debugging
- Others
- Geography
- North America
- US
- Canada
- Mexico
- APAC
- China
- India
- Japan
- Europe
- Germany
- UK
- France
- South America
- Brazil
- Argentina
- Colombia
- Middle East and Africa
- South Africa
- UAE
- Saudi Arabia
- Rest of World (ROW)
- North America
By Component Insights
The software segment is estimated to witness significant growth during the forecast period.
The software segment is central to addressing complex operational challenges, moving beyond simple error flagging to encompass the entire model lifecycle management. Solutions now provide advanced performance debugging to resolve performance bottlenecks and ensure AI system reliability.
This includes specialized tools for data pipeline debugging and infrastructure debugging, which are critical for maintaining data integrity and system health. As AI becomes more interactive, tools for conversational flow debugging are gaining traction.
Effective production monitoring is achieved through robust AI system observability platforms, integrating model explainability and bias detection tools. These MLOps practices enable firms to improve model validation times by over 20%, ensuring faster deployment of trustworthy AI.
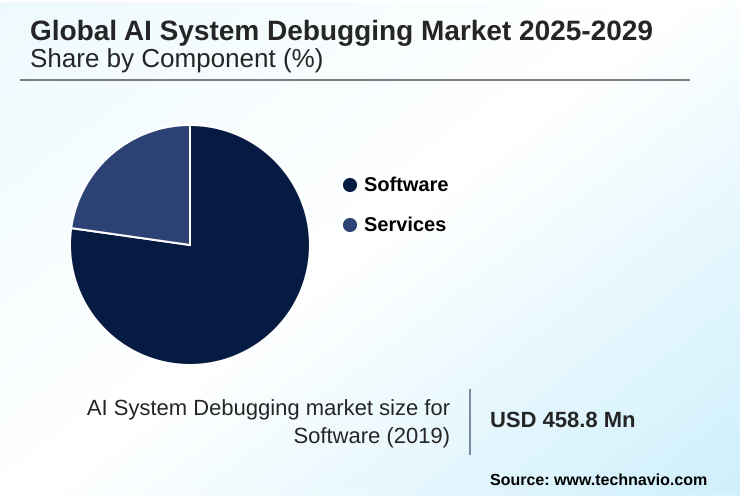
The Software segment was valued at USD 759 million in 2023 and showed a gradual increase during the forecast period.
Regional Analysis
North America is estimated to contribute 34.2% to the growth of the global market during the forecast period.Technavio’s analysts have elaborately explained the regional trends and drivers that shape the market during the forecast period.
See How AI System Debugging Market Demand is Rising in North America Get Free Sample
North America leads the market, contributing 34.2% of the incremental growth, driven by high AI adoption and a strong focus on AI governance.
The region's emphasis on algorithmic bias mitigation is evident in the demand for tools offering fairness metrics, bias visualization, and counterfactual analysis.
In contrast, the APAC market is the fastest-growing, with a CAGR of 22.4%, as enterprises rapidly scale AI and require solutions for fault localization and comprehensive model diagnostics. European regulations are pushing the need for adversarial robustness testing.
Across all regions, a mature approach to debugging that includes proactive debugging and continuous validation is becoming standard practice to maintain system integrity.
Market Dynamics
Our researchers analyzed the data with 2024 as the base year, along with the key drivers, trends, and challenges. A holistic analysis of drivers will help companies refine their marketing strategies to gain a competitive advantage.
- Successfully navigating the AI landscape requires mastering the art of debugging complex deep learning systems. This goes beyond traditional code fixes to proactively identifying data bias in AI models and ensuring AI safety in medical diagnostics. A core objective is improving AI model performance and reliability, which involves a strategic approach to monitoring AI models in production environments.
- For instance, when debugging AI systems in autonomous vehicles, performance profiling for AI inference is non-negotiable. The rise of generative AI introduces unique challenges, making the ability to debug generative AI model hallucinations a critical competency. Organizations are increasingly adopting proactive issue resolution in MLOps, where integrating debugging into CI/CD pipelines is standard practice.
- Firms using such integrated approaches report deployment failures at a rate three times lower than those relying on reactive methods. This requires leveraging explainable AI for root cause analysis and implementing real-time data drift detection methods.
- The use of advanced debugging tools for large language models and techniques for mitigating algorithmic bias are essential for ensuring AI regulatory and ethical compliance. Furthermore, validating AI model fairness and equity through automated anomaly detection in AI pipelines and performing root cause analysis for model degradation have become central to responsible AI deployment.
- This includes managing complexity in multimodal AI systems and using specialized tools for ethical AI auditing.
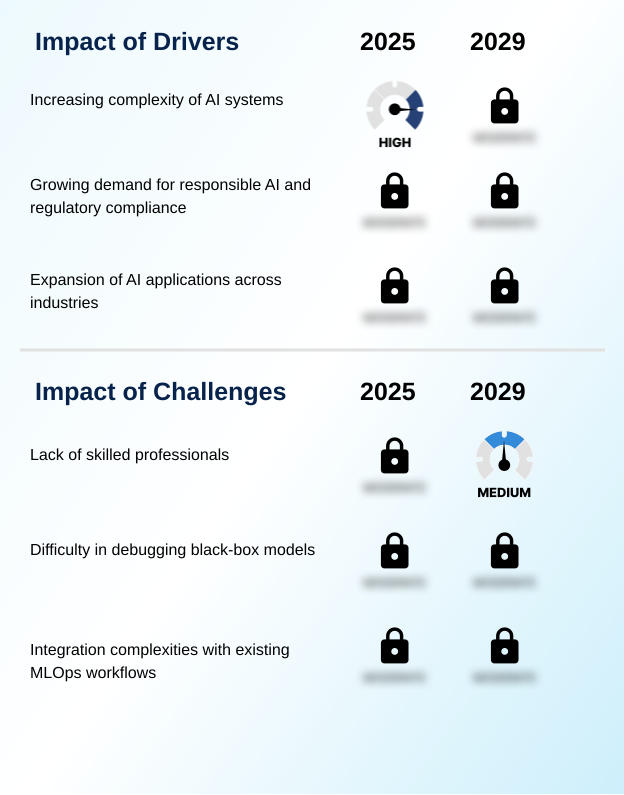
What are the key market drivers leading to the rise in the adoption of AI System Debugging Industry?
- The market is primarily driven by the increasing complexity of AI systems, which necessitates advanced debugging solutions.
- The increasing complexity of deep neural networks and large language models is a primary market driver.
- The opaque nature of these black-box models, especially in multimodal AI and generative AI applications, necessitates tools that provide interpretability and robust root cause analysis.
- Ensuring AI application reliability and AI model safety in this context requires advanced MLOps observability and real-time monitoring. Specialized solutions for debugging large language models are essential, with automated root cause analysis capabilities reducing diagnostic times by over 40%.
- This focus is critical as enterprises deploy AI in mission-critical roles where system failures carry significant operational risk.
What are the market trends shaping the AI System Debugging Industry?
- The increasing emphasis on explainable AI (XAI) for debugging is a significant market trend, addressing the growing demand for transparency and interpretability in complex AI systems.
- A major trend is the integration of explainable AI (XAI) and model interpretability tools to facilitate proactive debugging. Techniques like SHAP, LIME, and integrated gradients are crucial for understanding model behavior and promoting AI ethics. This shift supports continuous validation within the MLOps pipeline, enabling the early detection of issues like model drift and data anomalies.
- The emphasis on debugging for ethical AI is driving the adoption of comprehensive AI governance frameworks, where identifying root causes of bias is as important as fixing code. Organizations using these advanced methods report a 30% faster resolution for critical AI incidents, directly enhancing system trustworthiness.
What challenges does the AI System Debugging Industry face during its growth?
- A significant challenge affecting industry growth is the lack of skilled professionals with expertise in advanced AI debugging methodologies.
- Key challenges hinder market growth, including managing model performance degradation and ensuring data integrity. The presence of data drift can introduce intersectional bias, making robust model validation and performance profiling essential. While automated debugging workflows and AI-driven test automation offer solutions, their integration into existing CI/CD for AI pipelines is complex, often increasing initial operational costs by up to 20%.
- Addressing these issues requires a combination of model optimization and specialized defect analysis services. For instance, in complex deployments like smart city infrastructure debugging, the failure to quickly perform anomaly detection can lead to significant service disruptions.
Exclusive Technavio Analysis on Customer Landscape
The ai system debugging market forecasting report includes the adoption lifecycle of the market, covering from the innovator’s stage to the laggard’s stage. It focuses on adoption rates in different regions based on penetration. Furthermore, the ai system debugging market report also includes key purchase criteria and drivers of price sensitivity to help companies evaluate and develop their market growth analysis strategies.
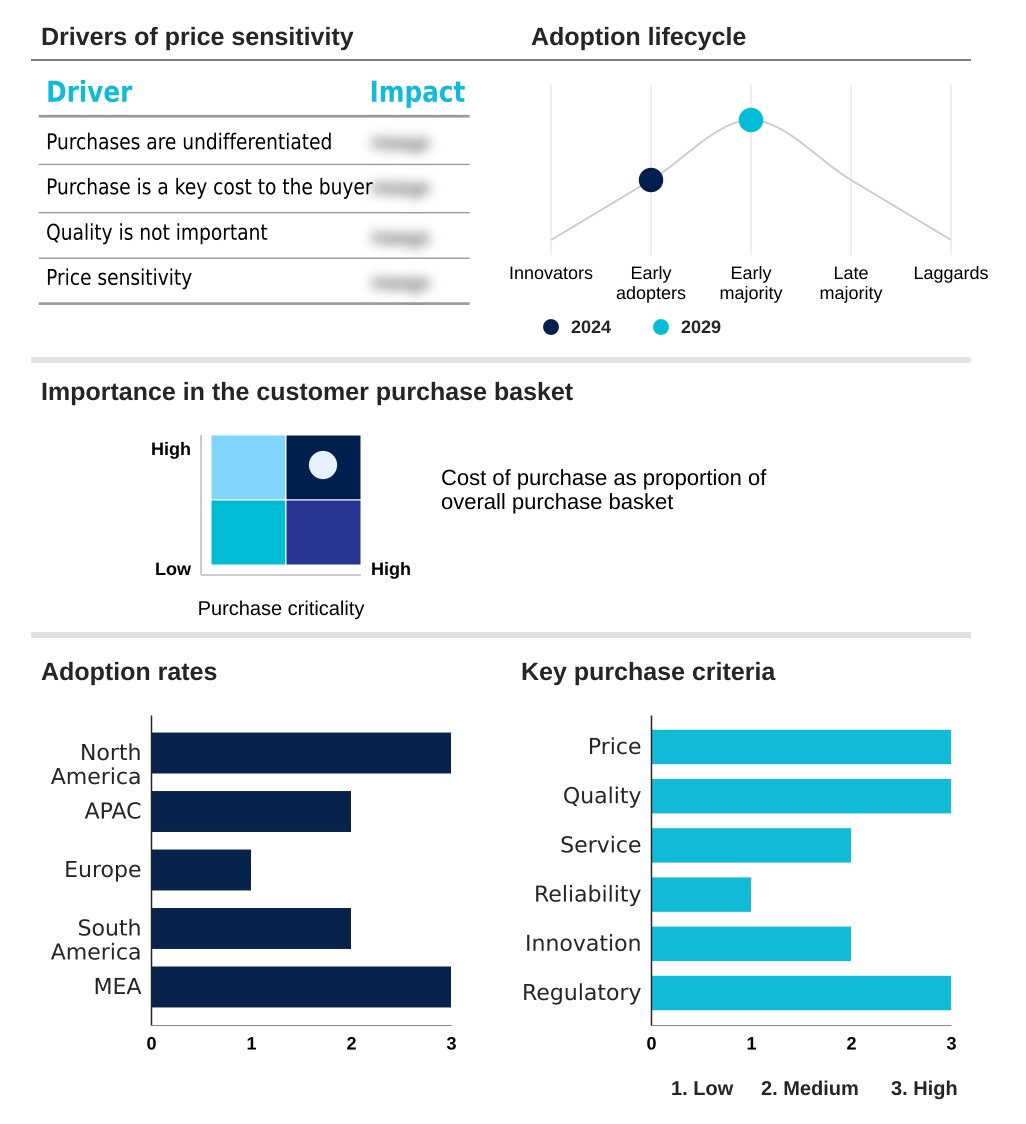
Customer Landscape of AI System Debugging Industry
Competitive Landscape
Companies are implementing various strategies, such as strategic alliances, ai system debugging market forecast, partnerships, mergers and acquisitions, geographical expansion, and product/service launches, to enhance their presence in the industry.
Accenture PLC - Delivers comprehensive AI validation and debugging services, enhancing defect prediction and ensuring robust enterprise AI deployments.
The industry research and growth report includes detailed analyses of the competitive landscape of the market and information about key companies, including:
- Accenture PLC
- Alibaba Group Holding Ltd.
- Amazon Web Services Inc.
- Baidu Inc.
- BrowserStack Inc.
- GitHub Inc.
- Google LLC
- Hound Technology Inc.
- IBM Corp.
- LambdaTest
- Microsoft Corp.
- NEC Corp.
- OpenAI
- Oracle Corp.
- QASource
- SAP SE
- Tencent Holdings Ltd.
Qualitative and quantitative analysis of companies has been conducted to help clients understand the wider business environment as well as the strengths and weaknesses of key industry players. Data is qualitatively analyzed to categorize companies as pure play, category-focused, industry-focused, and diversified; it is quantitatively analyzed to categorize companies as dominant, leading, strong, tentative, and weak.
Recent Development and News in Ai system debugging market
- In February 2025, Microsoft Corp. announced the general availability of its new Azure AI Integrity suite, a comprehensive platform offering advanced model debugging, bias detection, and explainability features specifically designed to help enterprises comply with the EU AI Act.
- In November 2024, IBM Corp. and SAP SE formed a strategic partnership to integrate IBM's Watson OpenScale with SAP's AI Business Services, enabling seamless AI model debugging and governance within enterprise workflows.
- In September 2024, Oracle Corp. acquired 'Veritas AI', a startup specializing in MLOps observability and proactive debugging, for a reported $350 million to strengthen its Oracle AI services portfolio.
- In April 2025, OpenAI released a new open-source library called 'Clarity', designed to debug large language models by providing granular visualization of attention mechanisms and identifying sources of factual inconsistency.
Dive into Technavio’s robust research methodology, blending expert interviews, extensive data synthesis, and validated models for unparalleled AI System Debugging Market insights. See full methodology.
| Market Scope | |
|---|---|
| Page number | 295 |
| Base year | 2024 |
| Historic period | 2019-2023 |
| Forecast period | 2025-2029 |
| Growth momentum & CAGR | Accelerate at a CAGR of 21.1% |
| Market growth 2025-2029 | USD 1902.5 million |
| Market structure | Fragmented |
| YoY growth 2024-2025(%) | 19.8% |
| Key countries | US, Canada, Mexico, China, India, Japan, South Korea, Australia, Indonesia, Germany, UK, France, The Netherlands, Italy, Spain, Brazil, Argentina, Colombia, South Africa, UAE, Saudi Arabia, Israel and Turkey |
| Competitive landscape | Leading Companies, Market Positioning of Companies, Competitive Strategies, and Industry Risks |
Research Analyst Overview
- The market is defined by an urgent need for advanced tools to manage the inherent opacity of modern AI. As enterprises deploy deep neural networks and large language models, ensuring system integrity through robust model validation and performance profiling becomes paramount.
- The trend toward explainable AI is a direct response to this, with techniques like SHAP and LIME providing crucial interpretability into black-box models and supporting root cause analysis for issues like data drift and data anomalies. This shift directly informs boardroom strategy on risk management, as regulatory bodies now mandate transparency.
- Organizations leveraging these tools for algorithmic bias mitigation, using fairness metrics and bias visualization, achieve a 25% faster path to compliance. The focus extends throughout the MLOps pipeline with MLOps practices that address everything from fault localization and error tracing in generative AI to infrastructure debugging and conversational flow debugging.
- Effective model lifecycle management now includes continuous performance debugging, real-time performance tracking, and anomaly detection to prevent model performance degradation and ensure systems pass adversarial robustness testing, especially in complex multimodal AI applications.
What are the Key Data Covered in this AI System Debugging Market Research and Growth Report?
-
What is the expected growth of the AI System Debugging Market between 2025 and 2029?
-
USD 1.90 billion, at a CAGR of 21.1%
-
-
What segmentation does the market report cover?
-
The report is segmented by Component (Software, and Services), Deployment (Cloud-based, and On-premises), Application (Code debugging, Model debugging, and Others) and Geography (North America, APAC, Europe, South America, Middle East and Africa)
-
-
Which regions are analyzed in the report?
-
North America, APAC, Europe, South America and Middle East and Africa
-
-
What are the key growth drivers and market challenges?
-
Increasing complexity of AI systems, Lack of skilled professionals
-
-
Who are the major players in the AI System Debugging Market?
-
Accenture PLC, Alibaba Group Holding Ltd., Amazon Web Services Inc., Baidu Inc., BrowserStack Inc., GitHub Inc., Google LLC, Hound Technology Inc., IBM Corp., LambdaTest, Microsoft Corp., NEC Corp., OpenAI, Oracle Corp., QASource, SAP SE and Tencent Holdings Ltd.
-
Market Research Insights
- The market's dynamism is driven by the enterprise shift toward proactive debugging and continuous validation to enhance AI application reliability. Organizations are adopting MLOps observability platforms that facilitate real-time monitoring and automated root cause analysis, improving model accuracy by over 15%.
- This strategic focus on AI governance and AI ethics is compelling investment in model interpretability tools and specialized solutions for debugging for ethical AI. Integrating AI-driven test automation and automated debugging workflows into development cycles has been shown to reduce diagnostic times by up to 40%.
- As AI model safety becomes a board-level concern, demand for robust AI validation protocols is accelerating, ensuring that deployed systems are both effective and trustworthy.
We can help! Our analysts can customize this ai system debugging market research report to meet your requirements.
 RIA -
RIA - 
