
Ai Workload Management Market Size and Growth Forecast 2026-2030
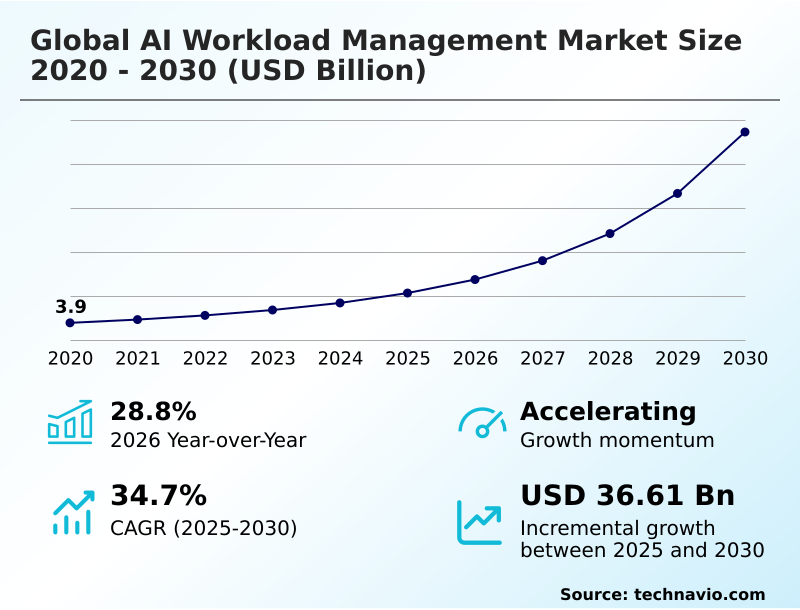
The Ai Workload Management Market size was valued at USD 10.67 billion in 2025 growing at a CAGR of 34.7% during the forecast period 2026-2030.
North America accounts for 33.5% of incremental growth during the forecast period. The Cloud segment by Deployment was valued at USD 5.41 billion in 2024, while the Machine learning segment holds the largest revenue share by Technology.
The market is projected to grow by USD 43.37 billion from 2020 to 2030, with USD 36.61 billion of the growth expected during the forecast period of 2025 to 2030.
Get Key Insights on Market Forecast (PDF) Request Free Sample
Ai Workload Management Market Overview
The AI workload management market is driven by the enterprise transition from experimental modeling to production AI deployment, a shift that elevates the financial and operational importance of GPU utilization efficiency. As organizations scale, the focus intensifies on managing GPU compute cost and ensuring deterministic scheduling for model pipelines. This operational discipline is critical for meeting the latency and availability SLAs of customer-facing services. For instance, a global financial services firm implementing a real-time fraud detection system must navigate multi-cloud orchestration to satisfy data sovereignty rules while maintaining model risk management standards compliant with regulations like SR 11-7. Such a deployment requires a platform capable of governing complex agentic AI architectures and providing auditable AI governance, a need reflected in the market's 28.8% year-over-year growth. The increasing sophistication of these requirements makes robust MLOps capabilities, rather than ad-hoc scripts, a prerequisite for competitive success.
Drivers, Trends, and Challenges in the Ai Workload Management Market
Successfully managing agentic AI workflow execution has become a central challenge, compelling organizations to re-evaluate their on-premises vs cloud AI infrastructure TCO. The decision is complicated by the need for optimizing GPU cost for LLM inference while ensuring MLOps maturity for platform adoption.
For example, a healthcare provider developing diagnostic tools must establish governance for high-risk medical AI applications, a process that involves integrating data platforms with AI workload managers to ensure compliance with the EU AI act requirements. This requires sophisticated resource management for production AI pipelines, especially for the distributed training for large foundation models.
Platforms that improve GPU utilization in shared clusters can reduce compute costs by over 30% compared to unmanaged environments. This efficiency is crucial for balancing latency and throughput in inference serving and handling stateful workloads in agentic systems.
Furthermore, multi-cloud AI workload orchestration challenges are intensifying, making kubernetes for batch AI workload scheduling and NLP inference optimization techniques essential for managing AI workloads in industrial IoT environments and enabling real-time AI for network operations management, all while respecting data sovereignty in hybrid AI deployments and automating MLOps for enterprise data science teams.
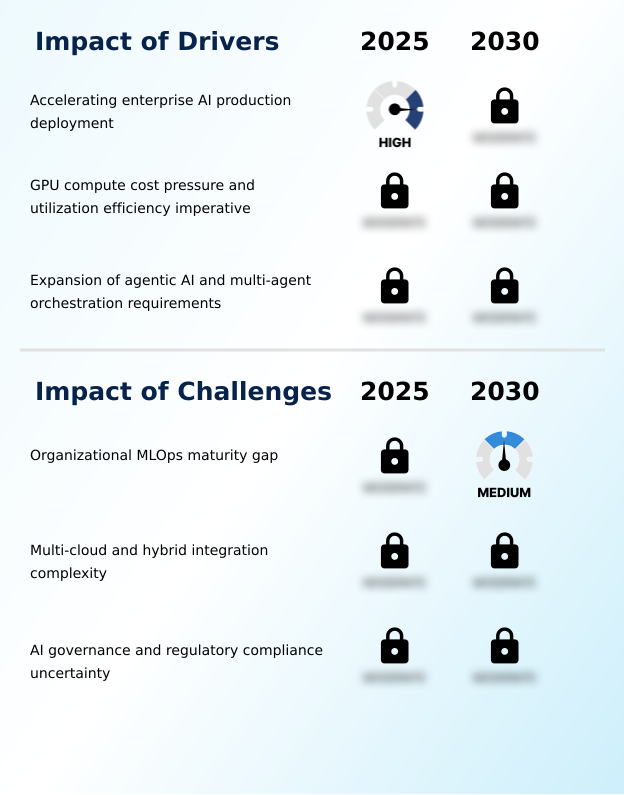
Primary Growth Driver: The acceleration of enterprise AI programs from experimental phases to production-scale deployment is the primary driver of market growth.
The market's primary driver is the structural shift of enterprise AI from experimentation to production AI deployment. This transition creates non-negotiable requirements for systematic MLOps, including deterministic scheduling and enforceable latency and availability SLAs.
A second major driver is the escalating GPU compute cost, which transforms GPU utilization efficiency from an operational nicety into a financial imperative.
Enterprises are now compelled to adopt platforms that minimize idle compute time through intelligent job packing and resource prioritization, including the use of spot instance optimization. Finally, the rise of agentic AI architectures introduces a new class of requirements.
These systems, characterized by multi-agent coordination and long-running stateful processes, demand orchestration capabilities far beyond those of conventional machine learning platforms.
Emerging Market Trend: The convergence of enterprise data platforms and AI workload management infrastructure is reshaping the market. This integration creates unified data intelligence environments that manage the entire AI lifecycle within a single governed architecture.
A primary trend is the convergence of platforms into unified data intelligence environments, which streamlines data engineering, lineage tracking, and access control frameworks. This integration eliminates data movement friction between previously distinct systems.
Concurrently, the market's focus is decisively shifting toward inference workload management, driven by the demanding inference economics of large-scale models where the cost of token generation is a major operational concern. This shift prioritizes capabilities like continuous batching and speculative decoding.
Furthermore, open-source standardization via the kubernetes ecosystem, with tools like Kueue for batch workload management and KServe for standardized model serving interfaces, is commoditizing foundational capabilities. This allows commercial vendors to focus on higher-level differentiation while accelerating enterprise adoption by reducing lock-in concerns.
Key Industry Challenge: A significant challenge affecting industry growth is the persistent gap between the advanced capabilities of AI workload management platforms and the MLOps maturity of most enterprise organizations.
The most significant market restraint is the organizational MLOps maturity gap, where enterprises lack the disciplined data engineering practices and cross-functional workflows needed to leverage advanced platforms, leading to low adoption. Another key challenge is the complexity of multi-cloud and hybrid integration.
The absence of a universal standard for AI compute resource abstraction makes orchestrating workloads across heterogeneous environments a persistent technical hurdle. Furthermore, uncertainty around AI governance and regulatory compliance creates significant risk.
Evolving regulations, such as the EU AI Act, impose stringent requirements for high-risk AI applications, including comprehensive audit trail maintenance and data protection obligations under frameworks like GDPR, making platform selection a complex, forward-looking compliance decision.
Explore Full Market Dynamics Analysis Request Free Sample
Ai Workload Management Market Segmentation
The ai workload management industry research report provides comprehensive data including region-wise segment analysis, with forecasts and analysis for the period 2026-2030, as well as historical data from 2020-2024 for the following segments.
Deployment Segment Analysis
The cloud segment is estimated to witness significant growth during the forecast period.
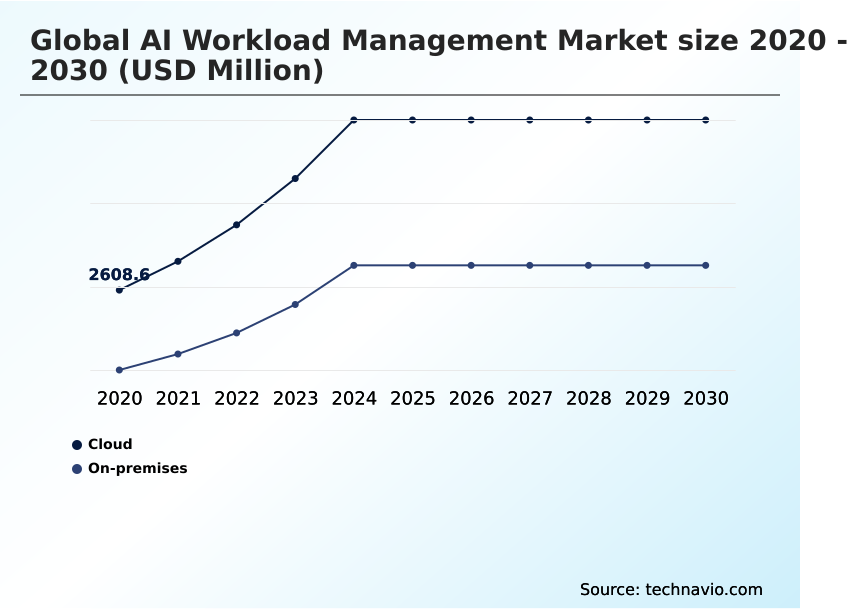
Cloud deployment defines the AI workload management market, accounting for nearly 64% of the total share, due to its intrinsic alignment with the variable, burst-intensive nature of AI computation.
The model of elastic provisioning is structurally suited for GPU-accelerated training and inference workload management, where large-scale resources are needed for finite durations. This approach mitigates the economic inefficiency of on-premises overprovisioning.
Enterprises leverage cloud environments for both CPU-intensive jobs and complex production AI deployment pipelines, demanding strict latency and availability SLAs.
The architecture supports dynamic scaling for AI/ML development and optimizes GPU utilization efficiency, which is critical for managing compute costs as AI programs mature from experimental stages to full-scale operation.
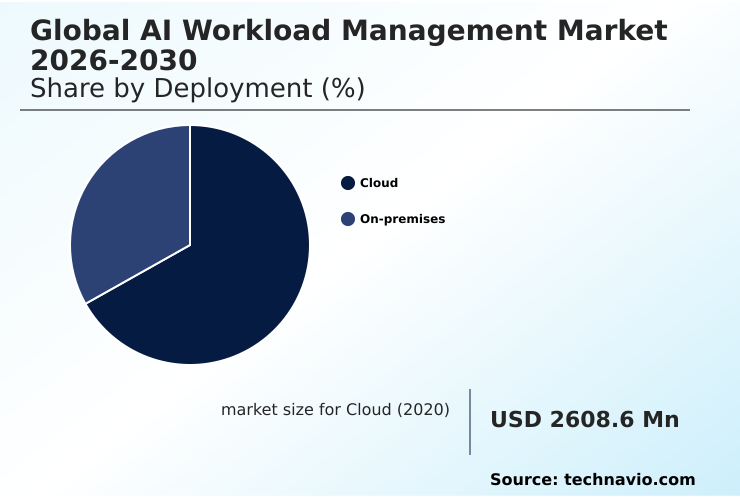
The Cloud segment was valued at USD 5.41 billion in 2024 and showed a gradual increase during the forecast period.
Ai Workload Management Market by Region: North America Leads with 33.5% Growth Share
North America is estimated to contribute 33.5% to the growth of the global market during the forecast period.
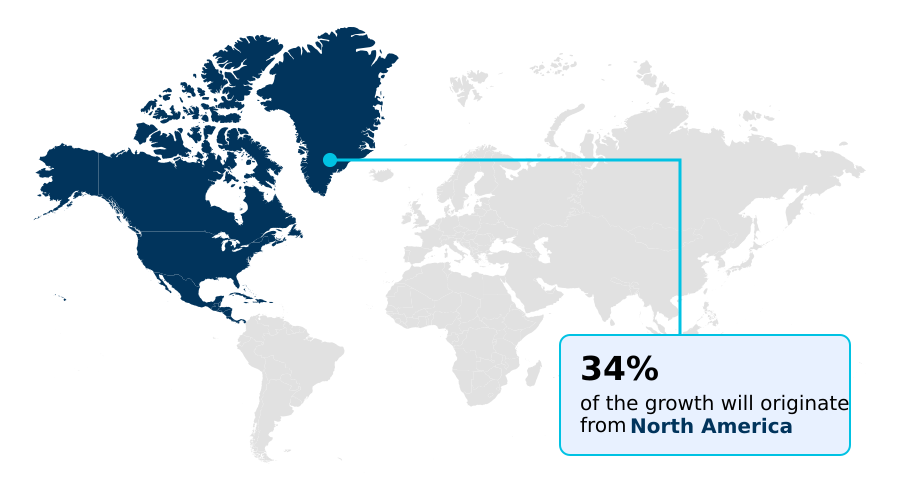
North America leads the AI workload management market, contributing 33.5% of the incremental growth, with the US driving demand through sophisticated enterprise buyers and stringent FedRAMP compliance requirements for public sector contracts.
In contrast, the European market, which accounts for 28.01% of growth, is shaped by the prescriptive EU AI Act, mandating auditable AI governance and regulatory compliance, particularly in Germany’s advanced industrial AI sector.
The APAC region, representing 26.16% of new growth, presents a diverse landscape where hybrid integration is key.
China’s ecosystem prioritizes data sovereignty, while Japan’s manufacturing giants require advanced MLOps for complex production lines, and both rely on a robust kubernetes ecosystem for workload orchestration.
Customer Landscape Analysis for the Ai Workload Management Market
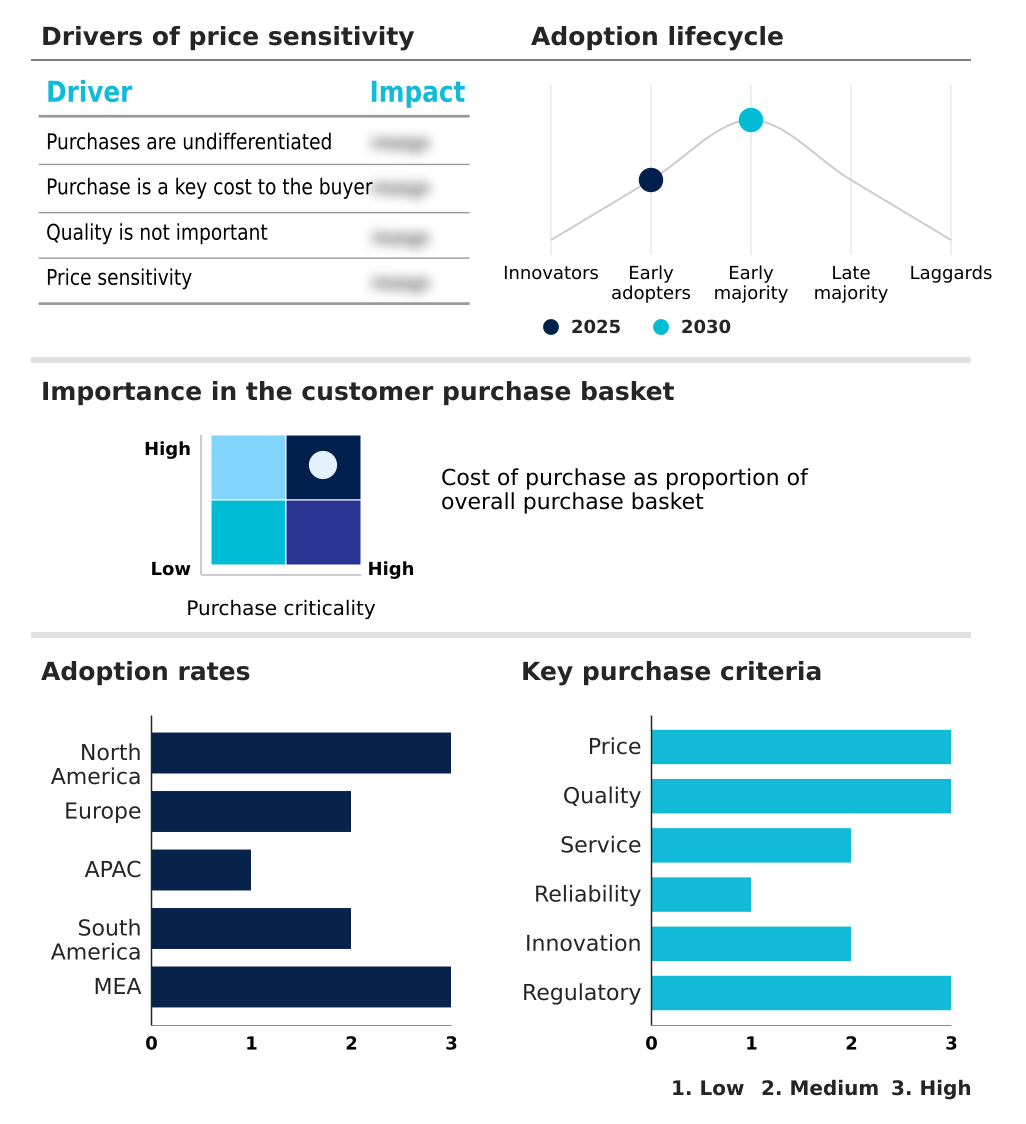
The ai workload management market forecasting report includes the adoption lifecycle of the market, covering from the innovator’s stage to the laggard’s stage. It focuses on adoption rates in different regions based on penetration. Furthermore, the ai workload management market report also includes key purchase criteria and drivers of price sensitivity to help companies evaluate and develop their market growth analysis strategies.
Competitive Landscape of the Ai Workload Management Market
Companies are implementing various strategies, such as strategic alliances, partnerships, mergers and acquisitions, geographical expansion, and product/service launches, to enhance their presence in the ai workload management market industry.
Amazon Web Services Inc. - Offers integrated AI workload management, featuring tools for batch processing and cloud orchestration to support scalable AI operations on a low-cost, reliable cloud infrastructure.
The industry research and growth report includes detailed analyses of the competitive landscape of the market and information about key companies, including:
- Amazon Web Services Inc.
- Anyscale Inc.
- BentoML
- Cloudera Inc.
- Databricks Inc.
- Dataiku Inc.
- DataRobot Inc.
- DigitalOcean Holdings Inc.
- Domino Data Lab Inc.
- Google LLC
- Hewlett Packard Enterprise Co.
- IBM Corp.
- Iguazio Ltd.
- Lightning AI
- Microsoft Corp.
- NVIDIA Corp.
- Qwak
- Seldon Technologies
- Valohai Oy
- Weights and Biases Inc.
Qualitative and quantitative analysis of companies has been conducted to help clients understand the wider business environment as well as the strengths and weaknesses of key industry players. Data is qualitatively analyzed to categorize companies as pure play, category-focused, industry-focused, and diversified; it is quantitatively analyzed to categorize companies as dominant, leading, strong, tentative, and weak.
Recent Developments in the Ai Workload Management Market
- In May, 2025, IBM Corp. expanded its strategic partnership with Oracle to integrate its watsonx AI portfolio with Oracle Cloud Infrastructure, enabling unified management of multi-agent AI workflows across hybrid environments.
- In April, 2025, Google LLC announced new multi-cloud capabilities for Vertex AI, allowing enterprises to manage and orchestrate AI training and inference workloads across both Google Cloud and on-premises Kubernetes clusters using a single control plane.
- In February, 2025, Databricks Inc. announced a strategic collaboration with NVIDIA to integrate NVIDIA NIM microservices into its Data Intelligence Platform, optimizing inference performance for generative AI models on the lakehouse architecture.
- In November, 2024, Domino Data Lab Inc. launched Domino Chorus, a new agentic AI framework designed to orchestrate and govern complex, multi-agent systems, providing enterprise-grade security and auditability for financial services and life sciences.
Research Analyst Overview: Ai Workload Management Market
The enterprise shift to production AI deployment is forcing a strategic re-evaluation of infrastructure, with boardroom decisions now heavily influenced by GPU compute cost and total cost of ownership. The focus has moved beyond technical capabilities to demonstrable ROI from enhanced GPU utilization efficiency, a key vendor qualification criterion.
This financial scrutiny is amplified by regulatory pressures; compliance with frameworks like the EU AI Act for high-risk AI applications necessitates platforms with robust AI governance and model risk management features. Consequently, procurement decisions for AI workload management platforms now hinge on the ability to support auditable model promotion workflows.
The emergence of agentic AI architectures further complicates the landscape, creating demand for platforms that can manage long-running, stateful compute processes, a significant departure from conventional batch workload management. This operational evolution, reflected in the market's 28.8% year-over-year growth, is driving demand for sophisticated multi-cloud orchestration and tools to bridge the persistent MLOps maturity gap.
Dive into Technavio’s robust research methodology, blending expert interviews, extensive data synthesis, and validated models for unparalleled Ai Workload Management Market insights. See full methodology.
| Market Scope | |
|---|---|
| Page number | 297 |
| Base year | 2025 |
| Historic period | 2020-2024 |
| Forecast period | 2026-2030 |
| Growth momentum & CAGR | Accelerate at a CAGR of 34.7% |
| Market growth 2026-2030 | USD 36606.8 million |
| Market structure | Fragmented |
| YoY growth 2025-2026(%) | 28.8% |
| Key countries | US, Canada, Mexico, Germany, UK, France, Italy, Spain, The Netherlands, China, Japan, India, South Korea, Australia, Indonesia, Brazil, Argentina, Chile, Saudi Arabia, UAE, South Africa, Israel and Turkey |
| Competitive landscape | Leading Companies, Market Positioning of Companies, Competitive Strategies, and Industry Risks |
Ai Workload Management Market: Key Questions Answered in This Report
-
What is the expected growth of the Ai Workload Management Market between 2026 and 2030?
-
The Ai Workload Management Market is expected to grow by USD 36.61 billion during 2026-2030, registering a CAGR of 34.7%. Year-over-year growth in 2026 is estimated at 28.8%%. This acceleration is shaped by accelerating enterprise ai production deployment, which is intensifying demand across multiple end-use verticals covered in the report.
-
-
What segmentation does the market report cover?
-
The report is segmented by Deployment (Cloud, and On-premises), Technology (Machine learning, Deep learning, and Natural language processing), End-user (BFSI, Healthcare, Retail and e-commerce, Telecommunications, and Others) and Geography (North America, Europe, APAC, South America, Middle East and Africa). Among these, the Cloud segment is estimated to witness significant growth during the forecast period, driven by rising adoption across key application areas. Each segment includes detailed qualitative and quantitative analysis, along with historical data from 2020-2024 and forecasts through 2030 with year-over-year growth rates.
-
-
Which regions are analyzed in the report?
-
The report covers North America, Europe, APAC, South America and Middle East and Africa. North America is estimated to contribute 33.5% to market growth during the forecast period. Country-level analysis includes US, Canada, Mexico, Germany, UK, France, Italy, Spain, The Netherlands, China, Japan, India, South Korea, Australia, Indonesia, Brazil, Argentina, Chile, Saudi Arabia, UAE, South Africa, Israel and Turkey, with dedicated market size tables and year-over-year growth for each.
-
-
What are the key growth drivers and market challenges?
-
The primary driver is accelerating enterprise ai production deployment, which is accelerating investment and industry demand. The main challenge is organizational mlops maturity gap, creating operational barriers for key market participants. The report quantifies the impact of each driver and challenge across 2026 and 2030 with comparative analysis.
-
-
Who are the major players in the Ai Workload Management Market?
-
Key vendors include Amazon Web Services Inc., Anyscale Inc., BentoML, Cloudera Inc., Databricks Inc., Dataiku Inc., DataRobot Inc., DigitalOcean Holdings Inc., Domino Data Lab Inc., Google LLC, Hewlett Packard Enterprise Co., IBM Corp., Iguazio Ltd., Lightning AI, Microsoft Corp., NVIDIA Corp., Qwak, Seldon Technologies, Valohai Oy and Weights and Biases Inc.. The report provides qualitative and quantitative analysis categorizing companies as dominant, leading, strong, tentative, and weak based on their market positioning. Company profiles include business segment analysis, SWOT assessment, key offerings, and recent strategic developments.
-
Ai Workload Management Market Research Insights
Regulatory pressures, including GDPR compliance and the mandates of the EU AI Act, are forcing enterprises to prioritize AI governance and robust data protection obligations. This focus directly influences infrastructure choices for managing high-risk AI applications, demanding features that support comprehensive audit trail maintenance.
In practice, a retail organization deploying long-running stateful processes for user personalization must balance these compliance needs with financial pressures, often turning to spot instance optimization to manage compute costs. The cloud segment, commanding a significant share of the market, offers the necessary flexibility for this dynamic.
Its architecture is better suited for AI compute resource abstraction and multi-agent coordination than more rigid on-premises alternatives, enabling scalable and compliant AI operations.
We can help! Our analysts can customize this ai workload management market research report to meet your requirements.
 RIA -
RIA - 
