Infrastructure Monitoring Market Analysis Europe, North America, APAC, Middle East and Africa, South America - US, Germany, China, UK, Japan, Canada, India, South Korea, France, Italy - Size and Forecast 2024-2028

Infrastructure Monitoring Market Analysis Europe, North America, APAC, Middle East and Africa, South America - US, Germany, China, UK, Japan, Canada, India, South Korea, France, Italy - Size and Forecast 2024-2028

Published: Nov 2024 166 Pages SKU: IRTNTR72328

Market Overview at a Glance

$9.40 B
Market Opportunity
8.9%
CAGR
8.1
YoY growth 2023-2024(%)

Infrastructure Monitoring Market Size 2024-2028 

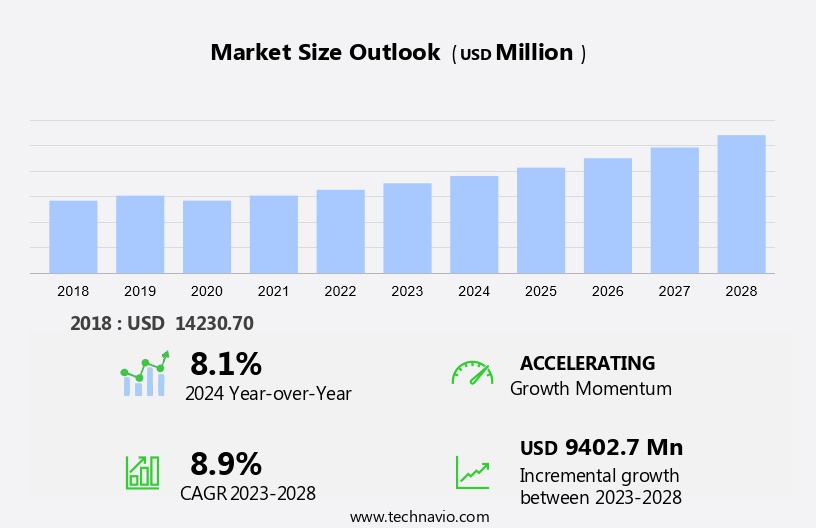
The infrastructure monitoring market size is forecast to increase by USD 9.40 billion at a CAGR of 8.9% between 2023 and 2028.

  • Infrastructure monitoring is a critical aspect of maintaining the efficiency and reliability of various sectors, including telecommunications, utilities, transportation, and smart cities. The market for infrastructure monitoring solutions is witnessing significant growth due to several key trends. The increasing adoption of Internet of Things (IoT) technologies and real-time data analysis is enabling more effective monitoring and predictive maintenance. Sensor technologies are becoming more advanced, allowing for more precise and accurate monitoring. Additionally, the push towards automation and standardization in infrastructure maintenance and repair is driving demand for monitoring solutions. However, this growth comes with challenges, such as the vulnerability to cyberattacks and the need for strong data analytics capabilities to make sense of the vast amounts of data generated. These trends and challenges are shaping the market and will continue to do so in the coming years.

What will the size of the market be during the forecast period?

Infrastructure Monitoring Market Size

 Request Free Sample

  • The market is a significant sector that plays a crucial role in ensuring the optimal performance and security of critical assets. This market encompasses various technologies, including wired and wireless, to provide real-time data on the status and health of infrastructure. Wired technology and wireless technology are two primary approaches used in infrastructure monitoring. Wired technology relies on physical connections between sensors and monitoring systems, providing reliable and accurate data. Structural monitoring systems and sensor technologies are key components of this market, providing real-time data on the condition of assets and enabling predictive maintenance. On the other hand, wireless technology offers flexibility and ease of deployment, making it ideal for monitoring large and geographically dispersed infrastructure.
  • Moreover, vibration monitoring and damage detection are essential applications of infrastructure monitoring. These technologies help detect anomalies and potential issues in structures, enabling timely intervention and preventing costly repairs or replacements. Construction sites and aerospace and defense industries are significant users of infrastructure monitoring, as they rely on the reliable operation of critical assets. Cybersecurity is a critical aspect of infrastructure monitoring. With the increasing integration of IoT and cloud computing in monitoring solutions, ensuring the security of data and systems is paramount. Real-time monitoring and data management platforms are essential components of effective infrastructure monitoring, providing actionable insights and enabling proactive maintenance.

How is this market segmented and which is the largest segment?

The market research report provides comprehensive data (region-wise segment analysis), with forecasts and estimates in "USD billion" for the period 2024-2028, as well as historical data from 2018-2022 for the following segments.

  • Technology
    • Wireless
    • Wired
  • Geography
    • Europe
      • Germany
      • UK
      • France
      • Italy
    • North America
      • Canada
      • US
    • APAC
      • China
      • India
      • Japan
      • South Korea
    • Middle East and Africa
    • South America

By Technology Insights

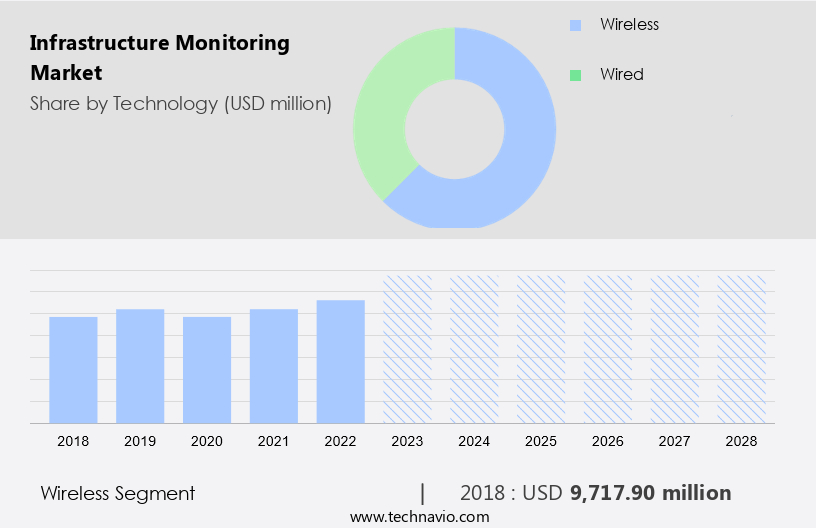
  • The wireless segment is estimated to witness significant growth during the forecast period.

The market is experiencing significant growth due to the increasing demand for real-time data and advanced monitoring solutions. Wireless infrastructure monitoring systems utilize connected devices to assess the status of critical infrastructure such as bridges, buildings, and pipelines. These systems provide continuous, real-time data, allowing for early identification of potential issues and enhancing safety and operational efficiency. Key factors driving the growth of the wireless market include advancements in sensor technology, wireless communication, and the Internet of Things (IoT). IoT applications enable more effective monitoring solutions, facilitating seamless data transmission from remote locations and enabling timely decision-making.

In the context of smart cities, infrastructure monitoring plays a crucial role in various sectors such as telecommunications, utilities, and transportation. By implementing wireless infrastructure monitoring systems, cities can improve their operational efficiency, enhance safety, and reduce downtime. Sensor technologies, data analytics, and wireless communication are at the forefront of this growth, providing valuable insights and enabling proactive maintenance.

Infrastructure Monitoring Market Size

Get a glance at the market report of share of various segments Request Free Sample

The wireless segment was valued at USD 9.72 billion in 2018 and showed a gradual increase during the forecast period.

Regional Analysis

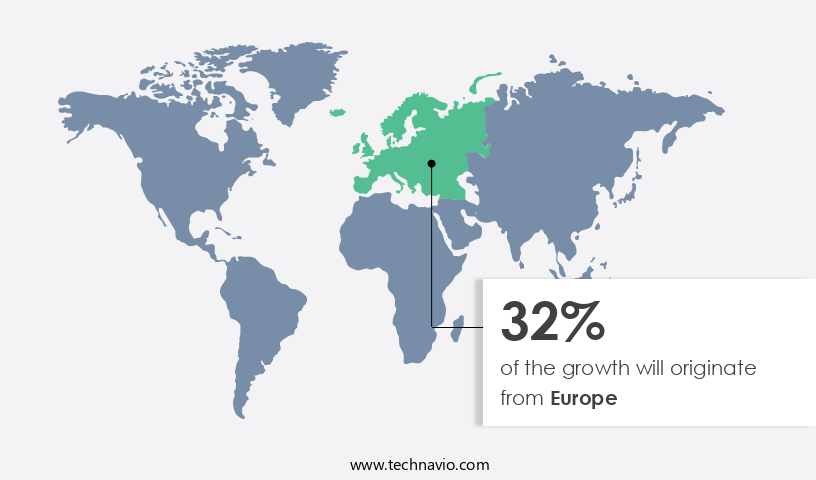
  • Europe is estimated to contribute 32% to the growth of the global market during the forecast period.

Technavio's analysts have elaborately explained the regional trends and drivers that shape the market during the forecast period.

Infrastructure Monitoring Market Share by Geography

For more insights on the market share of various regions Request Free Sample

The European construction industry is a significant economic contributor, accounting for approximately 9% of the EU's GDP and employing over 18 million people. Given its substantial influence on the performance of CECE's member companies, the sector's growth is of great importance. Furthermore, government initiatives, such as increasing the EU's renewable energy infrastructure, present opportunities for companies in the market. This is due to the necessity of regular monitoring to prevent damage and ensure the longevity of such infrastructure.

For instance, the EU's recent increase in its greenhouse gas emissions reduction target from 40% to 55% by 2030, and the proposed raise of the EU's renewable energy target from 32% to 40% by 2030, underscores the significance of this trend. Infrastructure monitoring encompasses both wired and wireless systems, including sensor systems and predictive analytics software. Applications span various sectors, such as aerospace and defense, energy, mining, civil infrastructure, and more. companies in this market stand to benefit from the growing demand for reliable and efficient infrastructure monitoring solutions.

Market Dynamics

Our researchers analyzed the data with 2023 as the base year, along with the key drivers, trends, and challenges. A holistic analysis of drivers will help companies refine their marketing strategies to gain a competitive advantage.

What are the key market drivers leading to the rise in adoption of Infrastructure Monitoring Market?

The rise in global construction and infrastructure development activities is the key driver of the market.

  • The market is experiencing growth due to the increasing construction activities in both developed and emerging economies. In the United States, the economic recovery has fueled a growth in new residential construction projects, with single-family and multi-family homes in high demand. This trend is driven in part by historically low mortgage rates, which have made homeownership more affordable for many Americans. As a result, construction spending in the US reached an all-time high in November 2020.
  • In addition to residential construction, critical infrastructure assets such as transportation systems, energy facilities, and water and wastewater treatment plants also require continuous monitoring to ensure their optimal performance. To accomplish this, advanced infrastructure monitoring systems, including data management platforms and equipment monitoring systems, are being adopted. Cloud computing technology is also playing a significant role in infrastructure monitoring, enabling real-time data acquisition and analysis. These solutions help organizations mitigate risks, improve operational efficiency, and enhance overall infrastructure performance. 

What are the market trends shaping the Infrastructure Monitoring Market?

The adoption of automation and standardization in the maintenance and repair of civil infrastructure is the upcoming trend in the market.

  • The construction industry has experienced a gradual shift towards digitization and automation in key processes, including maintenance and repair, in recent times. The ongoing pandemic has disrupted work at construction sites, necessitating social distancing and reduced capacity, leading to lost time and financial setbacks. To mitigate these challenges, the industry is embracing automation and standardization of maintenance and repair processes. This trend is expected to accelerate the adoption of remote working solutions, bringing about significant transformational changes to the construction sector. Hardware and services are integral components of infrastructure monitoring systems, with wired and wireless technologies playing crucial roles.
  • Moreover, vibration monitoring and damage detection are essential features of these systems, ensuring the structural integrity of buildings and other infrastructure. Cybersecurity is another critical aspect, as the increasing use of Internet of Things (IoT) technology in infrastructure monitoring necessitates strong security measures. The market players offer comprehensive solutions, catering to various industries and applications. These solutions enable real-time monitoring, predictive maintenance, and early damage detection, ensuring optimal performance and longevity of infrastructure. As the construction industry continues to digitize and automate, infrastructure monitoring is poised to play a pivotal role in enhancing productivity, efficiency, and safety.

What challenges does Infrastructure Monitoring Market face during the growth?

Vulnerability to cyberattacks is a key challenge affecting the market growth.

  • Infrastructure monitoring is a critical aspect of maintaining the productivity and efficiency of industrial processes, particularly in sectors such as power generation, oil and gas, telecommunications, and hospitality. However, the increasing automation of these systems brings new challenges, including heightened vulnerability to cyberattacks. Cybersecurity threats, such as data hacking, alteration, and security breaches, can disrupt operations and even lead to unethical use of sensitive information. With the proliferation of connected devices and reliance on web-based communication, networks are increasingly at risk.
  • However, smart materials and real-time data collection are essential components of infrastructure monitoring, but they also introduce new complexities. Infrastructure digital twins, asset management, and thermal monitoring are key strategies for mitigating these risks and ensuring the smooth functioning of industrial processes. As inflation continues to impact industries, investing in strong cybersecurity measures is essential to protect against potential losses and maintain operational excellence. 

Exclusive Customer Landscape

The market forecasting report includes the adoption lifecycle of the market, covering from the innovator's stage to the laggard's stage. It focuses on adoption rates in different regions based on penetration. Furthermore, the market report also includes key purchase criteria and drivers of price sensitivity to help companies evaluate and develop their market growth analysis strategies.
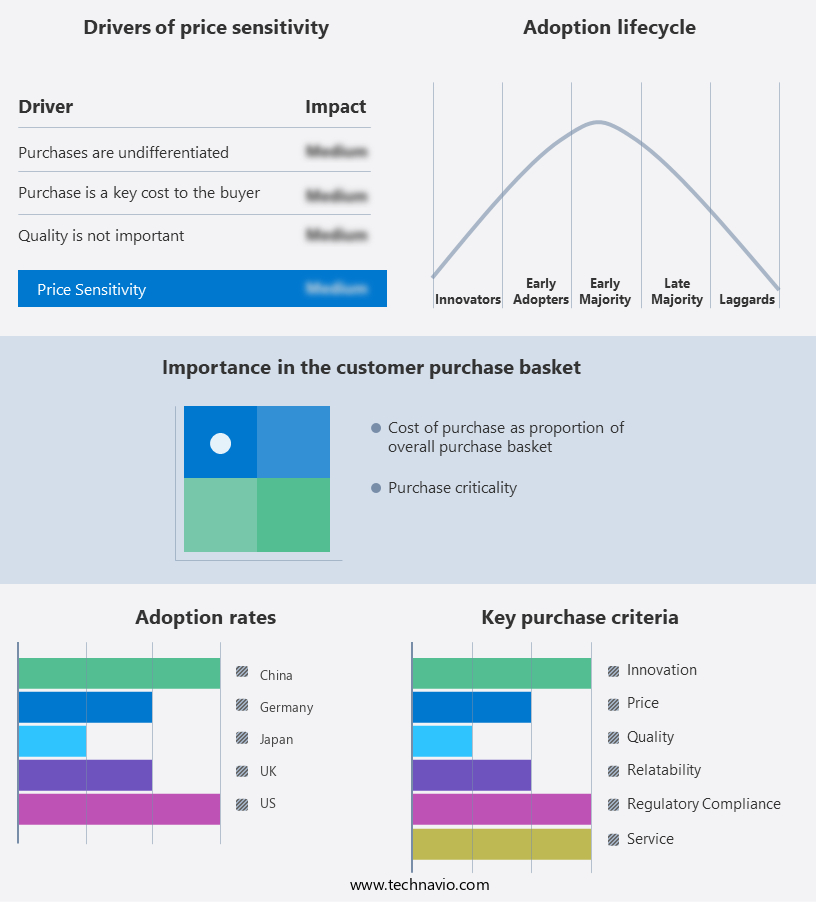
Infrastructure Monitoring Market Share by Geography

 Customer Landscape

Key Companies & Market Insights

Companies are implementing various strategies, such as strategic alliances, market forecast, partnerships, mergers and acquisitions, geographical expansion, and product/service launches, to enhance their presence in the market. 

The market research and growth report includes detailed analyses of the competitive landscape of the market and information about key companies, including:

  • Acellent Technologies Inc.
  • AES Engineering
  • Campbell Scientific Inc.
  • Digitexx Systems Ltd.
  • Emerson Electric Co.
  • Geocomp Corp.
  • GEOKON LLC
  • Geomotion Singapore Pte. Ltd.
  • Mabey Holdings Ltd.
  • Mistras Group Inc.
  • Monnit Corp.
  • Nova Ventures Group Corp.
  • OYO Corp.
  • RST Instruments Ltd.
  • Sisgeo S.r.l.
  • Sixense Group
  • Spectris Plc
  • STRUCTURAL MONITORING SYSTEMS plc
  • Toshiba Corp.
  • Xylem Inc.

Qualitative and quantitative analysis of companies has been conducted to help clients understand the wider business environment as well as the strengths and weaknesses of key market players. Data is qualitatively analyzed to categorize companies as pure play, category-focused, industry-focused, and diversified; it is quantitatively analyzed to categorize companies as dominant, leading, strong, tentative, and weak.

Research Analyst Overview

Infrastructure monitoring is a critical aspect of maintaining the reliability and efficiency of various industries, including telecommunications, utilities, transportation, construction, aerospace and defense, energy, mining, and civil infrastructure. The market is driven by the need for real-time data collection and analysis to ensure optimal performance and prevent damage or downtime. This market encompasses both hardware and services, with wired and wireless technology playing essential roles. Vibration monitoring, damage detection, and cybersecurity are key components of infrastructure monitoring solutions. The Internet of Things (IoT) and sensor technologies have revolutionized infrastructure monitoring, enabling smart cities, smart gadgets, and wearable technology to collect and analyze data in real-time.

Furthermore, critical infrastructure assets, such as power generation, transportation systems, and structural health, require advanced monitoring systems to ensure their safety and reliability. Cloud-based infrastructure and data management platforms facilitate data acquisition, storage, and analysis, while predictive analytics and structural monitoring systems help prevent potential issues before they become major problems. Inflation and the increasing importance of cybersecurity are key challenges in the market. However, advancements in technology integration, wireless monitoring, and the development of infrastructure digital twins offer significant opportunities for growth. Smart infrastructure and performance monitoring are also crucial areas of focus, as the market continues to evolve and adapt to the changing needs of industries and societies.

Market Scope

Report Coverage

Details

Page number

166

Base year

2023

Historic period

2018-2022

Forecast period

2024-2028

Growth momentum & CAGR

Accelerate at a CAGR of 8.9%

Market growth 2024-2028

USD 9.40 billion

Market structure

Fragmented

YoY growth 2023-2024(%)

8.1

Key countries

US, Germany, China, UK, Japan, Canada, India, South Korea, France, and Italy

Competitive landscape

Leading Companies, Market Positioning of Companies, Competitive Strategies, and Industry Risks

Request Free Sample

What are the Key Data Covered in this Market Research and Growth Report?

  • CAGR of the market during the forecast period
  • Detailed information on factors that will drive the market growth and forecasting between 2024 and 2028
  • Precise estimation of the size of the market  and its contribution of the market in focus to the parent market
  • Accurate predictions about upcoming market growth and trends and changes in consumer behaviour
  • Growth of the market across Europe, North America, APAC, Middle East and Africa, and South America
  • Thorough analysis of the market's competitive landscape and detailed information about companies
  • Comprehensive analysis of factors that will challenge the growth of market companies

We can help! Our analysts can customize this market research report to meet your requirements. Get in touch

1 Executive Summary

  • 1.1 Market overview
    • Executive Summary - Chart on Market Overview
    • Executive Summary - Data Table on Market Overview
    • Executive Summary - Chart on Global Market Characteristics
    • Executive Summary - Chart on Market by Geography
    • Executive Summary - Chart on Market Segmentation by Technology
    • Executive Summary - Chart on Incremental Growth
    • Executive Summary - Data Table on Incremental Growth
    • Executive Summary - Chart on Company Market Positioning

2 Technavio Analysis

  • 2.1 Analysis of price sensitivity, lifecycle, customer purchase basket, adoption rates, and purchase criteria
    • Analysis of price sensitivity, lifecycle, customer purchase basket, adoption rates, and purchase criteria
  • 2.2 Criticality of inputs and Factors of differentiation
    • Overview on criticality of inputs and factors of differentiation
  • 2.3 Factors of disruption
    • Overview on factors of disruption
  • 2.4 Impact of drivers and challenges
    • Impact of drivers and challenges in 2023 and 2028

3 Market Landscape

  • 3.1 Market ecosystem
    • Parent Market
    • Data Table on - Parent Market
  • 3.2 Market characteristics
    • Market characteristics analysis
  • 3.3 Value chain analysis
    • Value Chain Analysis

4 Market Sizing

  • 4.1 Market definition
    • Offerings of companies included in the market definition
  • 4.2 Market segment analysis
    • Market segments
  • 4.3 Market size 2023
    • 4.4 Market outlook: Forecast for 2023-2028
      • Chart on Global - Market size and forecast 2023-2028 ($ million)
      • Data Table on Global - Market size and forecast 2023-2028 ($ million)
      • Chart on Global Market: Year-over-year growth 2023-2028 (%)
      • Data Table on Global Market: Year-over-year growth 2023-2028 (%)

    5 Historic Market Size

    • 5.1 Global Infrastructure Monitoring Market 2018 - 2022
      • Historic Market Size - Data Table on Global Infrastructure Monitoring Market 2018 - 2022 ($ million)
    • 5.2 Technology segment analysis 2018 - 2022
      • Historic Market Size - Technology Segment 2018 - 2022 ($ million)
    • 5.3 Geography segment analysis 2018 - 2022
      • Historic Market Size - Geography Segment 2018 - 2022 ($ million)
    • 5.4 Country segment analysis 2018 - 2022
      • Historic Market Size - Country Segment 2018 - 2022 ($ million)

    6 Qualitative Analysis

    • 6.1 The impact of AI in Global Infrastructure Monitoring Market

      7 Five Forces Analysis

      • 7.1 Five forces summary
        • Five forces analysis - Comparison between 2023 and 2028
      • 7.2 Bargaining power of buyers
        • Bargaining power of buyers - Impact of key factors 2023 and 2028
      • 7.3 Bargaining power of suppliers
        • Bargaining power of suppliers - Impact of key factors in 2023 and 2028
      • 7.4 Threat of new entrants
        • Threat of new entrants - Impact of key factors in 2023 and 2028
      • 7.5 Threat of substitutes
        • Threat of substitutes - Impact of key factors in 2023 and 2028
      • 7.6 Threat of rivalry
        • Threat of rivalry - Impact of key factors in 2023 and 2028
      • 7.7 Market condition
        • Chart on Market condition - Five forces 2023 and 2028

      8 Market Segmentation by Technology

      • 8.1 Market segments
        • Chart on Technology - Market share 2023-2028 (%)
        • Data Table on Technology - Market share 2023-2028 (%)
      • 8.2 Comparison by Technology
        • Chart on Comparison by Technology
        • Data Table on Comparison by Technology
      • 8.3 Wireless - Market size and forecast 2023-2028
        • Chart on Wireless - Market size and forecast 2023-2028 ($ million)
        • Data Table on Wireless - Market size and forecast 2023-2028 ($ million)
        • Chart on Wireless - Year-over-year growth 2023-2028 (%)
        • Data Table on Wireless - Year-over-year growth 2023-2028 (%)
      • 8.4 Wired - Market size and forecast 2023-2028
        • Chart on Wired - Market size and forecast 2023-2028 ($ million)
        • Data Table on Wired - Market size and forecast 2023-2028 ($ million)
        • Chart on Wired - Year-over-year growth 2023-2028 (%)
        • Data Table on Wired - Year-over-year growth 2023-2028 (%)
      • 8.5 Market opportunity by Technology
        • Market opportunity by Technology ($ million)
        • Data Table on Market opportunity by Technology ($ million)

      9 Customer Landscape

      • 9.1 Customer landscape overview
        • Analysis of price sensitivity, lifecycle, customer purchase basket, adoption rates, and purchase criteria

      10 Geographic Landscape

      • 10.1 Geographic segmentation
        • Chart on Market share by geography 2023-2028 (%)
        • Data Table on Market share by geography 2023-2028 (%)
      • 10.2 Geographic comparison
        • Chart on Geographic comparison
        • Data Table on Geographic comparison
      • 10.3 Europe - Market size and forecast 2023-2028
        • Chart on Europe - Market size and forecast 2023-2028 ($ million)
        • Data Table on Europe - Market size and forecast 2023-2028 ($ million)
        • Chart on Europe - Year-over-year growth 2023-2028 (%)
        • Data Table on Europe - Year-over-year growth 2023-2028 (%)
      • 10.4 North America - Market size and forecast 2023-2028
        • Chart on North America - Market size and forecast 2023-2028 ($ million)
        • Data Table on North America - Market size and forecast 2023-2028 ($ million)
        • Chart on North America - Year-over-year growth 2023-2028 (%)
        • Data Table on North America - Year-over-year growth 2023-2028 (%)
      • 10.5 APAC - Market size and forecast 2023-2028
        • Chart on APAC - Market size and forecast 2023-2028 ($ million)
        • Data Table on APAC - Market size and forecast 2023-2028 ($ million)
        • Chart on APAC - Year-over-year growth 2023-2028 (%)
        • Data Table on APAC - Year-over-year growth 2023-2028 (%)
      • 10.6 Middle East and Africa - Market size and forecast 2023-2028
        • Chart on Middle East and Africa - Market size and forecast 2023-2028 ($ million)
        • Data Table on Middle East and Africa - Market size and forecast 2023-2028 ($ million)
        • Chart on Middle East and Africa - Year-over-year growth 2023-2028 (%)
        • Data Table on Middle East and Africa - Year-over-year growth 2023-2028 (%)
      • 10.7 South America - Market size and forecast 2023-2028
        • Chart on South America - Market size and forecast 2023-2028 ($ million)
        • Data Table on South America - Market size and forecast 2023-2028 ($ million)
        • Chart on South America - Year-over-year growth 2023-2028 (%)
        • Data Table on South America - Year-over-year growth 2023-2028 (%)
      • 10.8 US - Market size and forecast 2023-2028
        • Chart on US - Market size and forecast 2023-2028 ($ million)
        • Data Table on US - Market size and forecast 2023-2028 ($ million)
        • Chart on US - Year-over-year growth 2023-2028 (%)
        • Data Table on US - Year-over-year growth 2023-2028 (%)
      • 10.9 Germany - Market size and forecast 2023-2028
        • Chart on Germany - Market size and forecast 2023-2028 ($ million)
        • Data Table on Germany - Market size and forecast 2023-2028 ($ million)
        • Chart on Germany - Year-over-year growth 2023-2028 (%)
        • Data Table on Germany - Year-over-year growth 2023-2028 (%)
      • 10.10 China - Market size and forecast 2023-2028
        • Chart on China - Market size and forecast 2023-2028 ($ million)
        • Data Table on China - Market size and forecast 2023-2028 ($ million)
        • Chart on China - Year-over-year growth 2023-2028 (%)
        • Data Table on China - Year-over-year growth 2023-2028 (%)
      • 10.11 Canada - Market size and forecast 2023-2028
        • Chart on Canada - Market size and forecast 2023-2028 ($ million)
        • Data Table on Canada - Market size and forecast 2023-2028 ($ million)
        • Chart on Canada - Year-over-year growth 2023-2028 (%)
        • Data Table on Canada - Year-over-year growth 2023-2028 (%)
      • 10.12 UK - Market size and forecast 2023-2028
        • Chart on UK - Market size and forecast 2023-2028 ($ million)
        • Data Table on UK - Market size and forecast 2023-2028 ($ million)
        • Chart on UK - Year-over-year growth 2023-2028 (%)
        • Data Table on UK - Year-over-year growth 2023-2028 (%)
      • 10.13 Japan - Market size and forecast 2023-2028
        • Chart on Japan - Market size and forecast 2023-2028 ($ million)
        • Data Table on Japan - Market size and forecast 2023-2028 ($ million)
        • Chart on Japan - Year-over-year growth 2023-2028 (%)
        • Data Table on Japan - Year-over-year growth 2023-2028 (%)
      • 10.14 India - Market size and forecast 2023-2028
        • Chart on India - Market size and forecast 2023-2028 ($ million)
        • Data Table on India - Market size and forecast 2023-2028 ($ million)
        • Chart on India - Year-over-year growth 2023-2028 (%)
        • Data Table on India - Year-over-year growth 2023-2028 (%)
      • 10.15 South Korea - Market size and forecast 2023-2028
        • Chart on South Korea - Market size and forecast 2023-2028 ($ million)
        • Data Table on South Korea - Market size and forecast 2023-2028 ($ million)
        • Chart on South Korea - Year-over-year growth 2023-2028 (%)
        • Data Table on South Korea - Year-over-year growth 2023-2028 (%)
      • 10.16 France - Market size and forecast 2023-2028
        • Chart on France - Market size and forecast 2023-2028 ($ million)
        • Data Table on France - Market size and forecast 2023-2028 ($ million)
        • Chart on France - Year-over-year growth 2023-2028 (%)
        • Data Table on France - Year-over-year growth 2023-2028 (%)
      • 10.17 Italy - Market size and forecast 2023-2028
        • Chart on Italy - Market size and forecast 2023-2028 ($ million)
        • Data Table on Italy - Market size and forecast 2023-2028 ($ million)
        • Chart on Italy - Year-over-year growth 2023-2028 (%)
        • Data Table on Italy - Year-over-year growth 2023-2028 (%)
      • 10.18 Market opportunity by geography
        • Market opportunity by geography ($ million)
        • Data Tables on Market opportunity by geography ($ million)

      11 Drivers, Challenges, and Opportunity/Restraints

      • 11.1 Market drivers
        • 11.2 Market challenges
          • 11.3 Impact of drivers and challenges
            • Impact of drivers and challenges in 2023 and 2028
          • 11.4 Market opportunities/restraints

            12 Competitive Landscape

            • 12.1 Overview
              • 12.2 Competitive Landscape
                • Overview on criticality of inputs and factors of differentiation
              • 12.3 Landscape disruption
                • Overview on factors of disruption
              • 12.4 Industry risks
                • Impact of key risks on business

              13 Competitive Analysis

              • 13.1 Companies profiled
                • Companies covered
              • 13.2 Company ranking index
                • Company ranking index
              • 13.3 Market positioning of companies
                • Matrix on companies position and classification
              • 13.4 Acellent Technologies Inc.
                • Acellent Technologies Inc. - Overview
                • Acellent Technologies Inc. - Product / Service
                • Acellent Technologies Inc. - Key offerings
                • SWOT
              • 13.5 Campbell Scientific Inc.
                • Campbell Scientific Inc. - Overview
                • Campbell Scientific Inc. - Product / Service
                • Campbell Scientific Inc. - Key offerings
                • SWOT
              • 13.6 Emerson Electric Co.
                • Emerson Electric Co. - Overview
                • Emerson Electric Co. - Business segments
                • Emerson Electric Co. - Key news
                • Emerson Electric Co. - Key offerings
                • Emerson Electric Co. - Segment focus
                • SWOT
              • 13.7 GEOKON LLC
                • GEOKON LLC - Overview
                • GEOKON LLC - Product / Service
                • GEOKON LLC - Key offerings
                • SWOT
              • 13.8 Mistras Group Inc.
                • Mistras Group Inc. - Overview
                • Mistras Group Inc. - Business segments
                • Mistras Group Inc. - Key news
                • Mistras Group Inc. - Key offerings
                • Mistras Group Inc. - Segment focus
                • SWOT
              • 13.9 Sixense Group
                • Sixense Group - Overview
                • Sixense Group - Product / Service
                • Sixense Group - Key offerings
                • SWOT
              • 13.10 Spectris Plc
                • Spectris Plc - Overview
                • Spectris Plc - Business segments
                • Spectris Plc - Key news
                • Spectris Plc - Key offerings
                • Spectris Plc - Segment focus
                • SWOT
              • 13.11 STRUCTURAL MONITORING SYSTEMS plc
                • STRUCTURAL MONITORING SYSTEMS plc - Overview
                • STRUCTURAL MONITORING SYSTEMS plc - Business segments
                • STRUCTURAL MONITORING SYSTEMS plc - Key offerings
                • STRUCTURAL MONITORING SYSTEMS plc - Segment focus
                • SWOT
              • 13.12 Toshiba Corp.
                • Toshiba Corp. - Overview
                • Toshiba Corp. - Business segments
                • Toshiba Corp. - Key news
                • Toshiba Corp. - Key offerings
                • Toshiba Corp. - Segment focus
                • SWOT
              • 13.13 Xylem Inc.
                • Xylem Inc. - Overview
                • Xylem Inc. - Business segments
                • Xylem Inc. - Key news
                • Xylem Inc. - Key offerings
                • Xylem Inc. - Segment focus
                • SWOT

              14 Appendix

              • 14.1 Scope of the report
                • 14.2 Inclusions and exclusions checklist
                  • Inclusions checklist
                  • Exclusions checklist
                • 14.3 Currency conversion rates for US$
                  • Currency conversion rates for US$
                • 14.4 Research methodology
                  • Research methodology
                • 14.5 Data procurement
                  • Information sources
                • 14.6 Data validation
                  • Data validation
                • 14.7 Validation techniques employed for market sizing
                  • Validation techniques employed for market sizing
                • 14.8 Data synthesis
                  • Data synthesis
                • 14.9 360 degree market analysis
                  • 360 degree market analysis
                • 14.10 List of abbreviations
                  • List of abbreviations

                Research Methodology

                Technavio presents a detailed picture of the market by way of study, synthesis, and summation of data from multiple sources. The analysts have presented the various facets of the market with a particular focus on identifying the key industry influencers. The data thus presented is comprehensive, reliable, and the result of extensive research, both primary and secondary.

                INFORMATION SOURCES

                Primary sources

                • Manufacturers and suppliers
                • Channel partners
                • Industry experts
                • Strategic decision makers

                Secondary sources

                • Industry journals and periodicals
                • Government data
                • Financial reports of key industry players
                • Historical data
                • Press releases

                DATA ANALYSIS

                Data Synthesis

                • Collation of data
                • Estimation of key figures
                • Analysis of derived insights

                Data Validation

                • Triangulation with data models
                • Reference against proprietary databases
                • Corroboration with industry experts

                REPORT WRITING

                Qualitative

                • Market drivers
                • Market challenges
                • Market trends
                • Five forces analysis

                Quantitative

                • Market size and forecast
                • Market segmentation
                • Geographical insights
                • Competitive landscape

                Interested in this report?

                Get your sample now to see our research methodology and insights!

                Download Now

                Frequently Asked Questions

                Infrastructure Monitoring market growth will increase by $ 9402.7 mn during 2024-2028.

                The Infrastructure Monitoring market is expected to grow at a CAGR of 8.9% during 2024-2028.

                Infrastructure Monitoring market is segmented by Technology( Wireless, Wired)

                Acellent Technologies Inc., AES Engineering, Campbell Scientific Inc., Digitexx Systems Ltd., Emerson Electric Co., Geocomp Corp., GEOKON LLC, Geomotion Singapore Pte. Ltd., Mabey Holdings Ltd., Mistras Group Inc., Monnit Corp., Nova Ventures Group Corp., OYO Corp., RST Instruments Ltd., Sisgeo S.r.l., Sixense Group, Spectris Plc, STRUCTURAL MONITORING SYSTEMS plc, Toshiba Corp., Xylem Inc. are a few of the key vendors in the Infrastructure Monitoring market.

                Europe will register the highest growth rate of 32% among the other regions. Therefore, the Infrastructure Monitoring market in Europe is expected to garner significant business opportunities for the vendors during the forecast period.

                US, Germany, China, UK, Japan, Canada, India, South Korea, France, Italy

                • Rise in global construction and infrastructure development activitiesThe rise in global building construction and infrastructure activities will drive the demand in the global infrastructure monitoring market. The number of new constructions in several developed and emerging countries is on the rise after the prolonged depression in the construction market. The recovery in the US economy has created optimism among homebuyers is the driving factor this market.
                • leading to a demand for new single and multi-family homes. It is also expected that the pent-up demand from the recession period will also drive the demand in the housing market. For instance is the driving factor this market.
                • US construction spending rose to a record high in November 2020 is the driving factor this market.
                • boosted by a robust housing market amid historically low mortgage rates. Further is the driving factor this market.
                • according to the US Commerce Department is the driving factor this market.
                • spending increased 0.9% to $1.459 trillion is the driving factor this market.
                • the highest level since the government started tracking the series in 2002. Furthermore is the driving factor this market.
                • data for October was revised higher to show construction outlays accelerating 1.6% instead of 1.3%. Several private players in the construction industry are also undertaking new commercial mega-projects is the driving factor this market.
                • of which many are already in the construction phase. For instance is the driving factor this market.
                • real estate developers RELATED and SL Green Realty are building two modern skyscrapers in New York is the driving factor this market.
                • with a cumulative investment of around $7.08 billion. Europe will be the largest market for infrastructure monitoring during the forecast period. Furthermore is the driving factor this market.
                • development activities in APAC and the Middle East will emerge the regional position as the fastest-growing markets during the forecast period. The fastest-growing infrastructure monitoring markets will include India is the driving factor this market.
                • China is the driving factor this market.
                • Malaysia is the driving factor this market.
                • Saudi Arabia is the driving factor this market.
                • and the UAE. The growing population in these countries is the driving factor this market.
                • along with rapid urbanization and industrialization is the driving factor this market.
                • is expected to push the demand for new residential and commercial constructions. For instance is the driving factor this market.
                • India has set an ambition to modernize infrastructure is the driving factor this market.
                • advance its cities with 'smart' development is the driving factor this market.
                • and boost employment; India is expected to become the third-largest construction market in the world by 2025. Furthermore is the driving factor this market.
                • to facilitate growth is the driving factor this market.
                • the Indian government has relaxed foreign investment norms in the construction industry is the driving factor this market.
                • and in 2020 is the driving factor this market.
                • the real estate sector alone received an investment worth $5 billion. The government is also aiming to provide housing for all the people in the country. More than $31 billion has been earmarked as central government aid to achieve this target by 2022. Qatar will be hosting the 2022 FIFA World Cup. The country has spent multi-billion dollars on upgrading its residential and commercial infrastructure before the games are held. It is expected that Qatar had spent around $200 billion between 2017 and 2021 on developing new stadiums is the driving factor this market.
                • airports is the driving factor this market.
                • and retail and residential infrastructure to host the tournament is the driving factor this market.
                • which creates huge opportunities for the growth of the infrastructure monitoring market. The construction and infrastructure sectors are growing rapidly in different parts of the world. Countries such as China is the driving factor this market.
                • India is the driving factor this market.
                • Paraguay is the driving factor this market.
                • Brazil is the driving factor this market.
                • Indonesia is the driving factor this market.
                • Vietnam is the driving factor this market.
                • and Russia are experiencing heavy industrialization activities. The growth in industrialization and infrastructure developments has propelled the demand for infrastructure monitoring globally. The growing demand for public infrastructure in emerging economies is the driving factor this market.
                • such as India and China is the driving factor this market.
                • is contributing to the growth of the construction industry in these economies. Many new hospitals is the driving factor this market.
                • educational institutions is the driving factor this market.
                • stadiums is the driving factor this market.
                • indoor sports complexes is the driving factor this market.
                • malls is the driving factor this market.
                • and mega shopping centers have been built in the last few years because of the growing population and the increasing per capita income of individuals. Various government initiatives and major investments in new projects have further boosted the growth of the construction industry. For instance is the driving factor this market.
                • the Indian Government launched the Housing for All by 2022 initiative in 2015 is the driving factor this market.
                • which has propelled the growth of the construction industry in India. Through this initiative is the driving factor this market.
                • the government is expected to provide funds for constructing over 20 million new houses is the driving factor this market.
                • with a carpet area of up to 30 square meters is the driving factor this market.
                • by the end of 2022. Under this mission is the driving factor this market.
                • the government is also expected to build new water storage facilities is the driving factor this market.
                • power infrastructure is the driving factor this market.
                • and social infrastructures is the driving factor this market.
                • such as indoor sports complexes is the driving factor this market.
                • livelihood centers is the driving factor this market.
                • and community centers. Hence is the driving factor this market.
                • there is a wide scope for utilizing infrastructure monitoring techniques in these newly constructed buildings due to their cost-effectiveness and flexibility. Thus is the driving factor this market.
                • the abovementioned construction and infrastructure development activities are expected to raise the demand for infrastructure monitoring devices exponentially during the forecast period. is the driving factor this market.

                The Infrastructure Monitoring market vendors should focus on grabbing business opportunities from the Wireless segment as it accounted for the largest market share in the base year.