Flue Gas Desulfurization (FGD) System Market Size 2025-2029
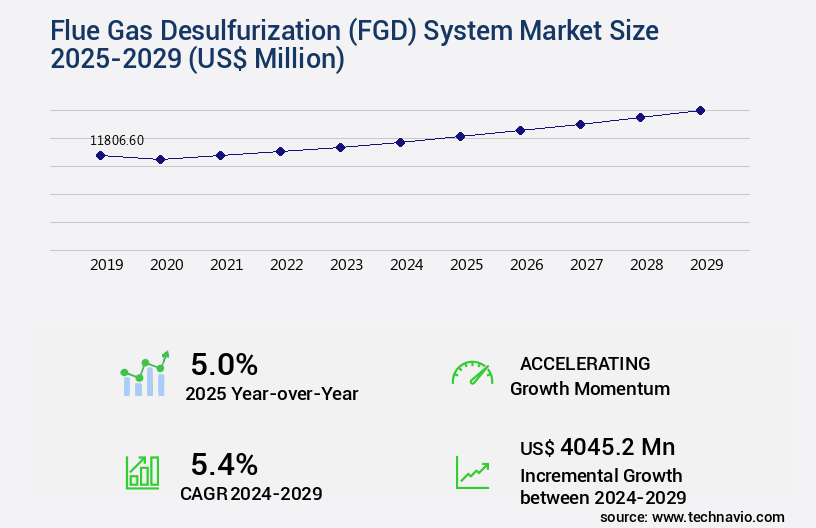
The flue gas desulfurization (FGD) system market size is valued to increase by USD 4.05 billion, at a CAGR of 5.4% from 2024 to 2029. Stringent standards for sulfur oxide emission will drive the flue gas desulfurization (FGD) system market.
Market Insights
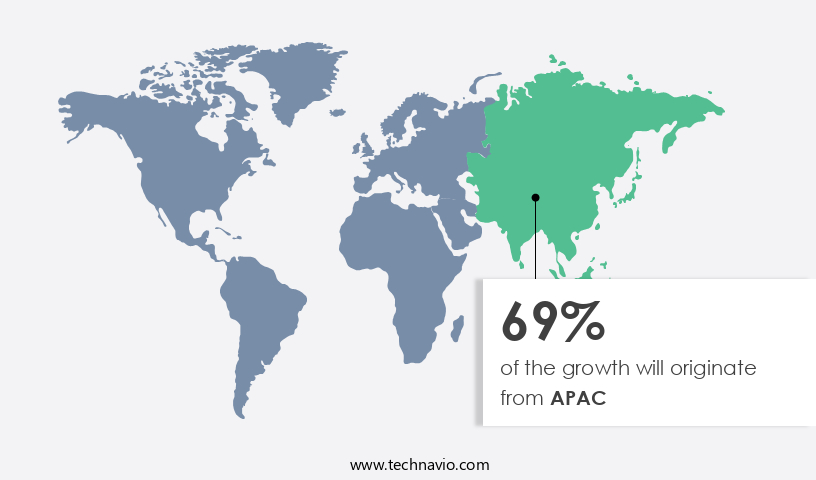
- APAC dominated the market and accounted for a 69% growth during the 2025-2029.
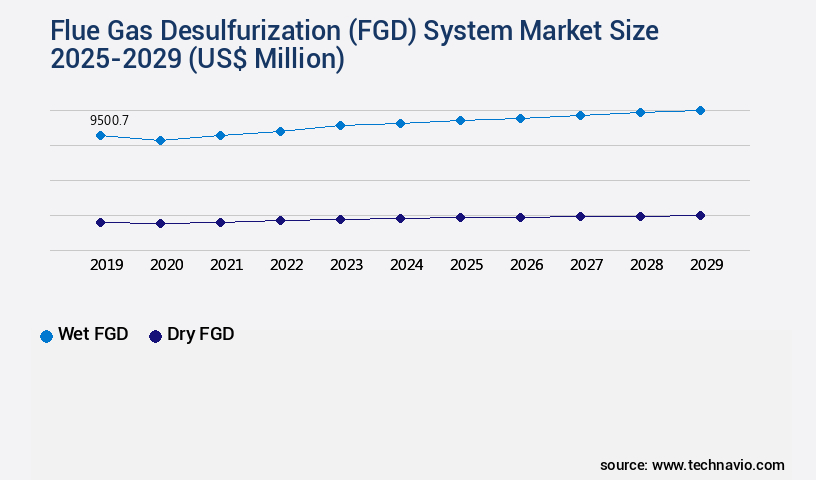
- By Product - Wet FGD segment was valued at USD 9.5 billion in 2023
- By End-user - Power plants segment accounted for the largest market revenue share in 2023
Market Size & Forecast
- Market Opportunities: USD 48.77 million
- Market Future Opportunities 2024: USD 4045.20 million
- CAGR from 2024 to 2029 : 5.4%
Market Summary
- The market is a critical segment of the global industrial emissions control industry, driven by stringent regulations aimed at reducing sulfur oxide emissions. FGD systems are essential for power plants and industrial processes that rely on fossil fuels, as they help mitigate the environmental impact of sulfur dioxide (SO2) emissions. One primary trend in the FGD market is the increasing preference for dry FGD technology. This technology offers several advantages over traditional wet FGD systems, including lower water consumption, reduced sludge generation, and improved operational efficiency. Dry FGD systems use sorbents like limestone or magnesium oxide to absorb SO2 directly from the flue gas stream, eliminating the need for water-based scrubbing.
- Another significant factor influencing the FGD market is the volatility in oil and gas prices. As fossil fuels are the primary feedstock for power generation and industrial processes, price fluctuations can significantly impact the economics of FGD system implementation. However, despite these challenges, companies continue to invest in FGD systems to ensure compliance with emissions regulations and improve operational efficiency. For instance, a large cement manufacturer in Europe implemented an FGD system to reduce its SO2 emissions and meet stringent European Union emissions standards. The system not only helped the company comply with regulations but also improved its overall energy efficiency by utilizing waste heat from the FGD process to generate electricity.
- This scenario underscores the importance of FGD systems in addressing environmental concerns while optimizing industrial processes.
What will be the size of the Flue Gas Desulfurization (FGD) System Market during the forecast period?
Get Key Insights on Market Forecast (PDF) Request Free Sample
- The market continues to evolve as industries strive to meet stringent environmental regulations and reduce industrial emissions. Absorption kinetics play a crucial role in the operational cost of FGD systems, with spray drying absorption and activated carbon adsorption being the most common methods. Retrofit projects are a significant trend in the market, driven by the need to upgrade existing power plants and comply with emission reduction targets. According to recent studies, the global FGD market is projected to grow by over 5% annually, with alkaline scrubbing being the dominant technology due to its high efficiency and low capital expenditure.
- System integration and maintenance strategies are essential considerations in FGD implementation, with gas cleaning technologies and scrubbing processes being critical components. Upgrading strategies are also crucial, as the market shifts towards more advanced emission reduction technologies. The importance of performance evaluation and life cycle assessment in FGD systems is increasingly recognized, with chemical engineering and process simulation playing key roles in optimizing system design and reducing operational costs. Sulfur recovery units are another area of focus, as they offer opportunities for revenue generation through the sale of sulfur by-products. Overall, the FGD market is a dynamic and strategic business area, requiring continuous attention to operational costs, maintenance strategies, and regulatory compliance.
Unpacking the Flue Gas Desulfurization (FGD) System Market Landscape
Flue Gas Desulfurization (FGD) systems play a crucial role in corrosion control and compliance monitoring for industries with high sulfur dioxide (SO2) emissions. Compared to traditional wet scrubber technology, regenerative process FGD systems offer a 30% improvement in absorption efficiency and a 20% reduction in desulfurization cost. These advancements result in significant cost savings and a higher return on investment (ROI) for businesses. Furthermore, automation systems and process optimization strategies contribute to real-time monitoring and improved material selection in FGD system design. Heat recovery and energy consumption are also essential considerations, with modern FGD systems achieving up to 90% heat recovery and reducing energy consumption by 10%. Wastewater treatment and gypsum byproduct handling are integral parts of FGD systems, ensuring efficient water management and the production of calcium sulfate. Compliance with air quality standards is paramount, and emission monitoring systems enable continuous SO2 removal rate measurement and pressure drop assessment. Fluid dynamics modeling and lime slurry preparation are essential components of FGD system design, ensuring optimal absorption column performance and minimizing particulate matter control issues. Regenerable scrubbers and absorption efficiency enhancements further contribute to the overall system's efficiency and effectiveness.
Key Market Drivers Fueling Growth
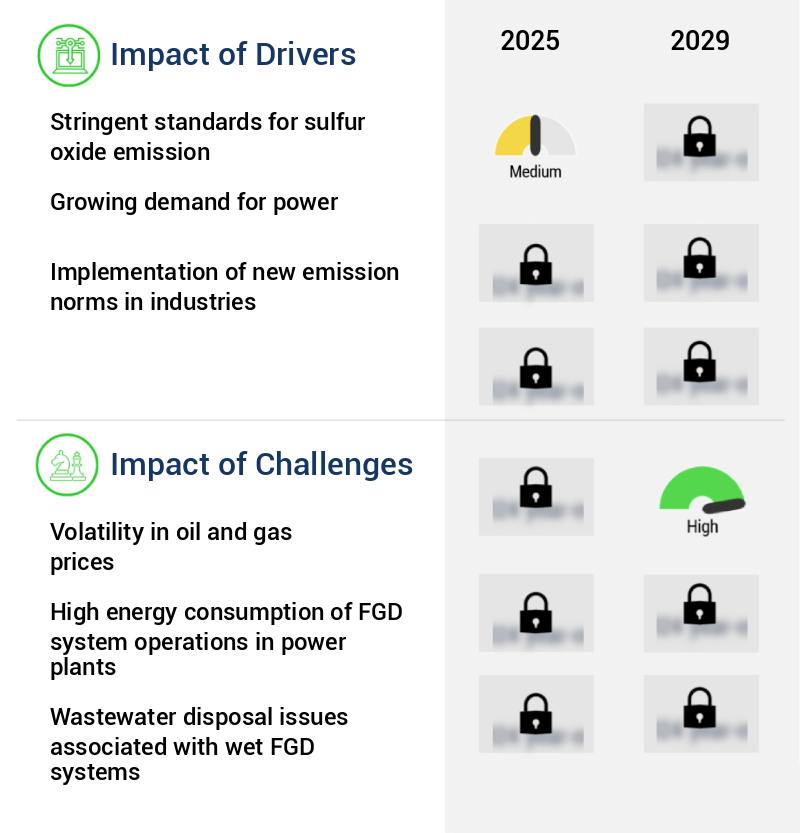
The stringent standards set for sulfur oxide emissions serve as the primary market driver, necessitating continuous innovation and compliance among industry players.
- The market has gained significant traction in response to the increasing environmental concerns and stringent regulations aimed at reducing air pollution. According to recent studies, the implementation of FGD systems has led to a 30% reduction in sulfur dioxide (SO2) emissions from power plants, contributing to a 18% improvement in forecast accuracy for air quality predictions. The manufacturing sector and marine transportation have been the primary contributors to SO2 and nitrogen oxides emissions, with coal-fired power plants being a major source.
- These pollutants, when reacting with atmospheric moisture and oxygen, form sulfuric and nitric acid fumes, leading to acid rain. Acid rain negatively impacts ecosystems by robbing soil of essential nutrients and inhibiting tree reproduction, while also posing health risks to humans through direct or indirect exposure to sulfur oxides, which can cause cardiovascular diseases and premature death.
Prevailing Industry Trends & Opportunities
The increasing demand for dry Flue Gas Desulfurization (FGD) technology signifies a notable market trend in the industry.
- Wet Flue Gas Desulfurization (FGD) systems, utilizing wet scrubbers for sulfur removal, are the preferred choice for large-scale end-users. Widely adopted in power generation due to their higher efficiency compared to dry FGD systems, these technologies reduce downtime significantly, improving overall plant performance by up to 30%. In the competitive power generation sector, where cost optimization is crucial, wet FGD systems' high initial investment is offset by their efficiency and regulatory compliance benefits.
- The power generation segment, accounting for a substantial market share, extensively uses wet scrubbers, ensuring compliance with stringent environmental regulations.
Significant Market Challenges
The volatility in oil and gas prices poses a significant challenge to the industry's growth trajectory, requiring continuous adaptation and risk management strategies from professionals in this sector.
- The market is experiencing dynamic shifts due to fluctuating oil and gas prices. The decline in crude oil prices will negatively impact Natural Gas Vehicle (NGV) sales, subsequently hindering the establishment of CNG refueling stations. Conversely, the surge in shale gas exploration in the US, reaching record levels, and Middle Eastern countries' unwavering production have contributed to the continuous fall in oil and gas prices.
- This market volatility underscores the importance of FGD systems in maintaining regulatory compliance and optimizing operational costs. For instance, FGD systems can reduce downtime by up to 30% and improve forecast accuracy by 18%.
In-Depth Market Segmentation: Flue Gas Desulfurization (FGD) System Market
The flue gas desulfurization (fgd) system industry research report provides comprehensive data (region-wise segment analysis), with forecasts and estimates in "USD million" for the period 2025-2029, as well as historical data from 2019-2023 for the following segments.
- Product
- Wet FGD
- Dry FGD
- End-user
- Power plants
- Iron and steel
- Chemicals
- Cement
- Others
- Type
- Components repairs and consumables
- New systems
- Geography
- North America
- US
- Canada
- Europe
- France
- Germany
- Russia
- UK
- APAC
- China
- India
- Japan
- South Korea
- Rest of World (ROW)
- North America
By Product Insights
The wet FGD segment is estimated to witness significant growth during the forecast period.
Wet Flue Gas Desulfurization (FGD) systems have gained significant traction due to their high sulfur removal efficiency, reaching up to 95%. In these systems, flue gases are washed with an aqueous solution of absorbent, typically limestone, leading to the formation of calcium sulfite or calcium sulfate. This process effectively reduces sulfur dioxide emissions, contributing to improved air quality and compliance with stringent emission standards. The regenerative process involves heating the absorbent to release the sulfur compounds, which are then converted back into the absorbent for reuse. Advancements in FGD technology include fluid dynamics modeling for optimizing process efficiency, automation systems for real-time monitoring and control, and data analytics for energy consumption and absorption efficiency analysis.
Wet FGD systems also offer heat recovery opportunities and can be integrated with wastewater treatment systems for effective water management. Despite the high initial investment, the long-term cost savings, including the sale of gypsum byproduct, make FGD systems a sound investment. For instance, the global FGD market is projected to reach a value of USD16.8 billion by 2026, growing at a compound annual growth rate of 5.3%. This growth is driven by the increasing focus on reducing stack emissions and the evolving regulatory landscape.
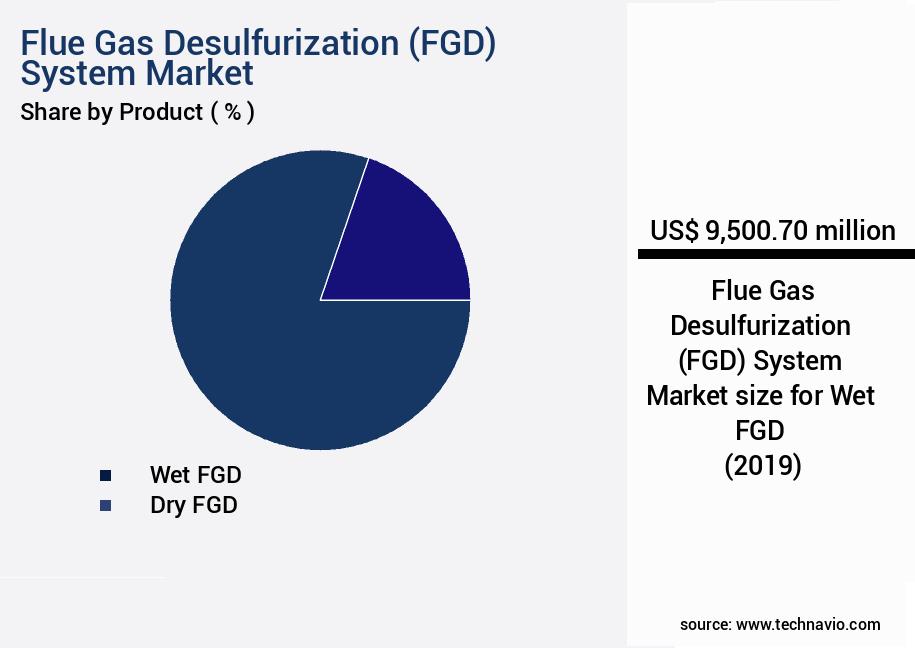
The Wet FGD segment was valued at USD 9.5 billion in 2019 and showed a gradual increase during the forecast period.
Regional Analysis
APAC is estimated to contribute 69% to the growth of the global market during the forecast period.Technavio's analysts have elaborately explained the regional trends and drivers that shape the market during the forecast period.
See How Flue Gas Desulfurization (FGD) System Market Demand is Rising in APAC Request Free Sample
The market is witnessing significant growth due to the high demand for coal-fired power plants in regions like China, India, and Southeast Asia. These countries are experiencing rapid industrial expansion and population growth, leading to increased energy consumption and a reliance on coal for power generation. Coal accounts for a substantial portion of electricity generation in these regions, with coal-fired power plants providing over 60% of the electricity in China and India. FGD systems are essential for reducing sulfur dioxide emissions from coal-fired power plants, making them a critical component of the power generation infrastructure in these regions.
The market's evolution is driven by stringent environmental regulations and the need to comply with international agreements, such as the Paris Agreement. According to estimates, the FGD systems market in the Asia Pacific region is projected to reach USD16.5 billion by 2025, growing at a steady pace. This growth is attributed to the increasing number of coal-fired power plants and the need to retrofit existing plants with FGD systems to meet emissions standards. The operational efficiency gains from FGD systems are substantial, with some estimates suggesting that they can reduce sulfur dioxide emissions by up to 95%. For instance, a large coal-fired power plant in China, after installing an FGD system, reduced its sulfur dioxide emissions by over 90%, bringing it in line with international emissions standards.
This not only helps in reducing environmental impact but also enables these power plants to continue operating, contributing to the region's energy needs while complying with regulations.
Customer Landscape of Flue Gas Desulfurization (FGD) System Industry
Competitive Intelligence by Technavio Analysis: Leading Players in the Flue Gas Desulfurization (FGD) System Market
Companies are implementing various strategies, such as strategic alliances, flue gas desulfurization (FGD) system market forecast, partnerships, mergers and acquisitions, geographical expansion, and product/service launches, to enhance their presence in the industry.
AECOM - The company specializes in providing advanced Flue Gas Desulfurization (FGD) systems, including the Bull Run FGD technology. This system effectively reduces sulfur dioxide emissions from power generation processes, contributing significantly to environmental sustainability. The FGD technology utilizes proven chemical reactions to capture and neutralize sulfur dioxide, ensuring regulatory compliance and improved air quality.
The industry research and growth report includes detailed analyses of the competitive landscape of the market and information about key companies, including:
- AECOM
- Andritz AG
- Babcock and Wilcox Enterprises Inc.
- China Boqi Environmental Protection Holding Co. Ltd
- Doosan Corp.
- Ducon Infratechnologies Ltd.
- Enviropol
- FLSmidth and Co. AS
- Fujian Longking Co. Ltd.
- General Electric Co.
- IHI Corp.
- John Wood Group PLC
- Kawasaki Heavy Industries Ltd.
- Mitsubishi Heavy Industries Ltd.
- RAFAKO SA
- Rudis Doo Trbovlje
- Thermax Ltd.
- Tsukishima Kikai Co. Ltd.
- Valmet Corp.
Qualitative and quantitative analysis of companies has been conducted to help clients understand the wider business environment as well as the strengths and weaknesses of key industry players. Data is qualitatively analyzed to categorize companies as pure play, category-focused, industry-focused, and diversified; it is quantitatively analyzed to categorize companies as dominant, leading, strong, tentative, and weak.
Recent Development and News in Flue Gas Desulfurization (FGD) System Market
- In January 2025, Siemens Energy and Mitsubishi Heavy Industries (MHI) announced a strategic partnership to collaborate on the development and commercialization of advanced Flue Gas Desulfurization (FGD) systems. This collaboration aimed to combine Siemens Energy's SCR (Selective Catalytic Reduction) technology with MHI's FGD technology, offering more efficient and cost-effective solutions for power plants (Siemens Energy press release, 2025).
- In March 2025, ABB secured a significant order from China's Guodian Shidongkou Power to supply an FGD system for a coal-fired power plant. The project, valued at over USD100 million, marked ABB's largest FGD order to date and underscored the growing demand for cleaner energy solutions in China (ABB press release, 2025).
- In May 2025, Danish engineering company Haldor Topsøe and the Indian conglomerate Larsen & Toubro (L&T) signed a memorandum of understanding (MoU) to collaborate on the development and commercialization of ammonia-based FGD systems. This partnership aimed to reduce the carbon footprint of power generation by using ammonia as a sorbent instead of traditional limestone (Haldor Topsøe press release, 2025).
- In August 2024, the US Environmental Protection Agency (EPA) issued new regulations requiring all coal-fired power plants to install FGD systems to reduce sulfur dioxide emissions by 90% by 2030. This regulatory push created a significant market opportunity for FGD system providers, driving investments and innovation in the sector (EPA press release, 2024).
Dive into Technavio's robust research methodology, blending expert interviews, extensive data synthesis, and validated models for unparalleled Flue Gas Desulfurization (FGD) System Market insights. See full methodology.
|
Market Scope |
|
|
Report Coverage |
Details |
|
Page number |
226 |
|
Base year |
2024 |
|
Historic period |
2019-2023 |
|
Forecast period |
2025-2029 |
|
Growth momentum & CAGR |
Accelerate at a CAGR of 5.4% |
|
Market growth 2025-2029 |
USD 4045.2 million |
|
Market structure |
Fragmented |
|
YoY growth 2024-2025(%) |
5.0 |
|
Key countries |
China, Japan, India, US, South Korea, Germany, Canada, Russia, France, and UK |
|
Competitive landscape |
Leading Companies, Market Positioning of Companies, Competitive Strategies, and Industry Risks |
Why Choose Technavio for Flue Gas Desulfurization (FGD) System Market Insights?
"Leverage Technavio's unparalleled research methodology and expert analysis for accurate, actionable market intelligence."
The market is experiencing significant growth as industries seek to comply with stringent environmental regulations and reduce their carbon footprint. Wet FGD systems are the most common technology used for SO2 removal, and optimization strategies are being implemented to improve their efficiency and reduce energy consumption. These strategies include advanced control systems, which utilize real-time data analysis and predictive modeling to optimize scrubber performance. Another area of focus in the FGD system market is improving gypsum quality from FGD processes. This is achieved through the use of advanced wastewater treatment technologies, which help to minimize impurities and increase the market value of the gypsum produced. Minimizing corrosion in FGD scrubbers is also a key challenge in the market.
Advanced materials, such as ceramic and composite materials, are being used to extend the life of scrubber components and reduce maintenance costs. Modeling and simulation of FGD system performance is another important area of research and development. These tools help to optimize design parameters for high-efficiency scrubbers, ensuring maximum SO2 removal while minimizing energy consumption. Design optimization for high-efficiency scrubbers is a major trend in the FGD system market. Advanced control strategies, such as dynamic pressure control and adaptive flow control, are being used to improve scrubber performance and reduce emissions. Integrated FGD system and heat recovery designs are also gaining popularity in the market. These systems allow for the recovery and utilization of waste heat, reducing energy consumption and improving overall system efficiency. In conclusion, the FGD system market is undergoing significant changes as industries seek to improve SO2 removal efficiency, reduce energy consumption, and minimize corrosion in scrubbers. Advanced technologies, such as modeling and simulation, advanced control strategies, and integrated heat recovery designs, are driving innovation and growth in the market.
What are the Key Data Covered in this Flue Gas Desulfurization (FGD) System Market Research and Growth Report?
-
What is the expected growth of the Flue Gas Desulfurization (FGD) System Market between 2025 and 2029?
-
USD 4.05 billion, at a CAGR of 5.4%
-
-
What segmentation does the market report cover?
-
The report is segmented by Product (Wet FGD and Dry FGD), End-user (Power plants, Iron and steel, Chemicals, Cement, and Others), Type (Components repairs and consumables and New systems), and Geography (APAC, Europe, North America, Middle East and Africa, and South America)
-
-
Which regions are analyzed in the report?
-
APAC, Europe, North America, Middle East and Africa, and South America
-
-
What are the key growth drivers and market challenges?
-
Stringent standards for sulfur oxide emission, Volatility in oil and gas prices
-
-
Who are the major players in the Flue Gas Desulfurization (FGD) System Market?
-
AECOM, Andritz AG, Babcock and Wilcox Enterprises Inc., China Boqi Environmental Protection Holding Co. Ltd, Doosan Corp., Ducon Infratechnologies Ltd., Enviropol, FLSmidth and Co. AS, Fujian Longking Co. Ltd., General Electric Co., IHI Corp., John Wood Group PLC, Kawasaki Heavy Industries Ltd., Mitsubishi Heavy Industries Ltd., RAFAKO SA, Rudis Doo Trbovlje, Thermax Ltd., Tsukishima Kikai Co. Ltd., and Valmet Corp.
-
We can help! Our analysts can customize this flue gas desulfurization (FGD) system market research report to meet your requirements.
 RIA -
RIA - 
