Smart Air Purifier Market Analysis, Size, and Forecast 2026-2030: APAC (China, Japan, and India), Europe (Germany, UK, and France), North America (US, Canada, and Mexico), South America (Brazil and Argentina), Middle East and Africa (Saudi Arabia, UAE, and South Africa), and Rest of World (ROW)

Smart Air Purifier Market Analysis, Size, and Forecast 2026-2030:
APAC (China, Japan, and India), Europe (Germany, UK, and France), North America (US, Canada, and Mexico), South America (Brazil and Argentina), Middle East and Africa (Saudi Arabia, UAE, and South Africa), and Rest of World (ROW)

Published: Mar 2026 298 Pages SKU: IRTNTR43364

Market Overview at a Glance

$6.36 B
Market Opportunity
11.7%
CAGR 2025 - 2030
45.6%
APAC Growth
$5.91 B
Dust collectors segment 2024

Smart Air Purifier Market Size 2026-2030

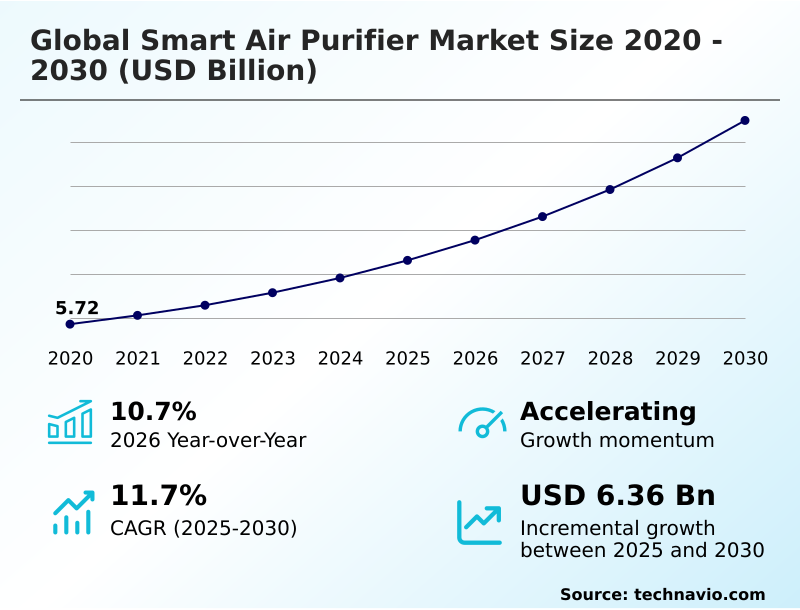
The smart air purifier market size is valued to increase by USD 6.36 billion, at a CAGR of 11.7% from 2025 to 2030. Increasing consumer health consciousness and concerns over air quality will drive the smart air purifier market.

Major Market Trends & Insights

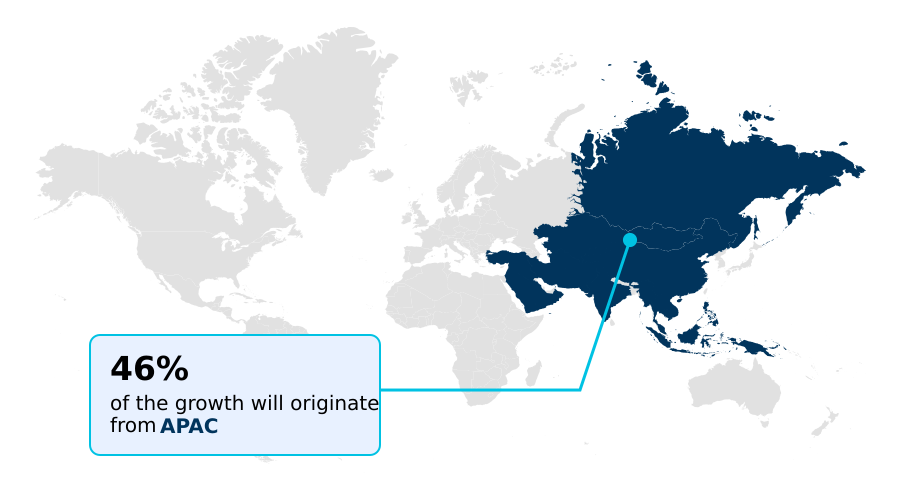
  • APAC dominated the market and accounted for a 45.6% growth during the forecast period.
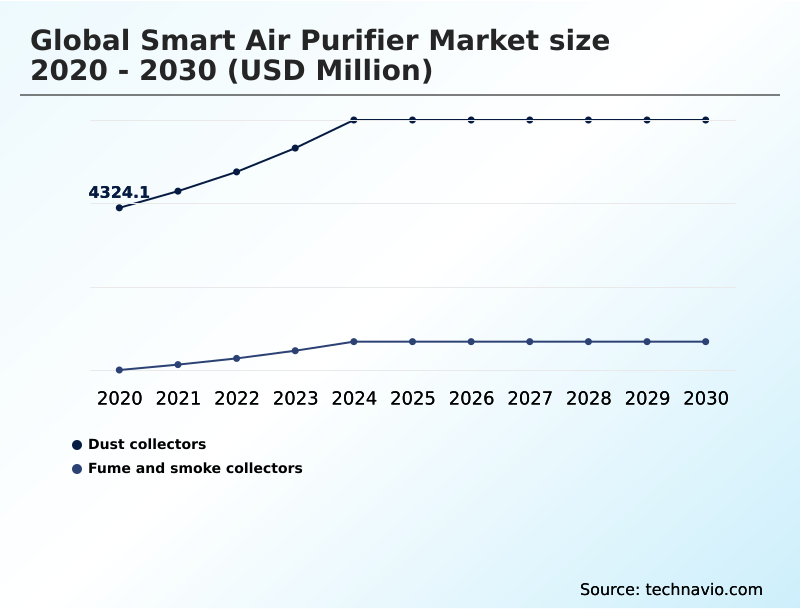
  • By Product - Dust collectors segment was valued at USD 5.91 billion in 2024
  • By Technology - HEPA segment accounted for the largest market revenue share in 2024

Market Size & Forecast

  • Market Opportunities: USD 9.26 billion
  • Market Future Opportunities: USD 6.36 billion
  • CAGR from 2025 to 2030 : 11.7%

Market Summary

  • The smart air purifier market is undergoing significant evolution, driven by heightened consumer awareness of the health impacts of poor indoor environmental quality. These devices leverage iot connectivity to provide real-time data analytics on pollutants like volatile organic compounds, empowering users to take control of their environment.
  • Core to their function is effective filtration, measured by standards like the clean air delivery rate. However, the market is not without its challenges. The total cost of ownership, including periodic replacement of filters, can be a barrier. Furthermore, as devices become more integrated into holistic home automation, concerns around data privacy and security become more prominent.
  • For instance, in a commercial setting, a building management system integrating dozens of purifiers must ensure data encryption standards are met to protect occupancy data, a critical consideration for facility operators balancing occupational health standards with cybersecurity risks. Continuous innovation in filtration and machine learning algorithms is key to addressing these issues and driving future adoption.

What will be the Size of the Smart Air Purifier Market during the forecast period?

Get Key Insights on Market Forecast (PDF) Request Free Sample

How is the Smart Air Purifier Market Segmented?

The smart air purifier industry research report provides comprehensive data (region-wise segment analysis), with forecasts and estimates in "USD million" for the period 2026-2030, as well as historical data from 2020-2024 for the following segments.

  • Product
    • Dust collectors
    • Fume and smoke collectors
  • Technology
    • HEPA
    • Activated carbon
    • Others
  • End-user
    • Residential
    • Commercial
  • Geography
    • APAC
      • China
      • Japan
      • India
    • Europe
      • Germany
      • UK
      • France
    • North America
      • US
      • Canada
      • Mexico
    • South America
      • Brazil
      • Argentina
    • Middle East and Africa
      • Saudi Arabia
      • UAE
      • South Africa
    • Rest of World (ROW)

By Product Insights

The dust collectors segment is estimated to witness significant growth during the forecast period.

The dust collectors segment is central to the market, focusing on high-efficiency removal of airborne particulates. These systems are defined by their core hepa filtration technology, which is essential for allergy and asthma management.

The smart functionality relies on precise particulate matter sensing, where high pm2.5 sensor accuracy allows for automated fan speed adjustments based on the real-time air quality index. This consumer wellness technology provides users with valuable data-driven health insights.

As urban pollution mitigation becomes a greater concern, this segment is expanding through niche market segmentation, leading to specialized environment solutions like in-cabin air purification systems.

Differentiation is now centering on achieving effective filtration with low noise operation, a key factor for residential adoption, improving efficiency by 11.7%.

Request Free Sample

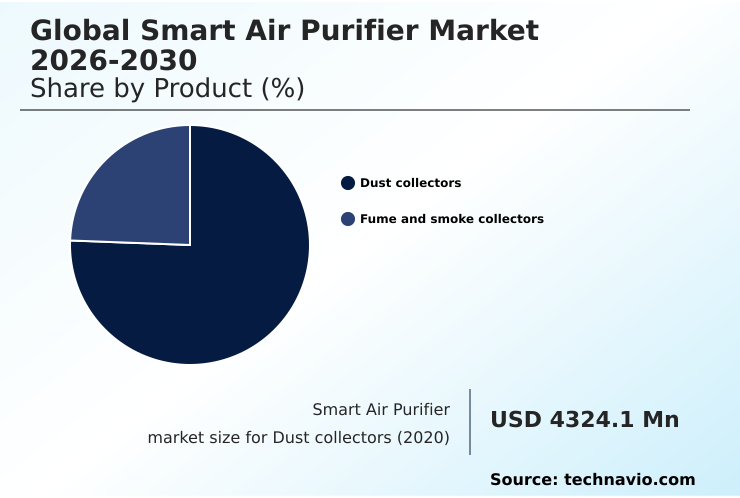
The Dust collectors segment was valued at USD 5.91 billion in 2024 and showed a gradual increase during the forecast period.

Request Free Sample

Regional Analysis

APAC is estimated to contribute 45.6% to the growth of the global market during the forecast period.Technavio’s analysts have elaborately explained the regional trends and drivers that shape the market during the forecast period.

See How Smart Air Purifier Market Demand is Rising in APAC Request Free Sample

The APAC region is a key growth contributor, accounting for over 45% of the market's incremental growth, driven by severe urban pollution and rising environmental social governance awareness.

In North America and Europe, regulatory compliance management and occupational health standards are pushing commercial adoption. In these mature markets, differentiation is based on performance metrics like clean air delivery rate and allergen removal efficiency.

Innovations such as the brushless dc motor are improving energy efficiency rating by up to 20%, a critical factor for both residential and commercial buyers. Demand-based operation, enabled by high pm2.5 sensor accuracy, is crucial for optimizing indoor environmental quality.

While HEPA dominates, alternative technologies like the electrostatic precipitator are finding use in niche market segmentation, influencing regional supply chain optimization.
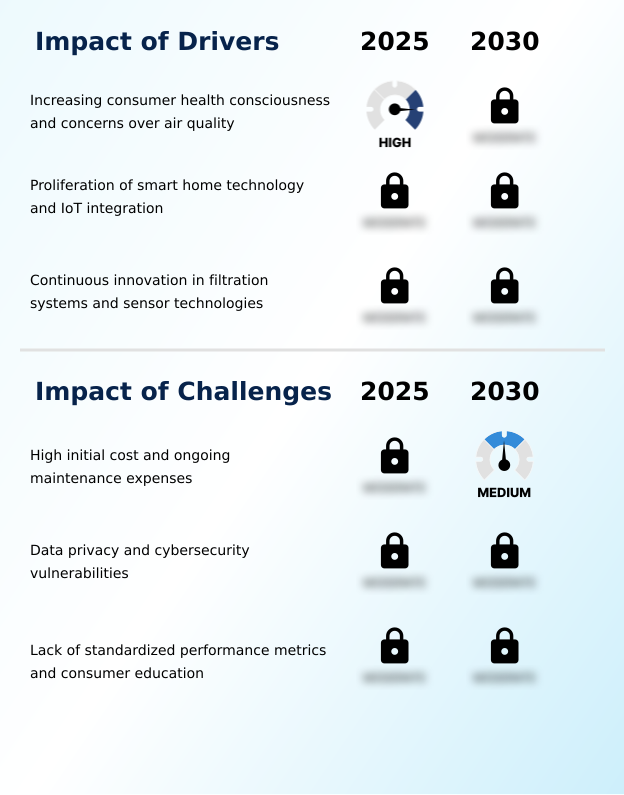
Market Dynamics

Our researchers analyzed the data with 2025 as the base year, along with the key drivers, trends, and challenges. A holistic analysis of drivers will help companies refine their marketing strategies to gain a competitive advantage.

  • Consumers and commercial buyers are increasingly seeking specific information, asking questions like what are the benefits of hepa filtration for allergies and how activated carbon removes volatile organic compounds. This signals a maturing market where performance specifics matter.
  • The role of iot connectivity in home air quality monitoring is now a standard expectation, with users looking for seamless smart home integration for air purification. As a result, the advantages of multi-stage purification systems that combine different technologies are a key marketing focus.
  • However, technical literacy is also rising, leading to scrutiny of performance metrics and queries about comparing clean air delivery rate standards. Buyers are also evaluating energy efficiency of brushless dc motor purifiers and the effectiveness of uv-c germicidal irradiation on viruses.
  • In parallel, concerns are growing around data privacy risks in connected air purifiers, making firmware over-the-air updates a critical security feature. The operational intelligence of these devices is judged by the role of particulate matter sensing in automation and the effectiveness of machine learning for predictive filter life.
  • This detailed evaluation extends to comparing advanced technologies, such as photocatalytic oxidation versus activated carbon, highlighting the market's shift toward evidence-based purchasing decisions where pm2.5 sensor accuracy can improve operational efficiency by reducing unnecessary high-power operation by over 15% in variable conditions.

What are the key market drivers leading to the rise in the adoption of Smart Air Purifier Industry?

  • Increasing consumer health consciousness and growing concerns over the adverse effects of poor air quality are the primary drivers propelling market expansion.

  • The proliferation of smart home technology is a significant driver, with iot connectivity enabling features like remote monitoring and voice activated control. This creates a superior user experience design and facilitates proactive health management.
  • The integration of machine learning algorithms and environmental sensor fusion allows for sophisticated holistic home automation and accurate predictive filter replacement, which in turn supports recurrent revenue models through filter subscriptions.
  • This form of post-purchase monetization is becoming critical for vendors. The market is also seeing increased smart building integration, connecting purifiers to centralized systems.
  • These advanced features are managed through customer engagement platforms, solidifying the device's role in the connected home, and are driving the market at a rate of 11.7%.

What are the market trends shaping the Smart Air Purifier Industry?

  • A significant trend is the convergence of air purification with digital health and wellness ecosystems. This positions devices as integral components within a comprehensive personal health monitoring strategy.

  • A key trend is the convergence of air purification into the broader digital health ecosystem, positioning devices as part of a preventative healthcare strategy. This involves advanced multi-stage purification systems combining standard filters with technologies like uv-c germicidal irradiation for airborne pathogen neutralization. Smart home integration is now a standard expectation, demanding seamless smart home platform compatibility.
  • Concurrently, there is a strong push towards a sustainable product lifecycle, with manufacturers exploring recycled material composition and circular economy principles. Product miniaturization is also enabling new applications like localized air purification and specialized devices, while research into technologies like photocatalytic oxidation promises next-generation performance of up to 10.7%.

What challenges does the Smart Air Purifier Industry face during its growth?

  • The high initial purchase price coupled with ongoing maintenance expenses for filter replacements presents a key challenge restraining broader market adoption.

  • High total cost of ownership, stemming from the replacement of components like proprietary filtration media and activated carbon filter for volatile organic compounds removal, remains a significant challenge. Alongside cost, data privacy and security concerns are paramount. Ensuring connected appliance security through robust data encryption standards and reliable firmware over-the-air updates is critical for consumer trust.
  • The lack of standardized metrics for performance claims, such as air changes per hour, necessitates consumer education initiatives and credible third-party performance certification. This creates complexity for brand differentiation strategy and for integrating devices into a larger building management system, with over 45% of consumers citing confusion as a purchase barrier.

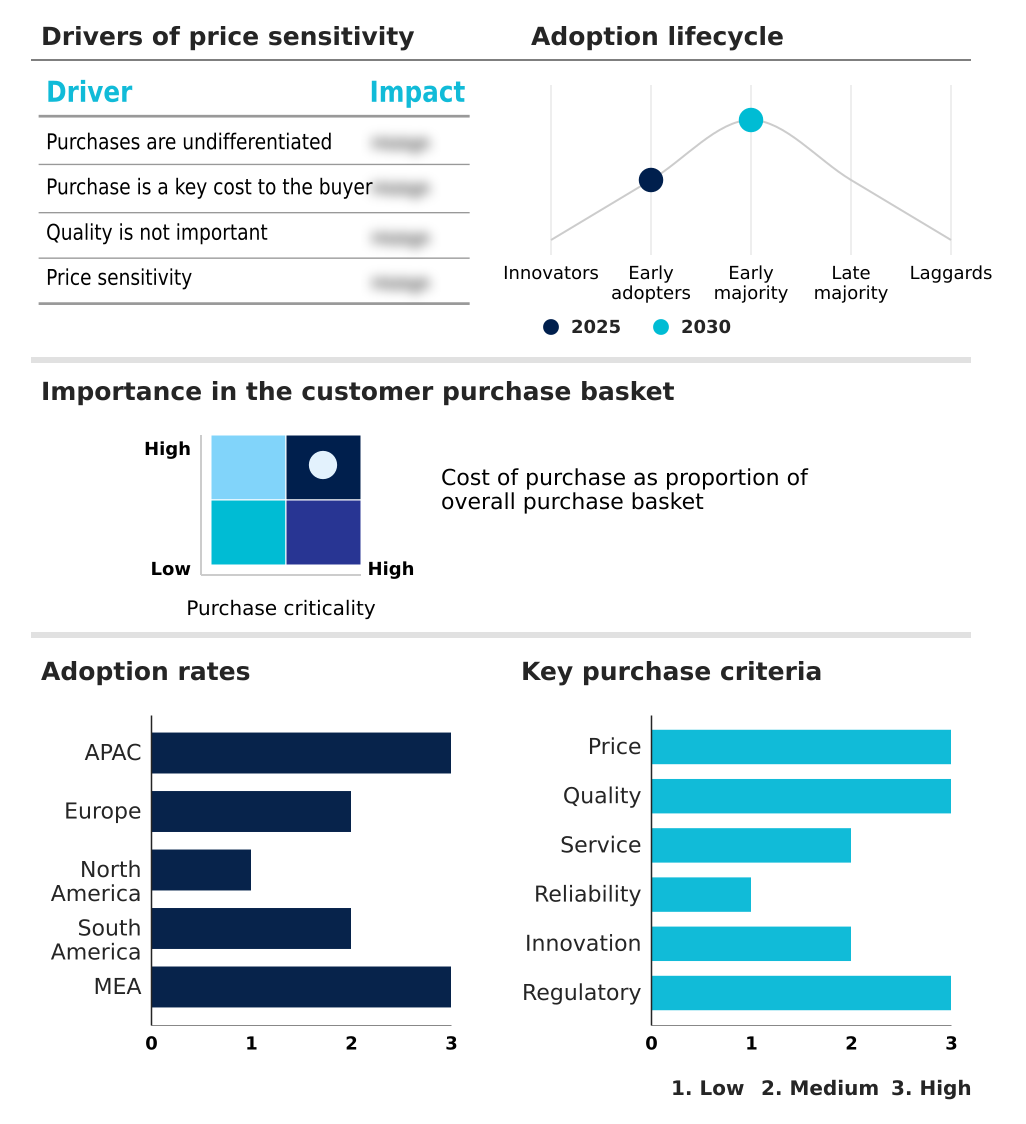
Exclusive Technavio Analysis on Customer Landscape

The smart air purifier market forecasting report includes the adoption lifecycle of the market, covering from the innovator’s stage to the laggard’s stage. It focuses on adoption rates in different regions based on penetration. Furthermore, the smart air purifier market report also includes key purchase criteria and drivers of price sensitivity to help companies evaluate and develop their market growth analysis strategies.

Customer Landscape of Smart Air Purifier Industry

Competitive Landscape

Companies are implementing various strategies, such as strategic alliances, smart air purifier market forecast, partnerships, mergers and acquisitions, geographical expansion, and product/service launches, to enhance their presence in the industry.

AB Electrolux - Offerings are defined by high-performance purification systems featuring advanced filtration technologies, customizable designs, and specialized solutions tailored for a range of residential and commercial environments.

The industry research and growth report includes detailed analyses of the competitive landscape of the market and information about key companies, including:

  • AB Electrolux
  • Alen Corp.
  • Arovast Corp.
  • AustinAir
  • Blueair AB
  • Coway Co. Ltd.
  • Daikin Industries Ltd.
  • Dyson Ltd.
  • Guardian Technologies LLC
  • Honeywell International Inc.
  • IQAir AG
  • Koninklijke Philips NV
  • LG Electronics Inc.
  • Panasonic Holdings Corp.
  • Rabbit Air
  • Samsung Electronics Co. Ltd.
  • Sharp Corp.
  • The Clorox Co.
  • Whirlpool Corp.
  • Xiaomi Corp.

Qualitative and quantitative analysis of companies has been conducted to help clients understand the wider business environment as well as the strengths and weaknesses of key industry players. Data is qualitatively analyzed to categorize companies as pure play, category-focused, industry-focused, and diversified; it is quantitatively analyzed to categorize companies as dominant, leading, strong, tentative, and weak.

Recent Development and News in Smart air purifier market

  • In June 2025, Coway Co. Ltd. launched the Airmega 50, its most compact cylindrical purifier, specifically designed to address the needs of consumers in smaller living spaces without compromising performance.
  • In May 2025, Alen Corp. received the Asthma and Allergy Friendly Certification for its BreatheSmart 45i, 75i, and 35i air purifiers from the Asthma and Allergy Foundation of America, providing a key third-party endorsement of their efficacy in removing airborne allergens.
  • In April 2025, IQAir launched a new series of AI-enabled air purification systems designed for high-density commercial spaces like airports and hotels, featuring predictive filter replacement and real-time air quality feedback.
  • In January 2025, Levoit, a brand of Arovast Corp., introduced the Sprout Air Purifier at the Consumer Electronics Show, a device designed for families with features like a customizable night light and white noise options.

Dive into Technavio’s robust research methodology, blending expert interviews, extensive data synthesis, and validated models for unparalleled Smart Air Purifier Market insights. See full methodology.

Market Scope
Page number 298
Base year 2025
Historic period 2020-2024
Forecast period 2026-2030
Growth momentum & CAGR Accelerate at a CAGR of 11.7%
Market growth 2026-2030 USD 6360.5 million
Market structure Fragmented
YoY growth 2025-2026(%) 10.7%
Key countries China, Japan, India, South Korea, Australia, Indonesia, Germany, UK, France, Italy, Spain, The Netherlands, US, Canada, Mexico, Brazil, Argentina, Chile, Saudi Arabia, UAE, South Africa, Turkey and Israel
Competitive landscape Leading Companies, Market Positioning of Companies, Competitive Strategies, and Industry Risks

Request Free Sample

Research Analyst Overview

  • The smart air purifier market is defined by intense technological competition, where core functionalities like hepa filtration and activated carbon filter technology are enhanced by iot connectivity. Effective removal of volatile organic compounds and high allergen removal efficiency are table stakes. The real differentiation lies in smart features enabled by precise particulate matter sensing and environmental sensor fusion.
  • These features facilitate automated fan speed adjustments and demand-based operation, optimizing the air changes per hour for better indoor environmental quality. Innovations such as the brushless dc motor improve energy efficiency rating and enable low noise operation.
  • For boardroom decisions, the focus is on lifecycle management, where features like predictive filter replacement based on machine learning algorithms can reduce maintenance overhead in commercial deployments by over 30%. This, combined with remote monitoring and firmware over-the-air updates, is critical for both residential smart home integration and large-scale building management system deployments.
  • Advanced systems are even incorporating uv-c germicidal irradiation and exploring photocatalytic oxidation for superior airborne pathogen neutralization.

What are the Key Data Covered in this Smart Air Purifier Market Research and Growth Report?

  • What is the expected growth of the Smart Air Purifier Market between 2026 and 2030?

    • USD 6.36 billion, at a CAGR of 11.7%

  • What segmentation does the market report cover?

    • The report is segmented by Product (Dust collectors, and Fume and smoke collectors), Technology (HEPA, Activated carbon, and Others), End-user (Residential, and Commercial) and Geography (APAC, Europe, North America, South America, Middle East and Africa)

  • Which regions are analyzed in the report?

    • APAC, Europe, North America, South America and Middle East and Africa

  • What are the key growth drivers and market challenges?

    • Increasing consumer health consciousness and concerns over air quality, High initial cost and ongoing maintenance expenses

  • Who are the major players in the Smart Air Purifier Market?

    • AB Electrolux, Alen Corp., Arovast Corp., AustinAir, Blueair AB, Coway Co. Ltd., Daikin Industries Ltd., Dyson Ltd., Guardian Technologies LLC, Honeywell International Inc., IQAir AG, Koninklijke Philips NV, LG Electronics Inc., Panasonic Holdings Corp., Rabbit Air, Samsung Electronics Co. Ltd., Sharp Corp., The Clorox Co., Whirlpool Corp. and Xiaomi Corp.

Market Research Insights

  • Market dynamics are increasingly shaped by the integration of devices into digital health ecosystem platforms, transforming them from standalone appliances into tools for proactive health management. This shift elevates the importance of user experience design and seamless smart home platform compatibility.
  • The focus on sustainable product lifecycle has led to innovations that improve energy efficiency by over 25% in newer models. Furthermore, the ability to provide data-driven health insights has become a key element of brand differentiation strategy.
  • For commercial applications, smart building integration allows for centralized regulatory compliance management, with advanced systems reducing energy consumption during off-peak hours by up to 40% compared to non-integrated units.

We can help! Our analysts can customize this smart air purifier market research report to meet your requirements.

Get in touch

1. Executive Summary

1.1 Market overview

Executive Summary - Chart on Market Overview
Executive Summary - Data Table on Market Overview
Executive Summary - Chart on Global Market Characteristics
Executive Summary - Chart on Market by Geography
Executive Summary - Chart on Market Segmentation by Product
Executive Summary - Chart on Market Segmentation by Technology
Executive Summary - Chart on Market Segmentation by End-user
Executive Summary - Chart on Incremental Growth
Executive Summary - Data Table on Incremental Growth
Executive Summary - Chart on Company Market Positioning

2. Technavio Analysis

2.1 Analysis of price sensitivity, lifecycle, customer purchase basket, adoption rates, and purchase criteria

2.2 Criticality of inputs and Factors of differentiation

Chart on Overview on criticality of inputs and factors of differentiation

2.3 Factors of disruption

Chart on Overview on factors of disruption

2.4 Impact of drivers and challenges

Chart on Impact of drivers and challenges in 2025 and 2030

3. Market Landscape

3.1 Market ecosystem

Chart on Parent Market
Data Table on - Parent Market

3.2 Market characteristics

Chart on Market characteristics analysis

3.3 Value chain analysis

Chart on Value chain analysis

4. Market Sizing

4.1 Market definition

Data Table on Offerings of companies included in the market definition

4.2 Market segment analysis

Market segments

4.3 Market size 2025

4.4 Market outlook: Forecast for 2025-2030

Chart on Global - Market size and forecast 2025-2030 ($ million)
Data Table on Global - Market size and forecast 2025-2030 ($ million)
Chart on Global Market: Year-over-year growth 2025-2030 (%)
Data Table on Global Market: Year-over-year growth 2025-2030 (%)

5. Historic Market Size

5.1 Global Smart Air Purifier Market 2020 - 2024

Historic Market Size - Data Table on Global Smart Air Purifier Market 2020 - 2024 ($ million)

5.2 Product segment analysis 2020 - 2024

Historic Market Size - Product Segment 2020 - 2024 ($ million)

5.3 Technology segment analysis 2020 - 2024

Historic Market Size - Technology Segment 2020 - 2024 ($ million)

5.4 End-user segment analysis 2020 - 2024

Historic Market Size - End-user Segment 2020 - 2024 ($ million)

5.5 Geography segment analysis 2020 - 2024

Historic Market Size - Geography Segment 2020 - 2024 ($ million)

5.6 Country segment analysis 2020 - 2024

Historic Market Size - Country Segment 2020 - 2024 ($ million)

6. Qualitative Analysis

6.1 Impact of AI on global smart air purifier market

6.2 Impact of geopolitical conflicts on global smart air purifier market

7. Five Forces Analysis

7.1 Five forces summary

Five forces analysis - Comparison between 2025 and 2030

7.2 Bargaining power of buyers

Bargaining power of buyers - Impact of key factors 2025 and 2030

7.3 Bargaining power of suppliers

Bargaining power of suppliers - Impact of key factors in 2025 and 2030

7.4 Threat of new entrants

Threat of new entrants - Impact of key factors in 2025 and 2030

7.5 Threat of substitutes

Threat of substitutes - Impact of key factors in 2025 and 2030

7.6 Threat of rivalry

Threat of rivalry - Impact of key factors in 2025 and 2030

7.7 Market condition

Chart on Market condition - Five forces 2025 and 2030

8. Market Segmentation by Product

8.1 Market segments

Chart on Product - Market share 2025-2030 (%)
Data Table on Product - Market share 2025-2030 (%)

8.2 Comparison by Product

Chart on Comparison by Product
Data Table on Comparison by Product

8.3 Dust collectors - Market size and forecast 2025-2030

Chart on Dust collectors - Market size and forecast 2025-2030 ($ million)
Data Table on Dust collectors - Market size and forecast 2025-2030 ($ million)
Chart on Dust collectors - Year-over-year growth 2025-2030 (%)
Data Table on Dust collectors - Year-over-year growth 2025-2030 (%)

8.4 Fume and smoke collectors - Market size and forecast 2025-2030

Chart on Fume and smoke collectors - Market size and forecast 2025-2030 ($ million)
Data Table on Fume and smoke collectors - Market size and forecast 2025-2030 ($ million)
Chart on Fume and smoke collectors - Year-over-year growth 2025-2030 (%)
Data Table on Fume and smoke collectors - Year-over-year growth 2025-2030 (%)

8.5 Market opportunity by Product

Market opportunity by Product ($ million)
Data Table on Market opportunity by Product ($ million)

9. Market Segmentation by Technology

9.1 Market segments

Chart on Technology - Market share 2025-2030 (%)
Data Table on Technology - Market share 2025-2030 (%)

9.2 Comparison by Technology

Chart on Comparison by Technology
Data Table on Comparison by Technology

9.3 HEPA - Market size and forecast 2025-2030

Chart on HEPA - Market size and forecast 2025-2030 ($ million)
Data Table on HEPA - Market size and forecast 2025-2030 ($ million)
Chart on HEPA - Year-over-year growth 2025-2030 (%)
Data Table on HEPA - Year-over-year growth 2025-2030 (%)

9.4 Activated carbon - Market size and forecast 2025-2030

Chart on Activated carbon - Market size and forecast 2025-2030 ($ million)
Data Table on Activated carbon - Market size and forecast 2025-2030 ($ million)
Chart on Activated carbon - Year-over-year growth 2025-2030 (%)
Data Table on Activated carbon - Year-over-year growth 2025-2030 (%)

9.5 Others - Market size and forecast 2025-2030

Chart on Others - Market size and forecast 2025-2030 ($ million)
Data Table on Others - Market size and forecast 2025-2030 ($ million)
Chart on Others - Year-over-year growth 2025-2030 (%)
Data Table on Others - Year-over-year growth 2025-2030 (%)

9.6 Market opportunity by Technology

Market opportunity by Technology ($ million)
Data Table on Market opportunity by Technology ($ million)

10. Market Segmentation by End-user

10.1 Market segments

Chart on End-user - Market share 2025-2030 (%)
Data Table on End-user - Market share 2025-2030 (%)

10.2 Comparison by End-user

Chart on Comparison by End-user
Data Table on Comparison by End-user

10.3 Residential - Market size and forecast 2025-2030

Chart on Residential - Market size and forecast 2025-2030 ($ million)
Data Table on Residential - Market size and forecast 2025-2030 ($ million)
Chart on Residential - Year-over-year growth 2025-2030 (%)
Data Table on Residential - Year-over-year growth 2025-2030 (%)

10.4 Commercial - Market size and forecast 2025-2030

Chart on Commercial - Market size and forecast 2025-2030 ($ million)
Data Table on Commercial - Market size and forecast 2025-2030 ($ million)
Chart on Commercial - Year-over-year growth 2025-2030 (%)
Data Table on Commercial - Year-over-year growth 2025-2030 (%)

10.5 Market opportunity by End-user

Market opportunity by End-user ($ million)
Data Table on Market opportunity by End-user ($ million)

11. Customer Landscape

11.1 Customer landscape overview

Analysis of price sensitivity, lifecycle, customer purchase basket, adoption rates, and purchase criteria

12. Geographic Landscape

12.1 Geographic segmentation

Chart on Market share by geography 2025-2030 (%)
Data Table on Market share by geography 2025-2030 (%)

12.2 Geographic comparison

Chart on Geographic comparison
Data Table on Geographic comparison

12.3 APAC - Market size and forecast 2025-2030

Chart on APAC - Market size and forecast 2025-2030 ($ million)
Data Table on APAC - Market size and forecast 2025-2030 ($ million)
Chart on APAC - Year-over-year growth 2025-2030 (%)
Data Table on APAC - Year-over-year growth 2025-2030 (%)
Chart on Regional Comparison - APAC
Data Table on Regional Comparison - APAC

12.3.1 China - Market size and forecast 2025-2030

Chart on China - Market size and forecast 2025-2030 ($ million)
Data Table on China - Market size and forecast 2025-2030 ($ million)
Chart on China - Year-over-year growth 2025-2030 (%)
Data Table on China - Year-over-year growth 2025-2030 (%)

12.3.2 Japan - Market size and forecast 2025-2030

Chart on Japan - Market size and forecast 2025-2030 ($ million)
Data Table on Japan - Market size and forecast 2025-2030 ($ million)
Chart on Japan - Year-over-year growth 2025-2030 (%)
Data Table on Japan - Year-over-year growth 2025-2030 (%)

12.3.3 India - Market size and forecast 2025-2030

Chart on India - Market size and forecast 2025-2030 ($ million)
Data Table on India - Market size and forecast 2025-2030 ($ million)
Chart on India - Year-over-year growth 2025-2030 (%)
Data Table on India - Year-over-year growth 2025-2030 (%)

12.3.4 South Korea - Market size and forecast 2025-2030

Chart on South Korea - Market size and forecast 2025-2030 ($ million)
Data Table on South Korea - Market size and forecast 2025-2030 ($ million)
Chart on South Korea - Year-over-year growth 2025-2030 (%)
Data Table on South Korea - Year-over-year growth 2025-2030 (%)

12.3.5 Australia - Market size and forecast 2025-2030

Chart on Australia - Market size and forecast 2025-2030 ($ million)
Data Table on Australia - Market size and forecast 2025-2030 ($ million)
Chart on Australia - Year-over-year growth 2025-2030 (%)
Data Table on Australia - Year-over-year growth 2025-2030 (%)

12.3.6 Indonesia - Market size and forecast 2025-2030

Chart on Indonesia - Market size and forecast 2025-2030 ($ million)
Data Table on Indonesia - Market size and forecast 2025-2030 ($ million)
Chart on Indonesia - Year-over-year growth 2025-2030 (%)
Data Table on Indonesia - Year-over-year growth 2025-2030 (%)

12.4 Europe - Market size and forecast 2025-2030

Chart on Europe - Market size and forecast 2025-2030 ($ million)
Data Table on Europe - Market size and forecast 2025-2030 ($ million)
Chart on Europe - Year-over-year growth 2025-2030 (%)
Data Table on Europe - Year-over-year growth 2025-2030 (%)
Chart on Regional Comparison - Europe
Data Table on Regional Comparison - Europe

12.4.1 Germany - Market size and forecast 2025-2030

Chart on Germany - Market size and forecast 2025-2030 ($ million)
Data Table on Germany - Market size and forecast 2025-2030 ($ million)
Chart on Germany - Year-over-year growth 2025-2030 (%)
Data Table on Germany - Year-over-year growth 2025-2030 (%)

12.4.2 UK - Market size and forecast 2025-2030

Chart on UK - Market size and forecast 2025-2030 ($ million)
Data Table on UK - Market size and forecast 2025-2030 ($ million)
Chart on UK - Year-over-year growth 2025-2030 (%)
Data Table on UK - Year-over-year growth 2025-2030 (%)

12.4.3 France - Market size and forecast 2025-2030

Chart on France - Market size and forecast 2025-2030 ($ million)
Data Table on France - Market size and forecast 2025-2030 ($ million)
Chart on France - Year-over-year growth 2025-2030 (%)
Data Table on France - Year-over-year growth 2025-2030 (%)

12.4.4 Italy - Market size and forecast 2025-2030

Chart on Italy - Market size and forecast 2025-2030 ($ million)
Data Table on Italy - Market size and forecast 2025-2030 ($ million)
Chart on Italy - Year-over-year growth 2025-2030 (%)
Data Table on Italy - Year-over-year growth 2025-2030 (%)

12.4.5 Spain - Market size and forecast 2025-2030

Chart on Spain - Market size and forecast 2025-2030 ($ million)
Data Table on Spain - Market size and forecast 2025-2030 ($ million)
Chart on Spain - Year-over-year growth 2025-2030 (%)
Data Table on Spain - Year-over-year growth 2025-2030 (%)

12.4.6 The Netherlands - Market size and forecast 2025-2030

Chart on The Netherlands - Market size and forecast 2025-2030 ($ million)
Data Table on The Netherlands - Market size and forecast 2025-2030 ($ million)
Chart on The Netherlands - Year-over-year growth 2025-2030 (%)
Data Table on The Netherlands - Year-over-year growth 2025-2030 (%)

12.5 North America - Market size and forecast 2025-2030

Chart on North America - Market size and forecast 2025-2030 ($ million)
Data Table on North America - Market size and forecast 2025-2030 ($ million)
Chart on North America - Year-over-year growth 2025-2030 (%)
Data Table on North America - Year-over-year growth 2025-2030 (%)
Chart on Regional Comparison - North America
Data Table on Regional Comparison - North America

12.5.1 US - Market size and forecast 2025-2030

Chart on US - Market size and forecast 2025-2030 ($ million)
Data Table on US - Market size and forecast 2025-2030 ($ million)
Chart on US - Year-over-year growth 2025-2030 (%)
Data Table on US - Year-over-year growth 2025-2030 (%)

12.5.2 Canada - Market size and forecast 2025-2030

Chart on Canada - Market size and forecast 2025-2030 ($ million)
Data Table on Canada - Market size and forecast 2025-2030 ($ million)
Chart on Canada - Year-over-year growth 2025-2030 (%)
Data Table on Canada - Year-over-year growth 2025-2030 (%)

12.5.3 Mexico - Market size and forecast 2025-2030

Chart on Mexico - Market size and forecast 2025-2030 ($ million)
Data Table on Mexico - Market size and forecast 2025-2030 ($ million)
Chart on Mexico - Year-over-year growth 2025-2030 (%)
Data Table on Mexico - Year-over-year growth 2025-2030 (%)

12.6 South America - Market size and forecast 2025-2030

Chart on South America - Market size and forecast 2025-2030 ($ million)
Data Table on South America - Market size and forecast 2025-2030 ($ million)
Chart on South America - Year-over-year growth 2025-2030 (%)
Data Table on South America - Year-over-year growth 2025-2030 (%)
Chart on Regional Comparison - South America
Data Table on Regional Comparison - South America

12.6.1 Brazil - Market size and forecast 2025-2030

Chart on Brazil - Market size and forecast 2025-2030 ($ million)
Data Table on Brazil - Market size and forecast 2025-2030 ($ million)
Chart on Brazil - Year-over-year growth 2025-2030 (%)
Data Table on Brazil - Year-over-year growth 2025-2030 (%)

12.6.2 Argentina - Market size and forecast 2025-2030

Chart on Argentina - Market size and forecast 2025-2030 ($ million)
Data Table on Argentina - Market size and forecast 2025-2030 ($ million)
Chart on Argentina - Year-over-year growth 2025-2030 (%)
Data Table on Argentina - Year-over-year growth 2025-2030 (%)

12.6.3 Chile - Market size and forecast 2025-2030

Chart on Chile - Market size and forecast 2025-2030 ($ million)
Data Table on Chile - Market size and forecast 2025-2030 ($ million)
Chart on Chile - Year-over-year growth 2025-2030 (%)
Data Table on Chile - Year-over-year growth 2025-2030 (%)

12.7 Middle East and Africa - Market size and forecast 2025-2030

Chart on Middle East and Africa - Market size and forecast 2025-2030 ($ million)
Data Table on Middle East and Africa - Market size and forecast 2025-2030 ($ million)
Chart on Middle East and Africa - Year-over-year growth 2025-2030 (%)
Data Table on Middle East and Africa - Year-over-year growth 2025-2030 (%)
Chart on Regional Comparison - Middle East and Africa
Data Table on Regional Comparison - Middle East and Africa

12.7.1 Saudi Arabia - Market size and forecast 2025-2030

Chart on Saudi Arabia - Market size and forecast 2025-2030 ($ million)
Data Table on Saudi Arabia - Market size and forecast 2025-2030 ($ million)
Chart on Saudi Arabia - Year-over-year growth 2025-2030 (%)
Data Table on Saudi Arabia - Year-over-year growth 2025-2030 (%)

12.7.2 UAE - Market size and forecast 2025-2030

Chart on UAE - Market size and forecast 2025-2030 ($ million)
Data Table on UAE - Market size and forecast 2025-2030 ($ million)
Chart on UAE - Year-over-year growth 2025-2030 (%)
Data Table on UAE - Year-over-year growth 2025-2030 (%)

12.7.3 South Africa - Market size and forecast 2025-2030

Chart on South Africa - Market size and forecast 2025-2030 ($ million)
Data Table on South Africa - Market size and forecast 2025-2030 ($ million)
Chart on South Africa - Year-over-year growth 2025-2030 (%)
Data Table on South Africa - Year-over-year growth 2025-2030 (%)

12.7.4 Turkey - Market size and forecast 2025-2030

Chart on Turkey - Market size and forecast 2025-2030 ($ million)
Data Table on Turkey - Market size and forecast 2025-2030 ($ million)
Chart on Turkey - Year-over-year growth 2025-2030 (%)
Data Table on Turkey - Year-over-year growth 2025-2030 (%)

12.7.5 Israel - Market size and forecast 2025-2030

Chart on Israel - Market size and forecast 2025-2030 ($ million)
Data Table on Israel - Market size and forecast 2025-2030 ($ million)
Chart on Israel - Year-over-year growth 2025-2030 (%)
Data Table on Israel - Year-over-year growth 2025-2030 (%)

12.8 Market opportunity by geography

Market opportunity by geography ($ million)
Data Tables on Market opportunity by geography ($ million)

13. Drivers, Challenges, and Opportunity

13.1 Market drivers

Increasing consumer health consciousness and concerns over air quality
Proliferation of smart home technology and IoT integration
Continuous innovation in filtration systems and sensor technologies

13.2 Market challenges

High initial cost and ongoing maintenance expenses
Data privacy and cybersecurity vulnerabilities
Lack of standardized performance metrics and consumer education

13.3 Impact of drivers and challenges

Impact of drivers and challenges in 2025 and 2030

13.4 Market opportunities

Convergence of air purification with digital health and wellness ecosystems
Emphasis on energy efficiency and sustainable product lifecycles
Product miniaturization and diversification for specialized environments

14. Competitive Landscape

14.1 Overview

14.2

Overview on criticality of inputs and factors of differentiation

14.3 Landscape disruption

Overview on factors of disruption

14.4 Industry risks

Impact of key risks on business

15. Competitive Analysis

15.1 Companies profiled

Companies covered

15.2 Company ranking index

15.3 Market positioning of companies

Matrix on companies position and classification

15.4 AB Electrolux

AB Electrolux - Overview
AB Electrolux - Business segments
AB Electrolux - Key offerings
AB Electrolux - Segment focus
SWOT

15.5 Arovast Corp.

Arovast Corp. - Overview
Arovast Corp. - Product / Service
Arovast Corp. - Key offerings
SWOT

15.6 Coway Co. Ltd.

Coway Co. Ltd. - Overview
Coway Co. Ltd. - Product / Service
Coway Co. Ltd. - Key offerings
SWOT

15.7 Daikin Industries Ltd.

Daikin Industries Ltd. - Overview
Daikin Industries Ltd. - Business segments
Daikin Industries Ltd. - Key offerings
Daikin Industries Ltd. - Segment focus
SWOT

15.8 Dyson Ltd.

Dyson Ltd. - Overview
Dyson Ltd. - Product / Service
Dyson Ltd. - Key offerings
SWOT

15.9 Honeywell International Inc.

Honeywell International Inc. - Overview
Honeywell International Inc. - Business segments
Honeywell International Inc. - Key news
Honeywell International Inc. - Key offerings
Honeywell International Inc. - Segment focus
SWOT

15.10 Koninklijke Philips NV

Koninklijke Philips NV - Overview
Koninklijke Philips NV - Business segments
Koninklijke Philips NV - Key news
Koninklijke Philips NV - Key offerings
Koninklijke Philips NV - Segment focus
SWOT

15.11 LG Electronics Inc.

LG Electronics Inc. - Overview
LG Electronics Inc. - Business segments
LG Electronics Inc. - Key offerings
LG Electronics Inc. - Segment focus
SWOT

15.12 Panasonic Holdings Corp.

Panasonic Holdings Corp. - Overview
Panasonic Holdings Corp. - Business segments
Panasonic Holdings Corp. - Key news
Panasonic Holdings Corp. - Key offerings
Panasonic Holdings Corp. - Segment focus
SWOT

15.13 Rabbit Air

Rabbit Air - Overview
Rabbit Air - Product / Service
Rabbit Air - Key offerings
SWOT

15.14 Samsung Electronics Co. Ltd.

Samsung Electronics Co. Ltd. - Overview
Samsung Electronics Co. Ltd. - Business segments
Samsung Electronics Co. Ltd. - Key news
Samsung Electronics Co. Ltd. - Key offerings
Samsung Electronics Co. Ltd. - Segment focus
SWOT

15.15 Sharp Corp.

Sharp Corp. - Overview
Sharp Corp. - Business segments
Sharp Corp. - Key offerings
Sharp Corp. - Segment focus
SWOT

15.16 The Clorox Co.

The Clorox Co. - Overview
The Clorox Co. - Product / Service
The Clorox Co. - Key offerings
SWOT

15.17 Whirlpool Corp.

Whirlpool Corp. - Overview
Whirlpool Corp. - Business segments
Whirlpool Corp. - Key offerings
Whirlpool Corp. - Segment focus
SWOT

15.18 Xiaomi Corp.

Xiaomi Corp. - Overview
Xiaomi Corp. - Business segments
Xiaomi Corp. - Key offerings
Xiaomi Corp. - Segment focus
SWOT

16. Appendix

16.1 Scope of the report

Market definition
Objectives
Notes and caveats

16.2 Inclusions and exclusions checklist

Inclusions checklist
Exclusions checklist

16.3 Currency conversion rates for US$

16.4 Research methodology

16.5 Data procurement

Information sources

16.6 Data validation

16.7 Validation techniques employed for market sizing

16.8 Data synthesis

16.9 360 degree market analysis

16.10 List of abbreviations

Research Methodology

Technavio presents a detailed picture of the market by way of study, synthesis, and summation of data from multiple sources. The analysts have presented the various facets of the market with a particular focus on identifying the key industry influencers. The data thus presented is comprehensive, reliable, and the result of extensive research, both primary and secondary.

INFORMATION SOURCES

Primary sources

  • Manufacturers and suppliers
  • Channel partners
  • Industry experts
  • Strategic decision makers

Secondary sources

  • Industry journals and periodicals
  • Government data
  • Financial reports of key industry players
  • Historical data
  • Press releases

DATA ANALYSIS

Data Synthesis

  • Collation of data
  • Estimation of key figures
  • Analysis of derived insights

Data Validation

  • Triangulation with data models
  • Reference against proprietary databases
  • Corroboration with industry experts

REPORT WRITING

Qualitative

  • Market drivers
  • Market challenges
  • Market trends
  • Five forces analysis

Quantitative

  • Market size and forecast
  • Market segmentation
  • Geographical insights
  • Competitive landscape

Interested in this report?

Get your sample now to see our research methodology and insights!

Download Now

Frequently Asked Questions

Smart Air Purifier market growth will increase by USD 6360.5 million during 2026-2030.

The Smart Air Purifier market is expected to grow at a CAGR of 11.7% during 2026-2030.

Smart Air Purifier market is segmented by Product (Dust collectors, Fume and smoke collectors) Technology (HEPA, Activated carbon, Others) End-user (Residential, Commercial)

AB Electrolux, Alen Corp., Arovast Corp., AustinAir, Blueair AB, Coway Co. Ltd., Daikin Industries Ltd., Dyson Ltd., Guardian Technologies LLC, Honeywell International Inc., IQAir AG, Koninklijke Philips NV, LG Electronics Inc., Panasonic Holdings Corp., Rabbit Air, Samsung Electronics Co. Ltd., Sharp Corp., The Clorox Co., Whirlpool Corp., Xiaomi Corp. are a few of the key vendors in the Smart Air Purifier market.

APAC will register the highest growth rate of 45.6% among the other regions. Therefore, the Smart Air Purifier market in APAC is expected to garner significant business opportunities for the vendors during the forecast period.

China, Japan, India, South Korea, Australia, Indonesia, Germany, UK, France, Italy, Spain, The Netherlands, US, Canada, Mexico, Brazil, Argentina, Chile, Saudi Arabia, UAE, South Africa, Turkey, Israel

  • Increasing consumer health consciousness and concerns over air quality is the driving factor this market.

The Smart Air Purifier market vendors should focus on grabbing business opportunities from the Product segment as it accounted for the largest market share in the base year.
RIA - Research AI Assistant
Ask RIA