
Airline Route Profitability Software Market Size 2024-2028
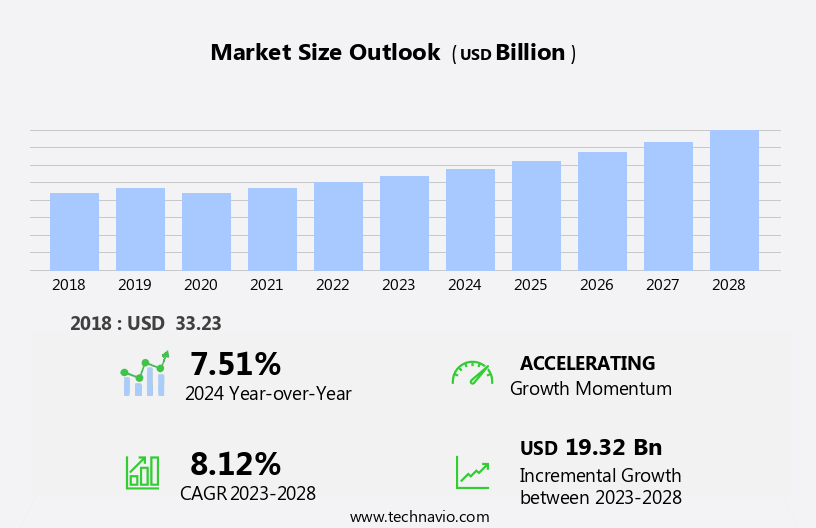
The airline route profitability software market size is forecast to increase by USD 19.32 billion at a CAGR of 8.12% between 2023 and 2028.
- The market is experiencing significant growth due to the increasing requirement for advanced software solutions by airlines. Governments In the Asia-Pacific region are making substantial investments and implementing schemes to revive commercial airlines, which is contributing to market expansion.
- However, the market is facing challenges such as the decline in air passenger traffic and flight cancellations, which are negatively impacting revenue growth for LCCs. To mitigate these challenges, airlines are turning to route profitability software to optimize their operations, improve efficiency, and enhance passenger experience. The software enables airlines to analyze data, identify profitable routes, and make informed decisions on pricing and capacity.
- This, in turn, helps airlines to increase revenue and maintain competitiveness in the market. The market is expected to witness steady growth In the coming years as airlines continue to adopt advanced technologies to enhance their operational capabilities and meet the evolving needs of passengers.
What will be the Size of the Airline Route Profitability Software Market During the Forecast Period?
- The market is experiencing significant growth as airlines seek to optimize their operations In the face of evolving industry dynamics. Amidst ongoing aviation disruptions, including passenger traffic fluctuations and trade restrictions, the demand for advanced software suites that enable data-driven research, pricing, and resource allocation has surged.
- These solutions leverage artificial intelligence, augmented reality, virtual reality, mobile technology, conversational commerce, and other innovative technologies to improve route planning, operational efficiency, and cost management. Key market drivers include increasing competition, passenger demand volatility, and operational costs, particularly fuel costs. The domestic airline segment is a major focus, as airlines look to optimize their networks and pricing strategies to maximize profits.
- The market is expected to continue expanding, as airlines increasingly rely on technology to navigate the complexities of commercial aircraft and adapt to shifting market conditions.
How is this Airline Route Profitability Software Industry segmented and which is the largest segment?
The airline route profitability software industry research report provides comprehensive data (region-wise segment analysis), with forecasts and estimates in "USD billion" for the period 2024-2028, as well as historical data from 2018-2022 for the following segments.
- Type
- Planning and scheduling
- Revenue management
- Fares management and pricing
- Others
- Geography
- North America
- US
- Europe
- Germany
- UK
- France
- APAC
- China
- Middle East and Africa
- South America
- North America
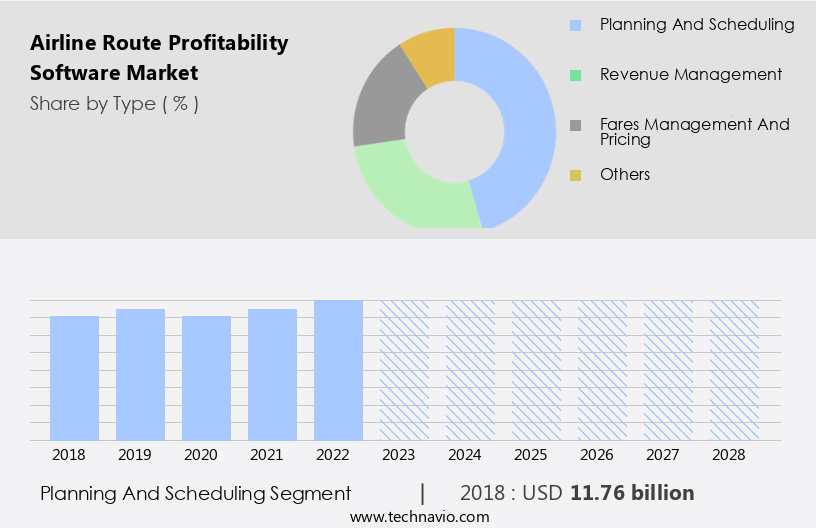
By Type Insights
- The planning and scheduling segment is estimated to witness significant growth during the forecast period.
Airline route profitability software is a crucial tool for aviation companies to optimize their operations and enhance profitability. Amidst lockdowns and reduced passenger traffic, the need for data-driven research and resource allocation has become more critical than ever. Advanced software suites, incorporating AI, augmented reality, virtual reality, mobile technology, conversational commerce, and real-time data, enable airlines to analyze their product mix, distribution channels, and supplier relationships. These solutions provide insights into passenger demand, ticket pricing, operational costs, fuel costs, competition, and regulatory changes. By optimizing route planning, scheduling, and operational efficiency, airlines can identify cost-saving opportunities and make informed decisions.
The software allows for accurate forecasting, scheduling complexities, and adapting to travel restrictions and reduced passenger demand. Global and regional players In the market offer comprehensive data, including passenger data, to help airlines maximize profitability and maintain cost efficiency In their revenue management strategies.
Get a glance at the Airline Route Profitability Software Industry report of share of various segments Request Free Sample
The Planning and scheduling segment was valued at USD 11.76 billion in 2018 and showed a gradual increase during the forecast period.
Regional Analysis
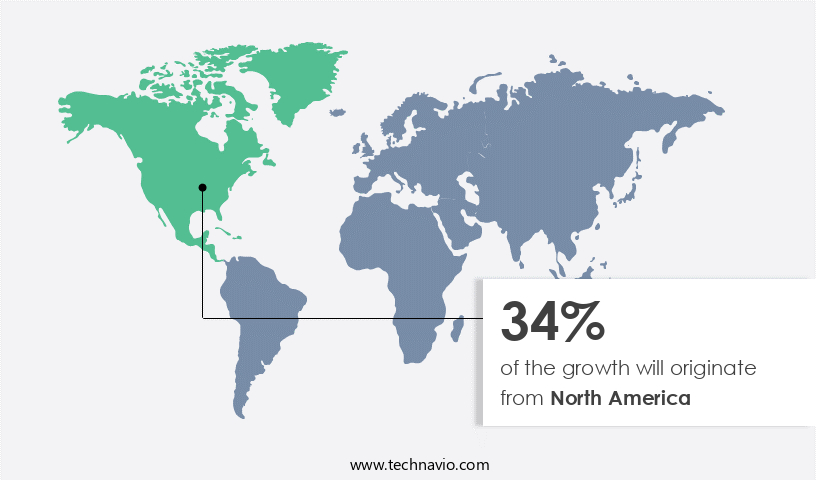
- North America is estimated to contribute 34% to the growth of the global market during the forecast period.
Technavio's analysts have elaborately explained the regional trends and drivers that shape the market during the forecast period.
For more insights on the market share of various regions, Request Free Sample
The market is experiencing significant growth due to the increasing complexity of aircraft operations and the need for data-driven research to optimize costs and improve profitability. The COVID-19 lockdowns and subsequent reduction in passenger traffic and airline operations have emphasized the importance of advanced software solutions for airlines. These software suites enable airlines to analyze passenger demand, ticket pricing, operational costs, fuel costs, competition, and resource allocation for optimal route planning and operational efficiency. They also offer forecasting tools, real-time data, and accurate and comprehensive passenger data to inform decisions on pricing, scheduling, and cost-saving opportunities for air freight services. The North American market is expected to dominate due to the expanding airline routes, increasing air passenger traffic, and the development of new aircraft in countries like the US and Canada.
The region's airlines require advanced software to optimize flight timings, prepare scheduling plans, and manage revenue management strategies. The global market is characterized by the presence of several key players, including North American and European companies, who offer solutions with optimization capabilities, AI, augmented reality, virtual reality, mobile technology, conversational commerce, supplier analysis, and pricing tools. The market is also influenced by regulatory changes, trade restrictions, and raw material costs, which impact the cost structures and cost efficiency of airlines.
Market Dynamics
Our researchers analyzed the data with 2023 as the base year, along with the key drivers, trends, and challenges. A holistic analysis of drivers will help companies refine their marketing strategies to gain a competitive advantage.
What are the key market drivers leading to the rise In the adoption of Airline Route Profitability Software Industry?
Growing need for advanced software suites by airlines is the key driver of the market.
- The airline industry confronts significant challenges from fluctuating passenger traffic and intense competition, leading to substantial losses. Airline route profitability software, an advanced technology solution, assists carriers in evaluating route costs and calculating profitability. This software is gaining traction due to escalating investments In the aviation sector. By utilizing route profitability software, airlines can optimize their budgets and schedules for each route, enhancing profitability and reducing operational costs. Key market drivers include the need for data-driven research to inform decisions on pricing, resource allocation, and route planning. Operational efficiency is a critical factor, as airlines face complexity from factors such as trade restrictions, raw material costs, fuel prices, and regulatory changes.
- Forecasting tools and real-time data are essential to maintaining accurate and comprehensive data on passenger demand, ticket pricing, and operational costs. Global and regional players In the airline industry increasingly rely on route profitability software to navigate the intricacies of the market. The software's optimization capabilities offer cost-saving opportunities, enabling airlines to adapt to travel restrictions, reduced passenger demand, and decreased aircraft operations. By leveraging advanced technologies like AI, augmented reality, virtual reality, mobile technology, and conversational commerce, airlines can streamline their operations and remain competitive.
What are the market trends shaping the Airline Route Profitability Software Industry?
Government investments and schemes that aim to revive airline industry in APAC is the upcoming market trend.
- The market is experiencing significant growth due to the increasing complexity of aircraft operations In the aviation industry. Lockdowns and travel restrictions have led to reduced passenger demand and decreased airline operations, necessitating the need for advanced software suites to optimize costs, improve operational efficiency, and enhance revenue management strategies. These software solutions enable airlines to analyze supplier relationships, optimize product mix and distribution channels, and leverage data-driven research for informed decisions on passenger demand, ticket pricing, operational costs, fuel costs, and competition. Advanced technologies such as AI, augmented reality, virtual reality, mobile technology, conversational commerce, and forecasting tools provide real-time data and accurate information for cost savings and operational optimization.
- Global players and regional players In the market offer comprehensive data on passenger traffic, raw materials, parts, and components to help airlines make informed decisions on scheduling, resource allocation, and route planning. Regulatory changes and forecasting tools are essential for airlines to adapt to the evolving market dynamics and remain competitive.
What challenges does the Airline Route Profitability Software Industry face during its growth?
Decline in air passenger traffic and flight cancellations is a key challenge affecting the industry growth.
- The airline industry faces significant challenges, with lockdowns and travel restrictions leading to decreased passenger demand and reduced airline operations. Consequently, airlines are seeking ways to optimize costs and improve profitability. Airline route profitability software plays a crucial role in this regard. This software helps airlines analyze various factors, such as passenger demand, ticket pricing, operational costs, fuel costs, competition, and distribution channels, to make informed decisions on resource allocation, route planning, and operational efficiency. Advanced software suites incorporating AI, augmented reality, virtual reality, mobile technology, and conversational commerce can offer significant cost-saving opportunities. However, the market growth is currently hindered by the financial impact of the pandemic on airlines, particularly In the domestic and international segments.
- Despite this, the long-term outlook remains positive, with the software's optimization capabilities providing valuable insights into supplier analysis, product mix, and pricing strategies. Accurate data, real-time data, and comprehensive data on passenger traffic, raw materials, and fuel costs are essential for effective cost management and revenue management strategies. Global and regional players In the market continue to invest in developing advanced software suites to help airlines navigate the complex regulatory environment and forecasting tools to manage fuel costs and optimize pricing.
Exclusive Customer Landscape
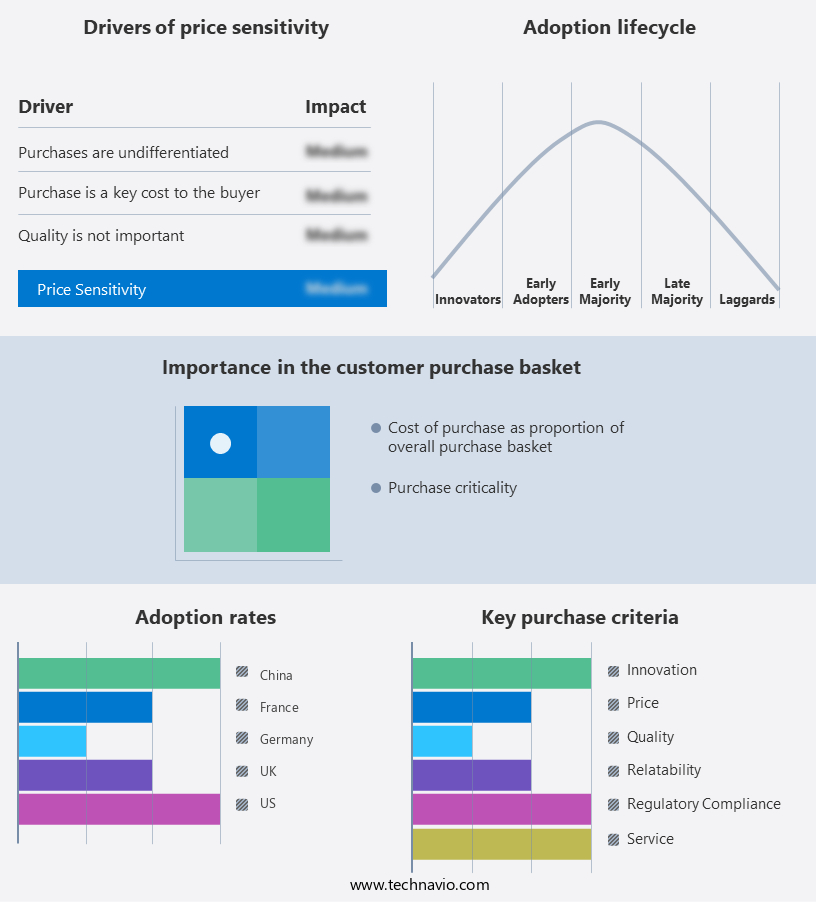
The airline route profitability software market forecasting report includes the adoption lifecycle of the market, covering from the innovator's stage to the laggard's stage. It focuses on adoption rates in different regions based on penetration. Furthermore, the airline route profitability software market report also includes key purchase criteria and drivers of price sensitivity to help companies evaluate and develop their market growth analysis strategies.
Customer Landscape
Key Companies & Market Insights
Companies are implementing various strategies, such as strategic alliances, airline route profitability software market forecast, partnerships, mergers and acquisitions, geographical expansion, and product/service launches, to enhance their presence In the industry.
The industry research and growth report includes detailed analyses of the competitive landscape of the market and information about key companies, including:
- Aerotrack Systems
- Amadeus IT Group SA
- Coforge Ltd.
- GrandTrust Overseas Pvt. Ltd.
- International Business Machines Corp.
- Laminaar Aviation Pte. Ltd.
- Lufthansa Group
- Maureva Ltd.
- Maxamation Pty. Ltd.
- Megabyte Ltd.
- Optym
- Orane Consulting Pvt. Ltd.
- Pros Holdings Inc.
- QlikTech international AB
- Sabre Corp.
- Seabury Solutions
- SITA
- Skymetrix
- The Boeing Co.
- Wipro Ltd.
Qualitative and quantitative analysis of companies has been conducted to help clients understand the wider business environment as well as the strengths and weaknesses of key industry players. Data is qualitatively analyzed to categorize companies as pure play, category-focused, industry-focused, and diversified; it is quantitatively analyzed to categorize companies as dominant, leading, strong, tentative, and weak.
Research Analyst Overview
Airline route profitability has emerged as a critical area of focus for the global aviation industry, as airlines strive to optimize their operations and enhance their competitive edge in an increasingly complex market. The use of advanced software suites has become essential for airlines to effectively manage their route networks, passenger traffic, and operational costs. Airline route profitability software enables carriers to analyze various factors that impact their profitability, including passenger demand, ticket pricing, operational costs, fuel costs, competition, and resource allocation. These software solutions employ data-driven research and optimization capabilities to identify cost-saving opportunities and inform decisions related to scheduling, pricing, and route planning.
The aviation sector faces numerous challenges that impact airline route profitability. Trade restrictions and raw material availability can impact the cost structures of airlines, while regulatory changes and travel restrictions can significantly alter passenger demand and airline operations. In response, airlines require accurate and comprehensive data to adapt to these market dynamics and maintain operational efficiency. Advanced software suites can provide real-time data and forecasting tools to help airlines respond to changing market conditions. For instance, they can analyze historical data to identify trends and patterns, enabling airlines to adjust their pricing strategies and resource allocation accordingly. Additionally, these software solutions can employ AI, augmented reality, virtual reality, mobile technology, conversational commerce, and other advanced technologies to enhance the user experience and streamline operations.
The global airline industry is characterized by the presence of both global and regional players. The domestic airline segment, which accounts for a significant portion of passenger traffic, is subject to unique market dynamics, such as intense competition and varying distribution channels. In the international air segment, airlines face additional challenges, such as varying regulatory environments and complex supplier analysis. Despite the challenges, the use of airline route profitability software offers significant benefits. By providing accurate and real-time data, these software solutions enable airlines to make informed decisions and optimize their operations, leading to increased cost efficiency and profitability.
Additionally, they can help airlines adapt to changing market conditions, such as reduced passenger demand and decreased airline operations, by providing insights into passenger data and operational costs. In conclusion, airline route profitability software is a critical tool for airlines seeking to optimize their operations and enhance their competitive edge In the global aviation industry. These software solutions enable airlines to analyze various factors impacting their profitability, employ data-driven research and optimization capabilities, and adapt to changing market conditions in real-time. By providing accurate and comprehensive data, these software solutions help airlines make informed decisions and maintain operational efficiency, leading to increased cost efficiency and profitability.
|
Market Scope |
|
|
Report Coverage |
Details |
|
Page number |
139 |
|
Base year |
2023 |
|
Historic period |
2018-2022 |
|
Forecast period |
2024-2028 |
|
Growth momentum & CAGR |
Accelerate at a CAGR of 8.12% |
|
Market growth 2024-2028 |
USD 19.32 billion |
|
Market structure |
Fragmented |
|
YoY growth 2023-2024(%) |
7.51 |
|
Key countries |
US, China, UK, France, and Germany |
|
Competitive landscape |
Leading Companies, Market Positioning of Companies, Competitive Strategies, and Industry Risks |
What are the Key Data Covered in this Airline Route Profitability Software Market Research and Growth Report?
- CAGR of the Airline Route Profitability Software industry during the forecast period
- Detailed information on factors that will drive the growth and forecasting between 2024 and 2028
- Precise estimation of the size of the market and its contribution of the industry in focus to the parent market
- Accurate predictions about upcoming growth and trends and changes in consumer behaviour
- Growth of the market across North America, Europe, APAC, Middle East and Africa, and South America
- Thorough analysis of the market's competitive landscape and detailed information about companies
- Comprehensive analysis of factors that will challenge the airline route profitability software market growth of industry companies
We can help! Our analysts can customize this airline route profitability software market research report to meet your requirements.
 RIA -
RIA - 
