Amplifier And Comparator Market Analysis APAC, North America, Europe, South America, Middle East and Africa - China, US, Germany, Japan, South Korea - Size and Forecast 2024-2028

Amplifier And Comparator Market Analysis APAC, North America, Europe, South America, Middle East and Africa - China, US, Germany, Japan, South Korea - Size and Forecast 2024-2028

Published: Jul 2024 165 Pages SKU: IRTNTR73327

Market Overview at a Glance

$1.02 B
Market Opportunity
4.5%
CAGR
4.23
YoY growth 2023-2024(%)

Amplifier And Comparator Market Size 2024-2028

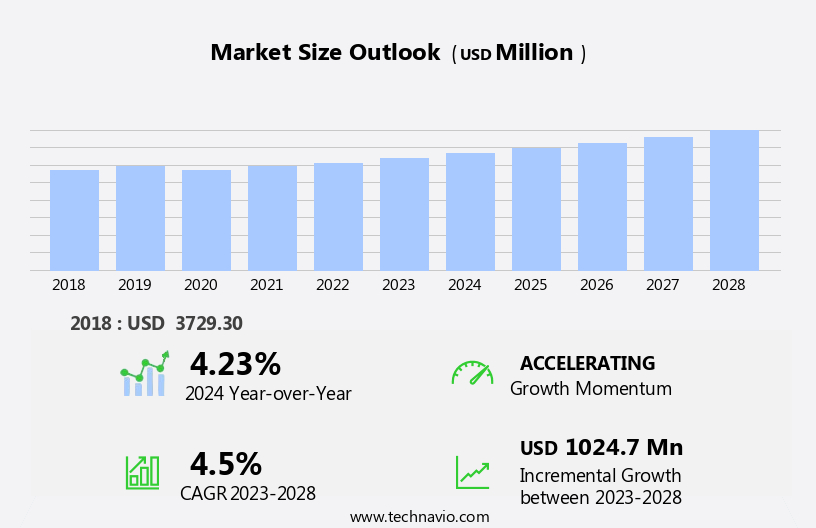
The amplifier and comparator market size is forecast to increase by USD 1.02 billion at a CAGR of 4.5% between 2023 and 2028.

  • The market is experiencing significant growth due to several key trends. The proliferation of next-generation LTE wireless networks is driving market demand, as these networks require advanced amplifiers and comparators to ensure optimal signal strength and accuracy. Additionally, Internet of Things (IoT) is leading to an increase in applications for these components, particularly in sectors such as healthcare, automotive, and industrial automation
  • However, the market is also facing challenges, including the growing design complexity of electronic devices, which necessitates the use of more advanced and sophisticated amplifiers and comparators. Overall, these trends and challenges are shaping the future of the market, making it an exciting and dynamic space for innovation and growth.

What will be the Size of the Amplifier And Comparator Market During the Forecast Period?

Amplifier And Comparator Market Size

 Request Free Sample

  • The market encompasses a diverse range of electronic components essential for various end-uses, including communications, computing devices, industrial automation, robotics, automation, consumer electronics, and medical devices. These components, which include voltage amplifiers, transconductance amplifiers, power amplifiers, voltage regulators, analog-to-digital converters, threshold detectors, and comparators, play a pivotal role in signal conditioning, power management, and control systems. 
  • The market's growth is driven by the increasing demand for IoT sensors, widebandgap semiconductors, and advanced technologies such as 5G, robotics, and automation. The integration of these components in applications like audio systems, safety systems, ADAS systems, tablets, smartphones, wearable devices, and industrial segments is fueling market expansion.
  • Additionally, the power control industry's growing reliance on amplifiers and comparators for power management and voltage regulation further bolsters market growth. Overall, the market is expected to experience significant growth, driven by technological advancements and increasing demand across various end-use industries.

How is this Amplifier And Comparator Industry segmented and which is the largest segment?

The amplifier and comparator industry research report provides comprehensive data (region-wise segment analysis), with forecasts and estimates in "USD billion" for the period 2024-2028, as well as historical data from 2018-2022 for the following segments.

  • End-user
    • Industrial
    • Communications
    • Computing devices
    • Consumer electronics
    • Others
  • Geography
    • APAC
      • China
      • Japan
      • South Korea
    • North America
      • US
    • Europe
      • Germany
    • South America
    • Middle East and Africa

By End-user Insights

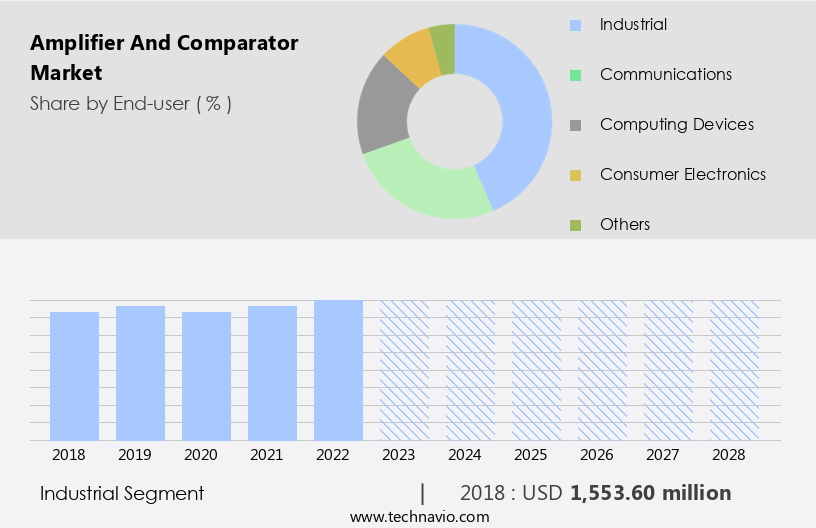
  • The industrial segment is estimated to witness significant growth during the forecast period.

Process control systems are essential in various industries, including food processing, automotive assembly, oil refining, and manufacturing, to ensure efficient process flow and maximize throughput. Semiconductor components, such as sensors and actuators, play a crucial role In these systems by providing reliable control of open and closed-loop processes. The integration of semiconductors, including amplifiers, comparators, voltage regulators, analog-to-digital converters, and threshold detectors, has significantly improved the functionality of process control systems. These systems require high performance, reliability, and energy efficiency, making the integration of advanced semiconductor technologies essential. The semiconductor industry is witnessing significant growth due to the increasing adoption of eco-friendly, energy-saving technologies and R&D investments in widebandgap semiconductors and IoT sensors.

Key applications include factory automation, process control, power electronics, sensor instrumentation, automation systems, generators, electric motors, and various end-use industries such as communications, computing devices, and consumer electronics.

Amplifier And Comparator Market Size

Get a glance at the Amplifier And Comparator Industry report of share of various segments Request Free Sample

The Industrial segment was valued at USD 1.55 billion in 2018 and showed a gradual increase during the forecast period.

Regional Analysis

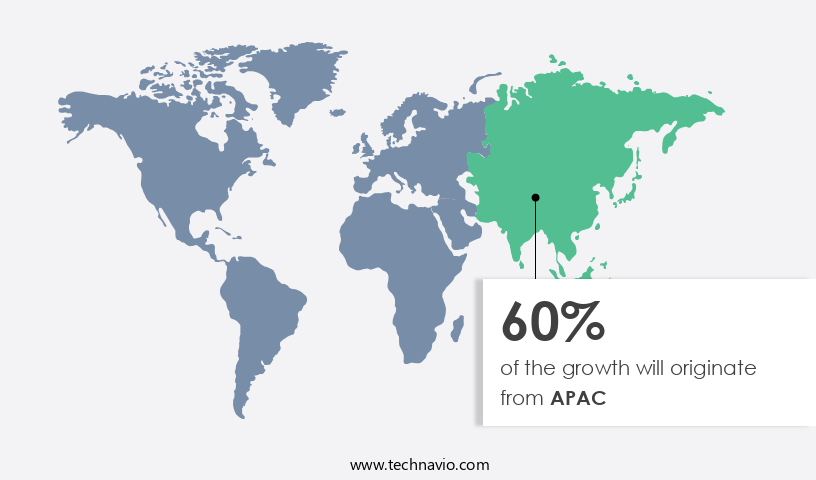
  • APAC is estimated to contribute 60% to the growth of the global market during the forecast period.

Technavio's analysts have elaborately explained the regional trends and drivers that shape the market during the forecast period.

Amplifier And Comparator Market Share by Geography

For more insights on the market share of various regions, Request Free Sample

The market encompasses various types of amplifiers, such as voltage amplifiers, transconductance amplifiers, and power amplifiers, as well as comparators, including voltage regulators, analog-to-digital converters, threshold detectors, and voltage regulators. This market caters to numerous end-use industries, including communications, computing devices, consumer electronics, automotive, industrial, and medical. Key players in this market include Analog Devices, Linear Technology, and several other leading manufacturers. APAC is a significant region for the market due to its manufacturing hub status, driven by the availability of cheap labor and machinery in countries like Japan, South Korea, and China. Economic growth in China and India is fueling the demand for consumer electronic devices, particularly smartphones, in this region.

China's demand for electronic devices outpaces its production levels, leading to a growing market for imports. Notable companies In the APAC consumer electronics market include Oppo Electronics Corporation and Vivo Communication Technology Co. The market is witnessing significant growth due to the increasing adoption of eco-friendly, energy-saving technologies and R&D investments. Widebandgap semiconductors, IoT sensors, and 5G are emerging trends in this market. The market is also expanding In the industrial segment, with applications in factory automation, process control, power electronics, sensor instrumentation, and automation systems. Competition In the market is intense, with key players investing in innovation and product development to maintaIn their market position.

Market Dynamics

Our  researchers analyzed the data with 2023 as the base year, along with the key drivers, trends, and challenges. A holistic analysis of drivers will help companies refine their marketing strategies to gain a competitive advantage.

What are the key market drivers leading to the rise In the adoption of Amplifier And Comparator Industry?

Proliferation of next-generation LTE wireless networks is the key driver of the market.

  • The market is witnessing significant growth due to the increasing adoption of advanced technologies such as 5G, robotics, automation, and the Internet of Things (IoT) in various end-use industries. The communications sector, particularly telecommunication companies, are investing heavily in 5G networks, driving the demand for high-performance amplifiers and comparators. In the manufacturing industry, the integration of automation systems, sensors, and instrumentation in factory automation and process control applications is fueling the market growth. Additionally, the increasing popularity of consumer electronics, including tablets, smartphones, wearable devices, and medical devices, is boosting the demand for voltage amplifiers, transconductance amplifiers, power amplifiers, voltage regulators, analog-to-digital converters, threshold detectors, and other related components.
  • The power control industry, including electric vehicles and renewable energy systems, is also a significant contributor to the market growth. Widebandgap semiconductors are gaining popularity due to their eco-friendliness and energy-saving properties, further propelling the market forward. The market is expected to continue its growth trajectory, with R&D investments and technological advancements driving innovation. Lucintel forecasts the market to reach significant levels by the end of the forecast period. PCB-based amplifiers, safety systems, audio systems, ADAS systems, generators, electric motors, and other applications are also contributing to the market growth.

What are the market trends shaping the Amplifier And Comparator Industry?

Growing applications of IoT is the upcoming market trend.

  • The market is experiencing significant growth due to the increasing adoption of IoT technology across various industries. IoT devices, which include sensors, actuators, and communication systems, rely on amplifiers and comparators for signal conditioning and processing. These components are essential for the proper functioning of IoT systems in sectors such as consumer electronics, automotive, telecommunications, manufacturing, and healthcare. Amplifiers and comparators are used in various applications, including voltage amplifiers, transconductance amplifiers, power amplifiers, voltage regulators, analog-to-digital converters, threshold detectors, and more. Widebandgap semiconductors, such as gallium nitride (GaN) and silicon carbide (SiC), are gaining popularity In the power electronics industry due to their energy-saving properties and high power handling capabilities.
  • This trend is expected to drive the demand for amplifiers and comparators In the power control industry. The market for amplifiers and comparators is diverse, with applications ranging from industrial automation and process control to communications, computing devices, and safety systems. End-use industries include automotive, where amplifiers and comparators are used in ADAS systems, tablets, smartphones, wearable devices, and medical devices. The competition In the market is intense, with major players such as Analog Devices and Linear Technology leading the way in innovation and R&D investments. The market is expected to grow at significant levels In the coming years due to the increasing demand for eco-friendly, energy-saving technologies and the expanding use cases of IoT devices.

What challenges does the Amplifier And Comparator Industry face during its growth?

High design complexity is a key challenge affecting the industry growth.

  • The market is witnessing significant growth due to the increasing integration of advanced technologies such as 5G, robotics, automation, and IoT sensors in various end-use industries. In the communications sector, the demand for voltage amplifiers, transconductance amplifiers, power amplifiers, voltage regulators, analog-to-digital converters, threshold detectors, and other related components is increasing due to the need for high-performance and energy-efficient solutions. The power control industry, including power electronics, sensor instrumentation, automation systems, generators, and electric motors, is also driving the market growth. Widebandgap semiconductors, such as gallium nitride (GaN) and silicon carbide (SiC), are gaining popularity due to their energy-saving and eco-friendly properties.
  • These semiconductors are used in various applications, including industrial automation, factory process control, power electronics, and military and aerospace markets. The consumer electronics industry, including medical devices, audio systems, safety systems, ADAS systems, and wearable devices, is also contributing to the market growth. Key market players are investing heavily in R&D to develop miniaturized and high-performance amplifiers and comparators. For instance, Analog Devices and Linear Technology offer PCB-based amplifiers for various applications. The market is also witnessing the emergence of new players offering innovative solutions, leading to increased competition. Overall, the market is expected to grow significantly In the coming years due to the increasing demand for advanced electronic components in various end-use industries.

Exclusive Customer Landscape

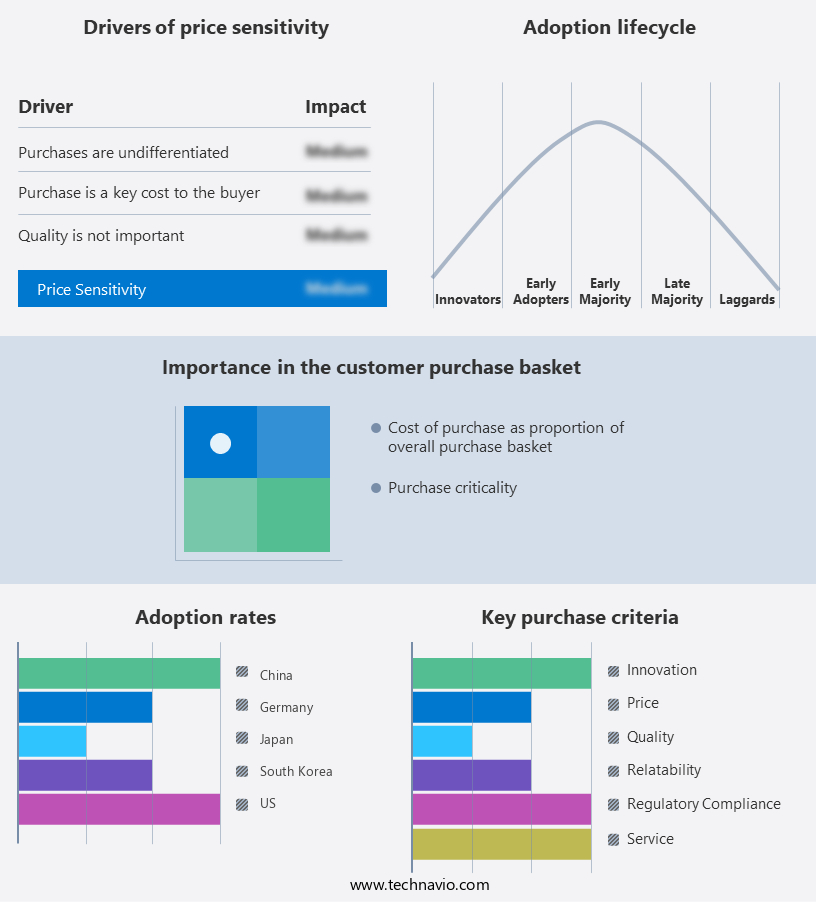
The amplifier and comparator market forecasting report includes the adoption lifecycle of the market, covering from the innovator's stage to the laggard's stage. It focuses on adoption rates in different regions based on penetration. Furthermore, the amplifier and comparator market report also includes key purchase criteria and drivers of price sensitivity to help companies evaluate and develop their market growth analysis strategies.

Amplifier And Comparator Market Share by Geography

 Customer Landscape

Key Companies & Market Insights

Companies are implementing various strategies, such as strategic alliances, amplifier and comparator market forecast, partnerships, mergers and acquisitions, geographical expansion, and product/service launches, to enhance their presence In the industry.

ABB Ltd. - The company provides a range of operational amplifiers, including the AD8065, AD8605, and AD8061 models, catering to various applications withIn the market. These amplifiers offer high performance, accuracy, and low power consumption, making them suitable for signal conditioning, instrumentation, and precision applications.

The industry research and growth report includes detailed analyses of the competitive landscape of the market and information about key companies, including:

  • ABB Ltd.
  • Analog Devices Inc.
  • BONN Elektronik GmbH
  • Broadcom Inc.
  • Electronics and Innovation Ltd.
  • Fuji Electric Co. Ltd.
  • Infinite Electronics Inc.
  • Linearized Amplifier Technologies and Services Pvt. Ltd.
  • MACOM Technology Solutions Inc.
  • MediaTek Inc.
  • Microchip Technology Inc.
  • NXP Semiconductors NV
  • ON Semiconductor Corp.
  • Qorvo Inc.
  • Qualcomm Inc.
  • Renesas Electronics Corp.
  • Skyworks Solutions Inc.
  • STMicroelectronics International N.V.
  • Texas Instruments Inc.
  • Toshiba Corp.

Qualitative and quantitative analysis of companies has been conducted to help clients understand the wider business environment as well as the strengths and weaknesses of key industry players. Data is qualitatively analyzed to categorize companies as pure play, category-focused, industry-focused, and diversified; it is quantitatively analyzed to categorize companies as dominant, leading, strong, tentative, and weak.

Research Analyst Overview

The market encompasses a diverse range of electronic components that play essential roles in various industries and applications. Amplifiers amplify electrical signals, enabling them to be transmitted or processed more effectively, while comparators compare two input signals and produce an output based on their relationship. The amplifier market witnesses continuous growth due to the increasing demand for power amplifiers in power electronics applications, such as factory automation and process control. These systems require high power output to operate machinery and equipment efficiently. Additionally, the integration of amplifiers in communication systems, computing devices, and sensor instrumentation contributes to the market's expansion.

Comparators, on the other hand, find extensive use in various end-use industries, including automation systems, safety systems, and medical devices. For instance, in automation systems, comparators are employed for controlling processes based on specific threshold levels. In safety systems, they are used for detecting abnormal conditions and triggering alarms or shutting down systems to prevent potential hazards. In medical devices, comparators help in signal conditioning and processing, ensuring accurate and reliable performance. The communications sector is another significant market for amplifiers and comparators. Amplifiers are crucial components in power amplifiers for wireless communication systems, including cellular networks, satellite communication, and radio systems.

Comparators are employed in various communication applications, such as level shifters, voltage regulators, and threshold detectors. The power control industry, including voltage regulators and power amplifiers, experiences significant growth due to the increasing demand for energy-saving technologies and eco-friendly solutions. Widebandgap semiconductors, such as gallium nitride (GaN) and silicon carbide (SiC), are gaining popularity in power electronics due to their high power handling capabilities and energy efficiency. The market is driven by various factors, including technological advancements, increasing demand from various industries, and R&D investments. The market is expected to grow at a steady pace due to the continuous innovation and development of new applications for these components.

The market for amplifiers and comparators is highly competitive, with several key players offering a wide range of products catering to various industries and applications. The market is characterized by a high degree of innovation and technological advancements, with companies investing heavily in R&D to develop new and improved products. In conclusion, the market is a dynamic and growing industry, driven by the increasing demand for power electronics, communication systems, and various end-use applications. The market is characterized by continuous innovation, technological advancements, and a high degree of competition. Companies operating in this market must stay abreast of the latest trends and developments to remain competitive and meet the evolving needs of their customers.

Market Scope

Report Coverage

Details

Page number

165

Base year

2023

Historic period

2018-2022

Forecast period

2024-2028

Growth momentum & CAGR

Accelerate at a CAGR of 4.5%

Market growth 2024-2028

USD 1.02 billion

Market structure

Fragmented

YoY growth 2023-2024(%)

4.23

Key countries

China, US, Germany, Japan, and South Korea

Competitive landscape

Leading Companies, Market Positioning of Companies, Competitive Strategies, and Industry Risks

Request Free Sample

What are the Key Data Covered in this Amplifier And Comparator Market Research and Growth Report?

  • CAGR of the Amplifier And Comparator industry during the forecast period
  • Detailed information on factors that will drive the growth and forecasting between 2024 and 2028
  • Precise estimation of the size of the market and its contribution of the industry in focus to the parent market
  • Accurate predictions about upcoming growth and trends and changes in consumer behaviour
  • Growth of the market across APAC, North America, Europe, South America, and Middle East and Africa
  • Thorough analysis of the market's competitive landscape and detailed information about companies
  • Comprehensive analysis of factors that will challenge the amplifier and comparator market growth of industry companies

We can help! Our analysts can customize this amplifier and comparator market research report to meet your requirements.

Get in touch

1 Executive Summary

  • 1.1 Market overview
    • Executive Summary - Chart on Market Overview
    • Executive Summary - Data Table on Market Overview
    • Executive Summary - Chart on Global Market Characteristics
    • Executive Summary - Chart on Market by Geography
    • Executive Summary - Chart on Market Segmentation by End-user
    • Executive Summary - Chart on Incremental Growth
    • Executive Summary - Data Table on Incremental Growth
    • Executive Summary - Chart on Company Market Positioning

2 Market Landscape

  • 2.1 Market ecosystem
    • Parent Market
    • Data Table on - Parent Market
  • 2.2 Market characteristics
    • Market characteristics analysis
  • 2.3 Value chain analysis
    • Value Chain Analysis

3 Market Sizing

  • 3.1 Market definition
    • Offerings of companies included in the market definition
  • 3.2 Market segment analysis
    • Market segments
  • 3.3 Market size 2023
    • 3.4 Market outlook: Forecast for 2023-2028
      • Chart on Global - Market size and forecast 2023-2028 ($ million)
      • Data Table on Global - Market size and forecast 2023-2028 ($ million)
      • Chart on Global Market: Year-over-year growth 2023-2028 (%)
      • Data Table on Global Market: Year-over-year growth 2023-2028 (%)

    4 Historic Market Size

    • 4.1 Global Amplifier And Comparator Market 2018 - 2022
      • Historic Market Size - Data Table on Global Amplifier And Comparator Market 2018 - 2022 ($ million)
    • 4.2 End-user segment analysis 2018 - 2022
      • Historic Market Size - End-user Segment 2018 - 2022 ($ million)
    • 4.3 Geography segment analysis 2018 - 2022
      • Historic Market Size - Geography Segment 2018 - 2022 ($ million)
    • 4.4 Country segment analysis 2018 - 2022
      • Historic Market Size - Country Segment 2018 - 2022 ($ million)

    5 Five Forces Analysis

    • 5.1 Five forces summary
      • Five forces analysis - Comparison between 2023 and 2028
    • 5.2 Bargaining power of buyers
      • Bargaining power of buyers - Impact of key factors 2023 and 2028
    • 5.3 Bargaining power of suppliers
      • Bargaining power of suppliers - Impact of key factors in 2023 and 2028
    • 5.4 Threat of new entrants
      • Threat of new entrants - Impact of key factors in 2023 and 2028
    • 5.5 Threat of substitutes
      • Threat of substitutes - Impact of key factors in 2023 and 2028
    • 5.6 Threat of rivalry
      • Threat of rivalry - Impact of key factors in 2023 and 2028
    • 5.7 Market condition
      • Chart on Market condition - Five forces 2023 and 2028

    6 Market Segmentation by End-user

    • 6.1 Market segments
      • Chart on End-user - Market share 2023-2028 (%)
      • Data Table on End-user - Market share 2023-2028 (%)
    • 6.2 Comparison by End-user
      • Chart on Comparison by End-user
      • Data Table on Comparison by End-user
    • 6.3 Industrial - Market size and forecast 2023-2028
      • Chart on Industrial - Market size and forecast 2023-2028 ($ million)
      • Data Table on Industrial - Market size and forecast 2023-2028 ($ million)
      • Chart on Industrial - Year-over-year growth 2023-2028 (%)
      • Data Table on Industrial - Year-over-year growth 2023-2028 (%)
    • 6.4 Communications - Market size and forecast 2023-2028
      • Chart on Communications - Market size and forecast 2023-2028 ($ million)
      • Data Table on Communications - Market size and forecast 2023-2028 ($ million)
      • Chart on Communications - Year-over-year growth 2023-2028 (%)
      • Data Table on Communications - Year-over-year growth 2023-2028 (%)
    • 6.5 Computing devices - Market size and forecast 2023-2028
      • Chart on Computing devices - Market size and forecast 2023-2028 ($ million)
      • Data Table on Computing devices - Market size and forecast 2023-2028 ($ million)
      • Chart on Computing devices - Year-over-year growth 2023-2028 (%)
      • Data Table on Computing devices - Year-over-year growth 2023-2028 (%)
    • 6.6 Consumer electronics - Market size and forecast 2023-2028
      • Chart on Consumer electronics - Market size and forecast 2023-2028 ($ million)
      • Data Table on Consumer electronics - Market size and forecast 2023-2028 ($ million)
      • Chart on Consumer electronics - Year-over-year growth 2023-2028 (%)
      • Data Table on Consumer electronics - Year-over-year growth 2023-2028 (%)
    • 6.7 Others - Market size and forecast 2023-2028
      • Chart on Others - Market size and forecast 2023-2028 ($ million)
      • Data Table on Others - Market size and forecast 2023-2028 ($ million)
      • Chart on Others - Year-over-year growth 2023-2028 (%)
      • Data Table on Others - Year-over-year growth 2023-2028 (%)
    • 6.8 Market opportunity by End-user
      • Market opportunity by End-user ($ million)
      • Data Table on Market opportunity by End-user ($ million)

    7 Customer Landscape

    • 7.1 Customer landscape overview
      • Analysis of price sensitivity, lifecycle, customer purchase basket, adoption rates, and purchase criteria

    8 Geographic Landscape

    • 8.1 Geographic segmentation
      • Chart on Market share by geography 2023-2028 (%)
      • Data Table on Market share by geography 2023-2028 (%)
    • 8.2 Geographic comparison
      • Chart on Geographic comparison
      • Data Table on Geographic comparison
    • 8.3 APAC - Market size and forecast 2023-2028
      • Chart on APAC - Market size and forecast 2023-2028 ($ million)
      • Data Table on APAC - Market size and forecast 2023-2028 ($ million)
      • Chart on APAC - Year-over-year growth 2023-2028 (%)
      • Data Table on APAC - Year-over-year growth 2023-2028 (%)
    • 8.4 North America - Market size and forecast 2023-2028
      • Chart on North America - Market size and forecast 2023-2028 ($ million)
      • Data Table on North America - Market size and forecast 2023-2028 ($ million)
      • Chart on North America - Year-over-year growth 2023-2028 (%)
      • Data Table on North America - Year-over-year growth 2023-2028 (%)
    • 8.5 Europe - Market size and forecast 2023-2028
      • Chart on Europe - Market size and forecast 2023-2028 ($ million)
      • Data Table on Europe - Market size and forecast 2023-2028 ($ million)
      • Chart on Europe - Year-over-year growth 2023-2028 (%)
      • Data Table on Europe - Year-over-year growth 2023-2028 (%)
    • 8.6 South America - Market size and forecast 2023-2028
      • Chart on South America - Market size and forecast 2023-2028 ($ million)
      • Data Table on South America - Market size and forecast 2023-2028 ($ million)
      • Chart on South America - Year-over-year growth 2023-2028 (%)
      • Data Table on South America - Year-over-year growth 2023-2028 (%)
    • 8.7 Middle East and Africa - Market size and forecast 2023-2028
      • Chart on Middle East and Africa - Market size and forecast 2023-2028 ($ million)
      • Data Table on Middle East and Africa - Market size and forecast 2023-2028 ($ million)
      • Chart on Middle East and Africa - Year-over-year growth 2023-2028 (%)
      • Data Table on Middle East and Africa - Year-over-year growth 2023-2028 (%)
    • 8.8 China - Market size and forecast 2023-2028
      • Chart on China - Market size and forecast 2023-2028 ($ million)
      • Data Table on China - Market size and forecast 2023-2028 ($ million)
      • Chart on China - Year-over-year growth 2023-2028 (%)
      • Data Table on China - Year-over-year growth 2023-2028 (%)
    • 8.9 US - Market size and forecast 2023-2028
      • Chart on US - Market size and forecast 2023-2028 ($ million)
      • Data Table on US - Market size and forecast 2023-2028 ($ million)
      • Chart on US - Year-over-year growth 2023-2028 (%)
      • Data Table on US - Year-over-year growth 2023-2028 (%)
    • 8.10 Germany - Market size and forecast 2023-2028
      • Chart on Germany - Market size and forecast 2023-2028 ($ million)
      • Data Table on Germany - Market size and forecast 2023-2028 ($ million)
      • Chart on Germany - Year-over-year growth 2023-2028 (%)
      • Data Table on Germany - Year-over-year growth 2023-2028 (%)
    • 8.11 Japan - Market size and forecast 2023-2028
      • Chart on Japan - Market size and forecast 2023-2028 ($ million)
      • Data Table on Japan - Market size and forecast 2023-2028 ($ million)
      • Chart on Japan - Year-over-year growth 2023-2028 (%)
      • Data Table on Japan - Year-over-year growth 2023-2028 (%)
    • 8.12 South Korea - Market size and forecast 2023-2028
      • Chart on South Korea - Market size and forecast 2023-2028 ($ million)
      • Data Table on South Korea - Market size and forecast 2023-2028 ($ million)
      • Chart on South Korea - Year-over-year growth 2023-2028 (%)
      • Data Table on South Korea - Year-over-year growth 2023-2028 (%)
    • 8.13 Market opportunity by geography
      • Market opportunity by geography ($ million)
      • Data Tables on Market opportunity by geography ($ million)

    9 Drivers, Challenges, and Opportunity/Restraints

    • 9.1 Market drivers
      • 9.2 Market challenges
        • 9.3 Impact of drivers and challenges
          • Impact of drivers and challenges in 2023 and 2028
        • 9.4 Market opportunities/restraints

          10 Competitive Landscape

          • 10.1 Overview
            • 10.2 Competitive Landscape
              • Overview on criticality of inputs and factors of differentiation
            • 10.3 Landscape disruption
              • Overview on factors of disruption
            • 10.4 Industry risks
              • Impact of key risks on business

            11 Competitive Analysis

            • 11.1 Companies profiled
              • Companies covered
            • 11.2 Market positioning of companies
              • Matrix on companies position and classification
            • 11.3 Analog Devices Inc.
              • Analog Devices Inc. - Overview
              • Analog Devices Inc. - Business segments
              • Analog Devices Inc. - Key news
              • Analog Devices Inc. - Key offerings
              • Analog Devices Inc. - Segment focus
            • 11.4 BONN Elektronik GmbH
              • BONN Elektronik GmbH - Overview
              • BONN Elektronik GmbH - Product / Service
              • BONN Elektronik GmbH - Key offerings
            • 11.5 Broadcom Inc.
              • Broadcom Inc. - Overview
              • Broadcom Inc. - Business segments
              • Broadcom Inc. - Key news
              • Broadcom Inc. - Key offerings
              • Broadcom Inc. - Segment focus
            • 11.6 MediaTek Inc.
              • MediaTek Inc. - Overview
              • MediaTek Inc. - Product / Service
              • MediaTek Inc. - Key news
              • MediaTek Inc. - Key offerings
            • 11.7 Microchip Technology Inc.
              • Microchip Technology Inc. - Overview
              • Microchip Technology Inc. - Business segments
              • Microchip Technology Inc. - Key news
              • Microchip Technology Inc. - Key offerings
              • Microchip Technology Inc. - Segment focus
            • 11.8 NXP Semiconductors NV
              • NXP Semiconductors NV - Overview
              • NXP Semiconductors NV - Product / Service
              • NXP Semiconductors NV - Key news
              • NXP Semiconductors NV - Key offerings
            • 11.9 Qualcomm Inc.
              • Qualcomm Inc. - Overview
              • Qualcomm Inc. - Business segments
              • Qualcomm Inc. - Key news
              • Qualcomm Inc. - Key offerings
              • Qualcomm Inc. - Segment focus
            • 11.10 Renesas Electronics Corp.
              • Renesas Electronics Corp. - Overview
              • Renesas Electronics Corp. - Business segments
              • Renesas Electronics Corp. - Key news
              • Renesas Electronics Corp. - Key offerings
              • Renesas Electronics Corp. - Segment focus
            • 11.11 Skyworks Solutions Inc.
              • Skyworks Solutions Inc. - Overview
              • Skyworks Solutions Inc. - Product / Service
              • Skyworks Solutions Inc. - Key news
              • Skyworks Solutions Inc. - Key offerings
            • 11.12 Texas Instruments Inc.
              • Texas Instruments Inc. - Overview
              • Texas Instruments Inc. - Business segments
              • Texas Instruments Inc. - Key news
              • Texas Instruments Inc. - Key offerings
              • Texas Instruments Inc. - Segment focus

            12 Appendix

            • 12.1 Scope of the report
              • 12.2 Inclusions and exclusions checklist
                • Inclusions checklist
                • Exclusions checklist
              • 12.3 Currency conversion rates for US$
                • Currency conversion rates for US$
              • 12.4 Research methodology
                • Research methodology
              • 12.5 Data procurement
                • Information sources
              • 12.6 Data validation
                • Data validation
              • 12.7 Validation techniques employed for market sizing
                • Validation techniques employed for market sizing
              • 12.8 Data synthesis
                • Data synthesis
              • 12.9 360 degree market analysis
                • 360 degree market analysis
              • 12.10 List of abbreviations
                • List of abbreviations

              Research Methodology

              Technavio presents a detailed picture of the market by way of study, synthesis, and summation of data from multiple sources. The analysts have presented the various facets of the market with a particular focus on identifying the key industry influencers. The data thus presented is comprehensive, reliable, and the result of extensive research, both primary and secondary.

              INFORMATION SOURCES

              Primary sources

              • Manufacturers and suppliers
              • Channel partners
              • Industry experts
              • Strategic decision makers

              Secondary sources

              • Industry journals and periodicals
              • Government data
              • Financial reports of key industry players
              • Historical data
              • Press releases

              DATA ANALYSIS

              Data Synthesis

              • Collation of data
              • Estimation of key figures
              • Analysis of derived insights

              Data Validation

              • Triangulation with data models
              • Reference against proprietary databases
              • Corroboration with industry experts

              REPORT WRITING

              Qualitative

              • Market drivers
              • Market challenges
              • Market trends
              • Five forces analysis

              Quantitative

              • Market size and forecast
              • Market segmentation
              • Geographical insights
              • Competitive landscape

              Interested in this report?

              Get your sample now to see our research methodology and insights!

              Download Now

              Frequently Asked Questions

              Amplifier And Comparator market growth will increase by $ 1024.7 mn during 2024-2028.

              The Amplifier And Comparator market is expected to grow at a CAGR of 4.5% during 2024-2028.

              Amplifier And Comparator market is segmented by End-user( Industrial, Communications, Computing devices, Consumer electronics, Others)

              ABB Ltd., Analog Devices Inc., BONN Elektronik GmbH, Broadcom Inc., Electronics and Innovation Ltd., Fuji Electric Co. Ltd., Infinite Electronics Inc., Linearized Amplifier Technologies and Services Pvt. Ltd., MACOM Technology Solutions Inc., MediaTek Inc., Microchip Technology Inc., NXP Semiconductors NV, ON Semiconductor Corp., Qorvo Inc., Qualcomm Inc., Renesas Electronics Corp., Skyworks Solutions Inc., STMicroelectronics International N.V., Texas Instruments Inc., Toshiba Corp. are a few of the key vendors in the Amplifier And Comparator market.

              APAC will register the highest growth rate of 60% among the other regions. Therefore, the Amplifier And Comparator market in APAC is expected to garner significant business opportunities for the vendors during the forecast period.

              China, US, Germany, Japan, South Korea

              • Proliferation of next-generation LTE wireless networksThere will be an increase in data consumption during the forecast period with the rise in the demand for consumer electronics. The surge in data consumption has forced network carriers to adopt next-generation LTE networks such as fourth-generation (4G) and fifth-generation (5G) is the driving factor this market.
              • making LTE the mobile technology of the future. The increase in the deployment of high-speed telecommunication networks will lead to the launch of consumer electronics capable of supporting high-speed networks. Some of the developments in this regard are mentioned below: In April 2022 is the driving factor this market.
              • OnePlus Technology Co. Ltd. announced the launch of its OnePlus 10 Pro 5G smartphone in India after announcing its global debut in March 2022. The device was previously launched in China in January 2022. The newly launched smartphone is one of the latest OnePlus devices that supports Verizon Communications Inc. (Verizon) 5G network. The device will also have access to Verizons C-Band 5G network is the driving factor this market.
              • which works on the 3.7GHz-4.2GHz spectrum.In March 2022 is the driving factor this market.
              • Samsung Electronics Co. Ltd. announced the launch of its Galaxy A53 5G smartphone in India.In March 2022 is the driving factor this market.
              • BBK Electronics Corp. Ltd. is the driving factor this market.
              • through its brand Oppo is the driving factor this market.
              • introduced its Reno7 series 5G smartphone in Saudi Arabia. This marked the first launch of the brands series in the Middle East market.In November 2021 is the driving factor this market.
              • Lava International Ltd. announced the launch of Lava Agni 5G and became the first Indian consumer electronics brand to launch 5G smartphones for domestic consumers.LTE has specifically designated bands is the driving factor this market.
              • but they vary from carrier to carrier. The gallium nitride (GaN) RF technology is the driving factor this market.
              • along with amplifiers and comparators is the driving factor this market.
              • would be ideal for network service providers as they can provide higher frequency data bandwidth connections. The deployment of GaN RF amplifiers and comparators ensures that the device generates maximum frequency at the necessary band at a point in time and prevents any interference from other frequency bands.LTE-based computing devices offer speed that allows consumers to upload and download music and photographs. They can also play games and watch TV shows online on maximum frequency bands without any interference. This has created an opportunity in the market for amplifiers and comparators to address the requirement for faster and smoother access to mobile data. Therefore is the driving factor this market.
              • the deployment of amplifiers and comparators along with GaN RF devices is expected to assist LTE wireless networks in providing better services is the driving factor this market.
              • leading to revenue growth is the driving factor this market.
              • which is the driving factor this market.
              • in turn is the driving factor this market.
              • will drive the growth of the global amplifier and comparator market during the forecast period. is the driving factor this market.

              The Amplifier And Comparator market vendors should focus on grabbing business opportunities from the Industrial segment as it accounted for the largest market share in the base year.