
Amusement Machine Market Size 2024-2028
The amusement machine market size is forecast to increase by USD 2.4 billion, at a CAGR of 6.4% between 2023 and 2028.
- The market is witnessing significant growth due to several key drivers. The increasing number of entertainment centers is one such factor, as these establishments provide a platform for the deployment of amusement machines. Partnerships and collaborations among industry players are also contributing to market growth. Additionally, regulations on amusement devices, centers, and arcades are driving market expansion, ensuring safety and standardization. However, challenges such as high competition and stringent regulatory requirements pose significant hurdles for market participants. Despite these challenges, the market is expected to continue its growth trajectory, offering numerous opportunities for stakeholders.
What will be the Size of the Amusement Machine Market During the Forecast Period?

- The market encompasses a diverse range of products, including gambling machines, arcade games such as pinball and redemption, and interactive games utilizing displays with motion sensors. Merchant wholesalers play a significant role In the distribution of these machines to various entertainment establishments, including amusement parks, arcades, and family entertainment centers. The market is influenced by the growing home entertainment culture, with digital gaming platforms and multiplayer setups gaining popularity. Leisure spending trends also impact the market, with health and wellness and interactive gaming experiences increasingly preferred. Traditional arcade machines continue to coexist with emerging technologies like motion sensors and mobile gaming applications. Integrated entertainment solutions, offering a blend of food, beverage, and gaming options, are on the rise. Overall, the market is poised for continued growth as consumers seek engaging entertainment experiences.
How is this Amusement Machine Industry segmented and which is the largest segment?
The amusement machine industry research report provides comprehensive data (region-wise segment analysis), with forecasts and estimates in "USD billion" for the period 2024-2028, as well as historical data from 2018-2022 for the following segments.
- Genre
- Action
- Racing
- Shooting
- Sports
- Others
- Product Type
- Arcade
- Redemption
- Pinball
- Others
- Geography
- APAC
- China
- India
- Japan
- South Korea
- North America
- Canada
- US
- Europe
- Germany
- UK
- France
- Italy
- South America
- Middle East and Africa
- APAC
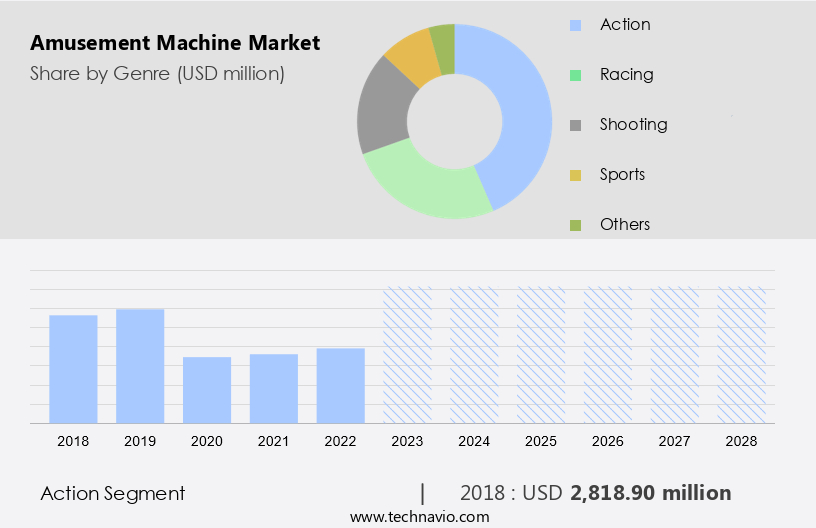
By Genre Insights
- The action segment is estimated to witness significant growth during the forecast period.
The action segment is estimated to witness significant growth during the forecast period. The action segment has become a leading force in the market, driven by technological advancements and shifting player preferences toward high-intensity gaming experiences. Modern action-based machines, equipped with dynamic motion seats, force feedback controls, and ultra-high-definition displays, offer unparalleled levels of player immersion. Categories such as shooting games, racing simulators, and combat-based attractions are particularly popular, drawing significant crowds, especially among teenagers and young adults who seek adrenaline-fueled experiences. Overall, the action segment of the market is thriving due to its ability to deliver high-intensity, good gaming experiences. The continuous integration of advanced technologies, coupled with strategic marketing efforts, ensures that this segment remains a dominant and lucrative part of the industry. As player preferences continue to evolve, the action segment is well-positioned to adapt and grow, maintaining its appeal and driving further market expansion.
Get a glance at the Amusement Machine Industry report of share of various segments Request Free Sample
The Action segment was valued at USD 2.82 billion in 2018 and showed a gradual increase during the forecast period.
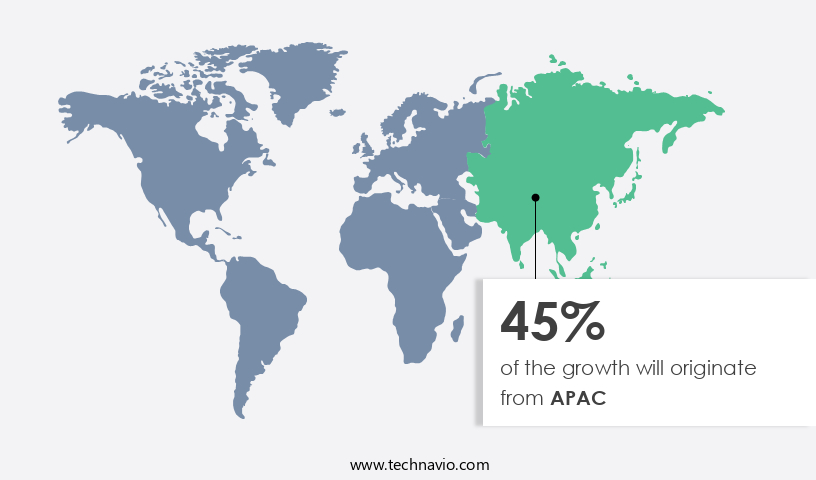
Regional Analysis
- APAC is estimated to contribute 45% to the growth of the global market during the forecast period.
Technavio's analysts have elaborately explained the regional trends and drivers that shape the market during the forecast period.
For more insights on the market share of various regions, Request Free Sample
Indoor amusement centers in India have seen a notable expansion, with over 500 operational in 83 cities, occupying approximately 66 lakh square feet of retail space. This growth signifies the escalating demand for recreational activities in urban areas. These centers cater to diverse entertainment preferences, featuring a mix of traditional arcade machines, digital gaming platforms, and multiplayer setups, as well as attractions like bowling alleys and interactive play zones. The wide array of offerings makes these centers appealing to families, friends, and corporate events, solidifying their status as popular leisure destinations In the Asia-Pacific region.
Market Dynamics
Our amusement machine market researchers analyzed the data with 2023 as the base year, along with the key drivers, trends, and challenges. A holistic analysis of drivers will help companies refine their marketing strategies to gain a competitive advantage.
What are the key market drivers leading to the rise In the adoption of Amusement Machine Industry?
Increasing number of amusement centers is the key driver of the market.
- The market is experiencing notable growth due to the increasing number of entertainment venues such as amusement parks, arcades, and family entertainment centers. Merchants wholesalers are capitalizing on this trend by supplying a wide range of gaming and entertainment machines to these establishments. These machines include arcade games like pinball and redemption games, as well as VR systems, motion sensor games, and interactive games. Beverage establishments such as bars and restaurants are also incorporating amusement machines into their offerings to provide casual entertainment for their patrons. Home entertainment culture is further fueling the market, with the rise of home gaming systems, cloud gaming, and AI integration.
- Amusement parks and family entertainment centers are investing in high-definition graphics and sound systems to create interactive gaming experiences. Indoor and outdoor installations of these machines are becoming increasingly popular, with integrated entertainment solutions offering multiplayer setups and standalone arcades. Leisure spending on entertainment continues to rise, with consumers seeking quick entertainment solutions and virtual reality experiences. The market for amusement machines is expected to grow significantly In the coming years, driven by the demand for traditional arcade machines, digital gaming platforms, and gamification community building. Amusement arcades remain a staple of American culture, offering a diverse range of entertainment options for people of all ages.
What are the market trends shaping the Amusement Machine Industry?
Partnerships and collaborations is the upcoming market trend.
- The market is experiencing a notable trend toward collaborations and partnerships between merchants wholesalers, amusement parks, arcades, entertainment establishments, and technology companies. These strategic alliances are fostering innovation and broadening market reach. For instance, in April 2024, Unis Technology, a leading amusement and arcade game manufacturer, joined forces with Toikido to create a Pinata Smashlings crane machine. This collaboration brought the digital Roblox game, Pinata Smashlings, to life as a tangible arcade experience, offering fans an and interactive way to engage with their favorite game. Such collaborations are increasingly common as companies capitalize on each other's strengths and tap into new customer demographics.
- This fusion of technology and traditional amusement machines, including arcade games like pinball, redemption games, and VR systems, is revolutionizing the amusement industry. Additionally, the market is expanding to include home entertainment culture, health and wellness, and indoor and outdoor installations. Interactive games, motion sensors, and cloud gaming are also gaining popularity, providing quick entertainment solutions for casual consumers. The market encompasses a diverse range of products, from small-sized amusement machines to integrated entertainment systems, and caters to various leisure spending preferences, including family entertainment centers, restaurants, bars, and amusement arcades. With the integration of hardware, software, and AI, the market is offering increasingly gamified and community-building experiences, enhancing the overall entertainment value for consumers.
What challenges does the Amusement Machine Industry face during its growth?
Regulations on amusement devices, centers, and arcades is a key challenge affecting the industry growth.
- The market is characterized by various dynamics, including regulatory challenges and evolving consumer preferences. Merchant wholesalers supplying amusement machines to entertainment venues, such as amusement parks, arcades, and other entertainment establishments, face stringent regulations that impact their operations. These regulations cover safety standards, age restrictions, and licensing requirements, which necessitate regular inspections, detailed maintenance documentation, and costly modifications to existing machines. Moreover, concerns about gambling-like elements in redemption games have led to restrictions on prize values and game mechanics in some regions. This hinders the ability of operators to offer attractive rewards, potentially reducing the appeal of their games to consumers.
- However, the market is also witnessing innovation with the integration of technology, such as VR systems, motion sensors, and interactive games, into amusement machines. These advancements provide gaming experiences, aligning with the growing home entertainment culture and leisure spending trends. Additionally, the market is expanding to include health and wellness applications, with the integration of gamification and AI into home gaming systems, virtual reality experiences, and interactive gaming experiences. This trend caters to the growing demand for casual entertainment and quick entertainment solutions. The market also includes small-sized amusement machines, suitable for family entertainment centers, game rooms, restaurants, and bars.
Exclusive Customer Landscape
The amusement machine market forecasting report includes the adoption lifecycle of the market, covering from the innovator's stage to the laggard's stage. It focuses on adoption rates in different regions based on penetration. Furthermore, the amusement machine market report also includes key purchase criteria and drivers of price sensitivity to help companies evaluate and develop their market growth analysis strategies.
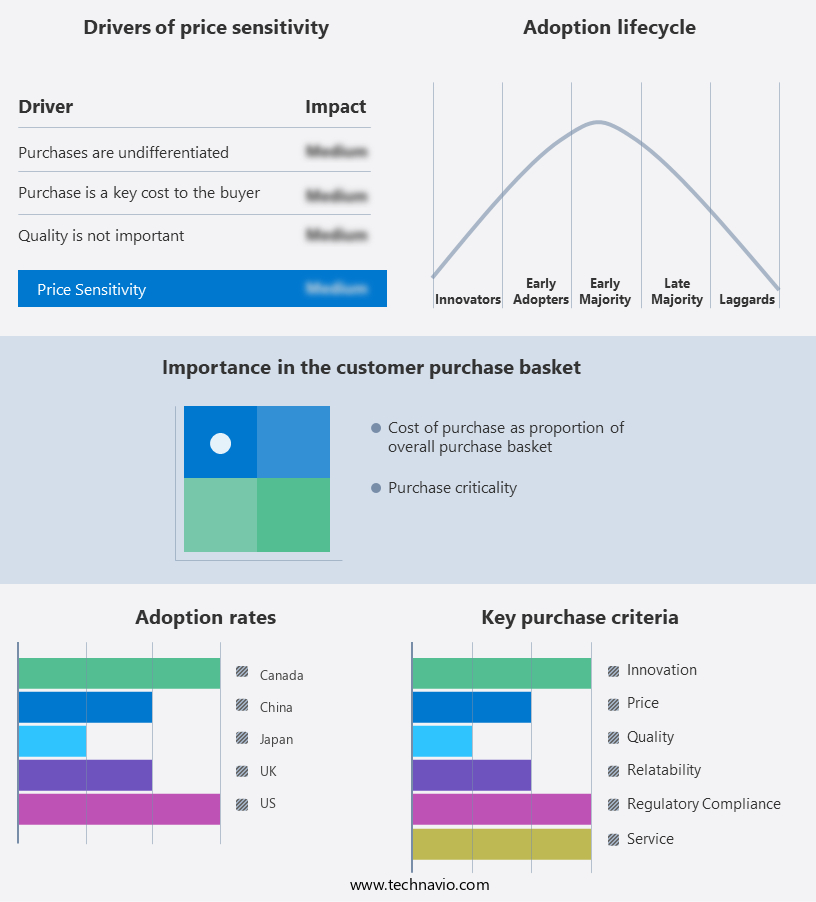
Customer Landscape
Key Companies & Market Insights
Companies are implementing various strategies, such as strategic alliances, amusement machine market forecast, partnerships, mergers and acquisitions, geographical expansion, and product/service launches, to enhance their presence In the industry.
The industry research and growth report includes detailed analyses of the competitive landscape of the market and information about key companies, including:
- American Pinball Inc.
- ELAUT GROUP
- GM-Tech
- Guangzhou EPARK Electronic Technology Co Ltd
- H. Betti Industries Inc.
- HY Technology
- Incredible Technologies Inc.
- JAKAR SP. Z O.O.
- LAI Games
- Neofuns Amusement Equipment Co. Ltd.
- NM Amusement
- PALM FUN Electronics Co Ltd.
- Parvalux Electric Motors
- REX ARCADE
- Sega Amusements International Ltd
- SINORIDES
- Tiny Arcade UK
- TouchMagix Media Pvt. Ltd.
- Yuto games
- Zoom Studios
Qualitative and quantitative analysis of companies has been conducted to help clients understand the wider business environment as well as the strengths and weaknesses of key industry players. Data is qualitatively analyzed to categorize companies as pure play, category-focused, industry-focused, and diversified; it is quantitatively analyzed to categorize companies as dominant, leading, strong, tentative, and weak.
Research Analyst Overview
The market encompasses a diverse range of merchandise designed to provide entertainment and amusement to consumers. This market caters to various sectors, including amusement parks, arcades, entertainment establishments, and even home entertainment culture. The industry's growth is driven by several factors, including the evolution of technology and the increasing demand for casual entertainment and quick entertainment solutions. One significant segment of the market comprises merchant wholesalers supplying arcade machines, pinball machines, redemption games, VR systems, and other interactive gaming experiences to various entertainment venues. These machines cater to diverse consumer preferences, ranging from classic arcade games and pinball games to modern VR systems and digital gaming platforms.
Further, hardware and software advancements continue to play a crucial role In the market. High-definition graphics and sound systems enhance the overall gaming experience, while motion sensors and interactive displays add an extra layer of engagement. Moreover, the integration of AI and cloud gaming technologies is revolutionizing the industry, enabling more personalized and community-building gaming experiences. Indoor and outdoor installations of amusement machines are prevalent in various settings, such as game rooms, family entertainment centers, and even restaurants and bars. Small-sized amusement machines cater to limited spaces, making them a popular choice for businesses looking to offer casual entertainment options.
Moreover, the market is not limited to traditional arcade machines. It also includes a wide array of digital gaming platforms, multiplayer setups, standalone arcades, and integrated entertainment systems. Leisure spending on entertainment continues to increase, fueling the demand for innovative and engaging amusement machines. Mobile gaming and virtual reality experiences are emerging trends In the market. Mobile gaming provides consumers with on-the-go entertainment, while virtual reality experiences offer interactive gaming experiences that blur the line between reality and fantasy.
|
Amusement Machine Market Scope |
|
|
Report Coverage |
Details |
|
Page number |
211 |
|
Base year |
2023 |
|
Historic period |
2018-2022 |
|
Forecast period |
2024-2028 |
|
Growth momentum & CAGR |
Accelerate at a CAGR of 6.4% |
|
Market Growth 2024-2028 |
USD 2.4 billion |
|
Market structure |
Fragmented |
|
YoY growth 2023-2024(%) |
5.1 |
|
Key countries |
US, Japan, China, Canada, UK, South Korea, Germany, France, India, and Italy |
|
Competitive landscape |
Leading Companies, Market Positioning of Companies, Competitive Strategies, and Industry Risks |
What are the Key Data Covered in this Amusement Machine Market Research and Growth Report?
- CAGR of the Amusement Machine industry during the forecast period
- Detailed information on factors that will drive the Amusement Machine Market growth and forecasting between 2024 and 2028
- Precise estimation of the size of the market and its contribution of the industry in focus to the parent market
- Accurate predictions about upcoming growth and trends and changes in consumer behaviour
- Growth of the market across APAC, North America, Europe, South America, and Middle East and Africa
- Thorough analysis of the market's competitive landscape and detailed information about companies
- Comprehensive analysis of factors that will challenge the amusement machine market growth of industry companies
We can help! Our analysts can customize this amusement machine market research report to meet your requirements.
 RIA -
RIA - 
