
Amusement Center Market Size 2024-2028
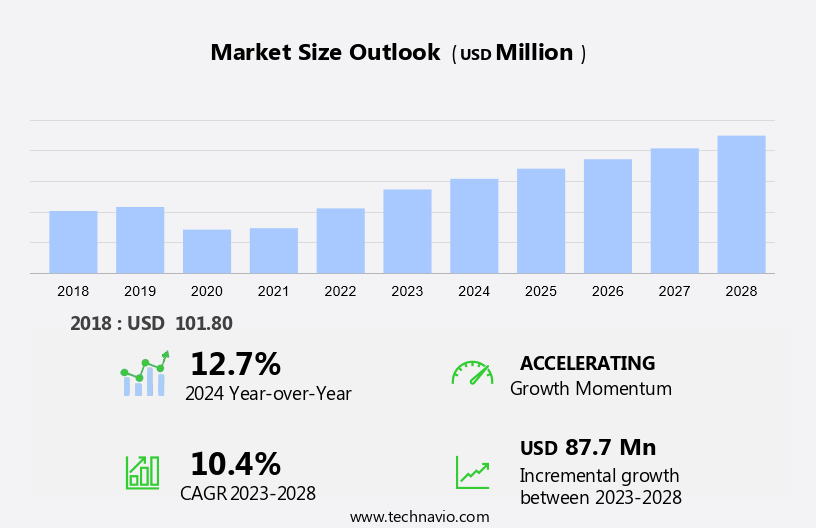
The amusement center market size is forecast to increase by USD 87.7 million at a CAGR of 10.4% between 2023 and 2028.
- The market is experiencing significant growth due to several key factors. One major driver is the increasing disposable income of consumers, enabling them to spend more on entertainment activities. Another trend is the expansion of indoor amusement centers, which offer a variety of experiences under one roof. These centers often include virtual reality and augmented reality gaming zones, skill games, competition games, and physical play activities such as miniature golf courses and bowling alleys. Additionally, there is a growing demand for educational and interactive experiences, leading to the inclusion of museums and zoos in some amusement centers. Safety regulations also play a crucial role in the market, ensuring that all attractions meet stringent safety standards to protect visitors.
What will be the Size of the Market During the Forecast Period?
- The market has experienced significant growth in recent years, catering to the diverse needs of families seeking engaging and enjoyable experiences. These establishments, also known as family amusement centers, family fun centers, indoor amusement parks, and edutainment centers, offer a wide range of activities and attractions. The market comprises various types of entertainment offerings, including science museums, children's museums, arcade studios, and VR (Virtual Reality) and AR (Augmented Reality) experiences. Family-friendly entertainment continues to be a key focus, with active entertainment options such as esports, escape rooms, and laser tag arenas gaining popularity. Indoor entertainment venues have become increasingly important, especially in regions with harsh weather conditions. FECs offer a variety of activities, from traditional arcade games and mini-golf to more innovative virtual reality experiences and interactive attractions.
- Visitor demographics for FECs are diverse, with a focus on families with young children and teenagers. These centers provide a unique blend of education and entertainment, making them an attractive option for parents looking for engaging and interactive experiences for their families. The market is characterized by continuous innovation, with new technologies and attractions being introduced regularly. Virtual reality experiences, attractions, and interactive games are becoming increasingly popular, offering visitors a more engaging and memorable experience. FECs offer a unique blend of education, entertainment, and physical activity, making them an attractive option for families looking for a fun and engaging experience.
How is this market segmented and which is the largest segment?
The market research report provides comprehensive data (region-wise segment analysis), with forecasts and estimates in "USD million" for the period 2024-2028, as well as historical data from 2018-2022 for the following segments.
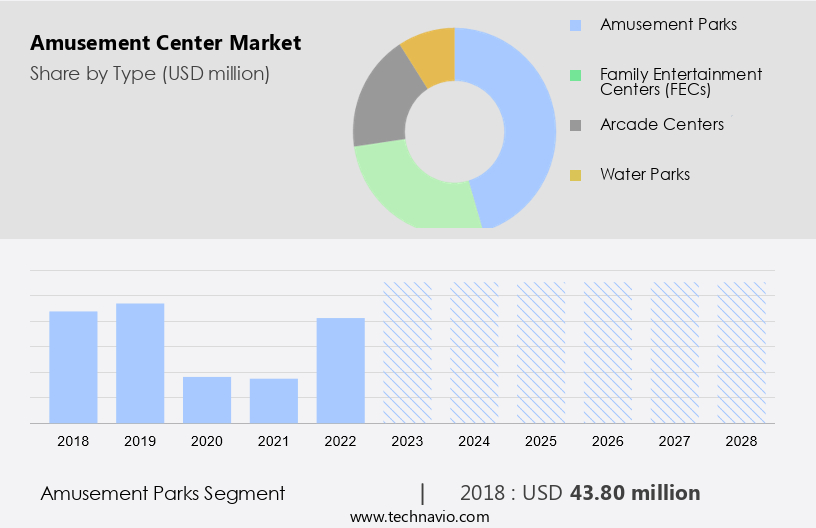
- Type
- Amusement parks
- Family entertainment centers (FECs)
- Arcade centers
- Water parks
- Geography
- North America
- US
- APAC
- China
- India
- Japan
- South Korea
- Europe
- Germany
- UK
- France
- Spain
- South America
- Middle East and Africa
- North America
By Type Insights
- The amusement parks segment is estimated to witness significant growth during the forecast period.
The market is thriving, featuring a wide array of attractions to suit diverse demographics. Virtual Reality (VR) and Augmented Reality (AR) games are gaining popularity, providing great experiences for visitors. Gaming zones and skill games continue to draw crowds, while competition games foster a sense of camaraderie. Physical play activities, such as miniature golf courses and bowling alleys, offer a fun and interactive experience. Museums and zoos are educational alternatives, providing both entertainment and learning opportunities. Notably, Wonderla Holidays, a leading amusement park chain in India, recently expanded with a new park in Bhubaneswar, India, attracting an estimated 3,500 daily visitors. This growth underscores the increasing demand for family entertainment centers and recreational activities within the market.
Which Region is Leading the Market?
Get a glance at the market report of share of various segments Request Free Sample
The amusement parks segment was valued at USD 43.80 million in 2018 and showed a gradual increase during the forecast period.
Regional Analysis
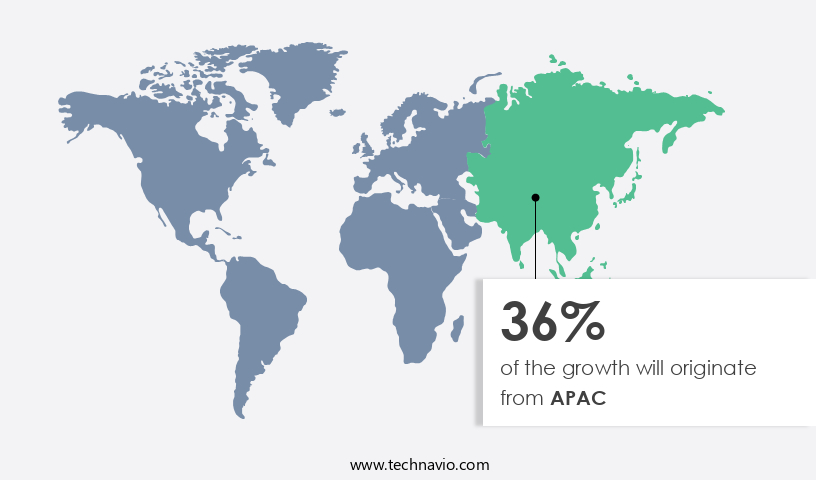
- APAC is estimated to contribute 36% to the growth of the global market during the forecast period.
Technavio's analysts have elaborately explained the regional trends and drivers that shape the market during the forecast period.
For more insights on the market share of various regions Request Free Sample
In the global market, North America is a significant contributor, fueled by continuous innovation and substantial investments in novel attractions. Strategically positioned to open before Memorial Day, this new park aims to heighten competition within the United States, which is renowned for its theme parks. The Internet of Things (IoT) and Artificial Intelligence (AI) are increasingly being integrated into family-friendly entertainment, active entertainment, esports, and escape rooms at Family Entertainment Centers (FECs) and Amusement Parks. These advanced technologies enhance the overall user experience, making amusement attractions more interactive and personalized. These advanced technologies enhance the overall user experience, making amusement attractions more interactive and personalized.
Market Dynamics
Our researchers analyzed the data with 2023 as the base year, along with the key drivers, trends, and challenges. A holistic analysis of drivers will help companies refine their marketing strategies to gain a competitive advantage.
What are the key market drivers leading to the rise in adoption of Amusement Center Market?
Rising disposable income is the key driver of the market.
- The market has witnessed notable growth due to the increasing disposable income among consumers. Amusement centers offer a variety of entertainment options, including Trampoline Parks, Laser Tag Arenas, and Pay-to-Play venues, operating under a Per-Hour Model. Event Rentals for Corporate Events and Birthday Parties are also popular offerings. The market is expected to continue growing, driven by the increasing demand for unique and great entertainment experiences.
- In addition, advanced Entertainment Offerings such as Virtual Reality Games and Movie Theaters add to the overall appeal. Other popular attractions include Bowling Alleys and Arcades. To cater to diverse consumer preferences, amusement centers continue to innovate and expand their offerings. This includes the integration of technology in the form of Virtual Reality Games and Interactive Simulators. With a wide range of offerings, including Trampoline Parks, Laser Tag Arenas, Pay-to-Play venues, Event Rentals, Movie Theaters, Bowling Alleys, and advanced Virtual Reality Games, amusement centers continue to be a popular destination for consumers seeking fun and entertainment.
What are the market trends shaping the Amusement Center Market?
Expansion of indoor amusement centers is the upcoming trend in the market.
- The market is experiencing a notable evolution, with an increasing focus on Indoor Amusement Parks (IAPs). This trend is observable across various regions, including the US, where IAPs are expanding and now occupy around 15 million square feet of retail space. These centers are located in approximately 600 sites in over 100 cities, demonstrating a strong demand. A substantial portion of this space, around 75%, is housed within shopping malls, underscoring the strategic partnership between retail and entertainment industries. This collaboration not only boosts mall traffic but also offers a wide array of entertainment choices for consumers.
- Standalone properties comprise the remaining 25% of the total IAP space, providing specialized venues for amusement experiences. Family amusement centers, also known as Family Fun Centers, Indoor Amusement Parks, or Edutainment centers, offer a diverse range of entertainment options. These include Science museums, Children's museums, Arcade studios, and Virtual Reality (VR) experiences. These centers cater to families, providing a convenient and engaging environment for children and adults alike. The integration of technology, such as VR, adds an extra layer of excitement and innovation, making these centers a popular choice for family outings and group activities.
What challenges does Amusement Center Market face during the growth?
Safety regulations is a key challenge affecting the market growth.
- In the realm of amusement centers, ensuring the safety of visitors is of utmost importance, especially in facilities offering water-based activities and attractions such as water parks. Lifeguards are key figures in maintaining a secure environment, necessitating continuous and thorough training to effectively identify and manage emergencies, including drowning incidents, injuries, and accidents.
- Proper training equips lifeguards with the essential skills to respond promptly and efficiently, potentially saving lives. Their expertise lies in recognizing potential hazards within the water park setting and implementing preventive measures. This involves understanding the unique risks of their specific park, knowing how to address them, and effectively communicating safety protocols to guests. By prioritizing safety, amusement centers can provide a fun and enjoyable experience for all visitors.
Exclusive Customer Landscape
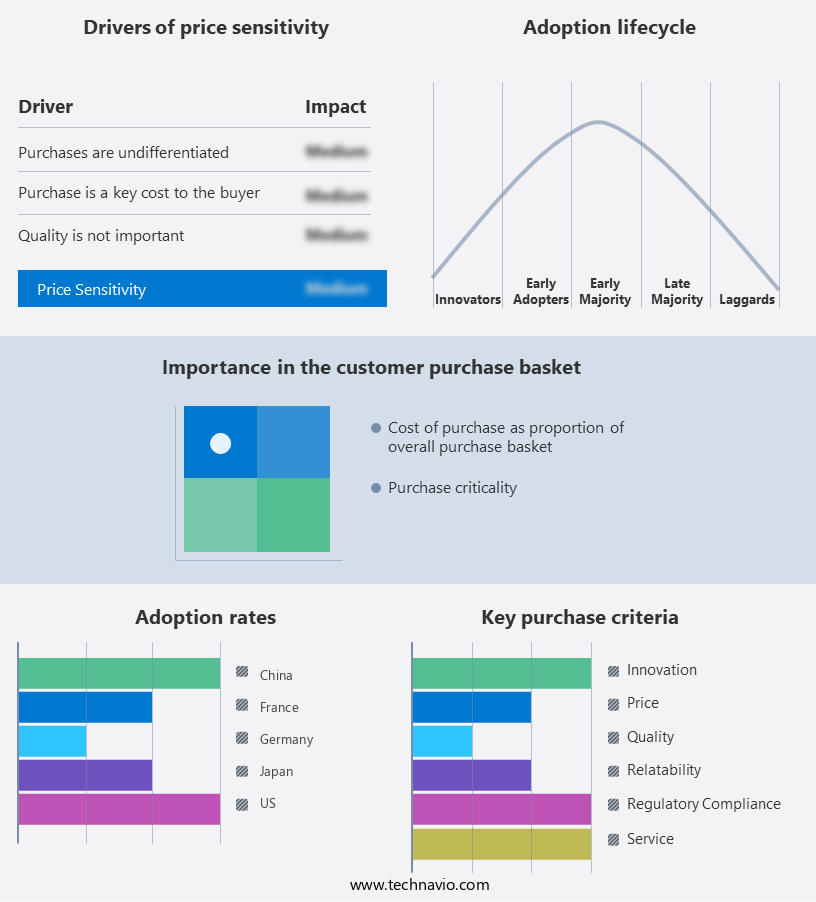
The market forecasting report includes the adoption lifecycle of the market, covering from the innovator's stage to the laggard's stage. It focuses on adoption rates in different regions based on penetration. Furthermore, the market report also includes key purchase criteria and drivers of price sensitivity to help companies evaluate and develop their market growth analysis strategies.
Customer Landscape
Key Companies & Market Insights
Companies are implementing various strategies, such as strategic alliances, market forecast, partnerships, mergers and acquisitions, geographical expansion, and product/service launches, to enhance their presence in the market. The market research and growth report includes detailed analyses of the competitive landscape of the market and information about key companies, including:
- Aquarium of the Pacific
- Bounce Inc.
- CEC Entertainment Concepts L.P.
- Compagnie des Alpes
- Efteling BV
- Europa Park GmbH and Co Mack KG
- Herschend Family Entertainment
- IMG Enterprises
- LEGOLAND Parks
- Lotte Corp.
- Motion JVco Ltd.
- OCT Harbour PLUS
- PARQUES REUNIDOS SERVICIOS CENTRALES SA
- PortAventura Entertainment S A U
- SeaWorld Parks and Entertainment Inc.
- Six Flags Entertainment Corp.
- Sky Zone LLC
- The Walt Disney Co.
- Universal Corp.
- Zamperla
Qualitative and quantitative analysis of companies has been conducted to help clients understand the wider business environment as well as the strengths and weaknesses of key market players. Data is qualitatively analyzed to categorize companies as pure play, category-focused, industry-focused, and diversified; it is quantitatively analyzed to categorize companies as dominant, leading, strong, tentative, and weak.
Research Analyst Overview
Family entertainment centers (FECs) have gained significant popularity in recent years as destinations for family-friendly entertainment. These venues offer a wide range of activities and attractions, including amusement parks, science museums, children's museums, arcade studios, edutainment experiences, VR and AR gaming zones, skill and competition games, physical play activities, miniature golf courses, bowling alleys, and more. FECs provide great experiences through simulation games, indoor playgrounds, special events, parties, and birthdays, catering to various visitor demographics. Gaming technology, such as VR, AR, and 3D, plays a crucial role in enhancing the overall entertainment experience. Mobile gaming and handheld devices are also popular, offering flexibility and convenience.
Further, Esports and escape rooms have emerged as new trends in the industry. FECs have adopted IoT and AI to streamline operations and enhance visitor experience. FECs offer various revenue models, including pay-to-play, per-hour, and event rentals. Entry fees and ticket sales contribute to their revenue, making them a lucrative business opportunity. FECs cater to diverse leisure activities, including movies, bowling alleys, indoor entertainment, and water parks. Overall, FECs provide active entertainment for all ages, making them a preferred choice for casual gatherings and corporate events.
|
Market Scope |
|
|
Report Coverage |
Details |
|
Page number |
187 |
|
Base year |
2023 |
|
Historic period |
2018-2022 |
|
Forecast period |
2024-2028 |
|
Growth momentum & CAGR |
Accelerate at a CAGR of 10.4% |
|
Market growth 2024-2028 |
USD 87.7 million |
|
Market structure |
Concentrated |
|
YoY growth 2023-2024(%) |
12.7 |
|
Key countries |
US, China, France, Germany, Japan, UK, India, Spain, Australia, and South Korea |
|
Competitive landscape |
Leading Companies, Market Positioning of Companies, Competitive Strategies, and Industry Risks |
What are the Key Data Covered in this Market Research and Growth Report?
- CAGR of the market during the forecast period
- Detailed information on factors that will drive the market growth and forecasting between 2024 and 2028
- Precise estimation of the size of the market and its contribution of the market in focus to the parent market
- Accurate predictions about upcoming market growth and trends and changes in consumer behaviour
- Growth of the market across North America, APAC, Europe, South America, and Middle East and Africa
- Thorough analysis of the market's competitive landscape and detailed information about companies
- Comprehensive analysis of factors that will challenge the growth of market companies
We can help! Our analysts can customize this market research report to meet your requirements. Get in touch
 RIA -
RIA - 
