Entertainment And Amusement Market Analysis, Size, and Forecast 2026-2030: North America (US, Canada, and Mexico), Europe (Germany, France, and UK), APAC (China, Japan, and India), South America (Brazil and Argentina), Middle East and Africa (UAE, Saudi Arabia, and South Africa), and Rest of World (ROW)

Entertainment And Amusement Market Analysis, Size, and Forecast 2026-2030:
North America (US, Canada, and Mexico), Europe (Germany, France, and UK), APAC (China, Japan, and India), South America (Brazil and Argentina), Middle East and Africa (UAE, Saudi Arabia, and South Africa), and Rest of World (ROW)

Published: Mar 2026 296 Pages SKU: IRTNTR74811

Market Overview at a Glance

$1241.8 B
Market Opportunity
7.4%
CAGR 2025 - 2030
59.8%
North America Growth
$2615.4 B
Entertainment segment 2024

Entertainment And Amusement Market Size 2026-2030
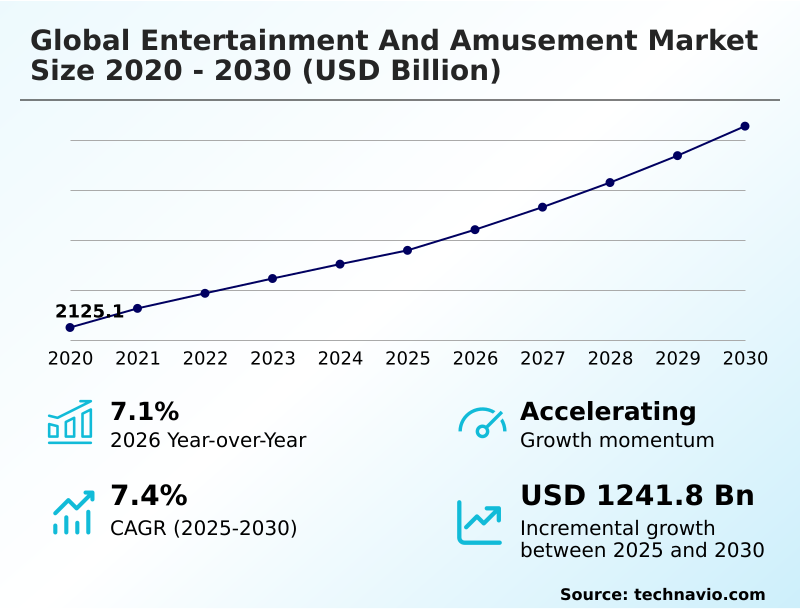
The entertainment and amusement market size is valued to increase by USD 1241.8 billion, at a CAGR of 7.4% from 2025 to 2030. Increasing consumer demand for experiential entertainment will drive the entertainment and amusement market.

Major Market Trends & Insights

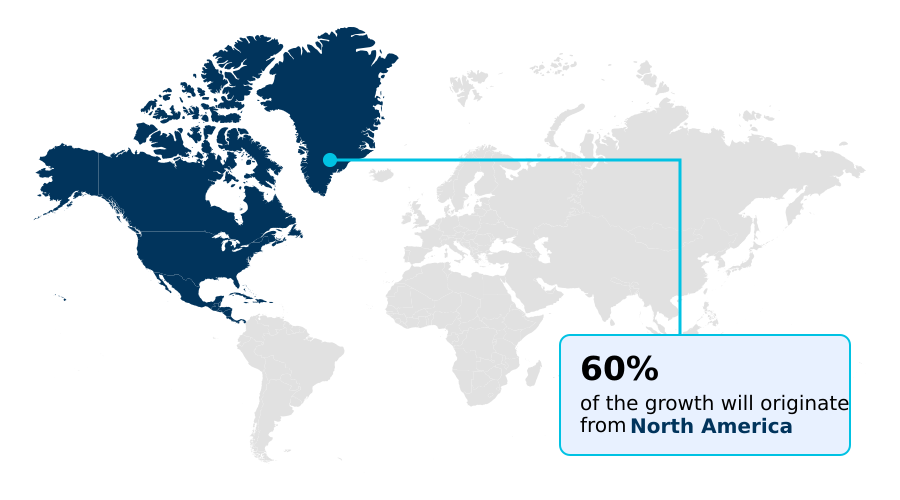
  • North America dominated the market and accounted for a 59.8% growth during the forecast period.
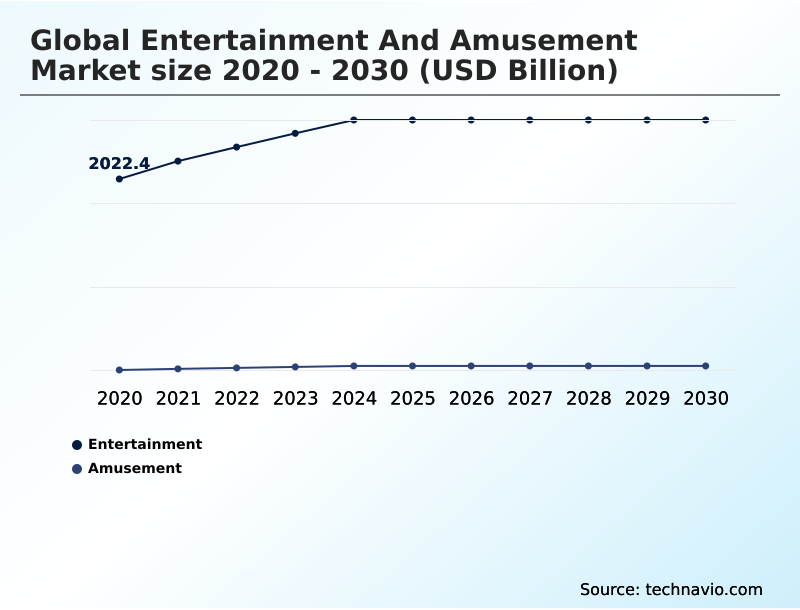
  • By Type - Entertainment segment was valued at USD 2615.4 billion in 2024
  • By Age Group - 13 to 20 years segment accounted for the largest market revenue share in 2024

Market Size & Forecast

  • Market Opportunities: USD 2013.3 billion
  • Market Future Opportunities: USD 1241.8 billion
  • CAGR from 2025 to 2030 : 7.4%

Market Summary

  • The entertainment and amusement market is navigating a significant transformation, driven by evolving consumer expectations and technological advancements. A primary driver is the consumer shift towards experiential consumption, where memorable, shareable activities are valued over material goods. This has spurred investment in immersive experience design and attractions that leverage powerful intellectual property (ip) licensing.
  • However, the industry faces substantial challenges, including escalating operational costs and the intense capital required to develop new, high-throughput attractions. For instance, a theme park operator must balance the high cost of ride system engineering with the need to constantly refresh offerings to maintain visitor interest.
  • The convergence of physical and digital realms, through technologies like augmented reality overlays and personalized content delivery, represents a key trend. This allows for the creation of unique, interactive narrative design, which is essential for engaging a digitally native audience and encouraging repeat visitation in an increasingly competitive landscape.

What will be the Size of the Entertainment And Amusement Market during the forecast period?

Get Key Insights on Market Forecast (PDF) Request Free Sample

How is the Entertainment And Amusement Market Segmented?

The entertainment and amusement industry research report provides comprehensive data (region-wise segment analysis), with forecasts and estimates in "USD billion" for the period 2026-2030, as well as historical data from 2020-2024 for the following segments.

  • Type
    • Entertainment
    • Amusement
  • Age group
    • 13 to 20 years
    • Above 20 years
    • Below 12 years
  • User experience
    • Active experiences
    • Interactive experiences
    • Passive experiences
    • Themed experiences
    • Educational experiences
  • Geography
    • North America
      • US
      • Canada
      • Mexico
    • Europe
      • Germany
      • France
      • UK
    • APAC
      • China
      • Japan
      • India
    • South America
      • Brazil
      • Argentina
    • Middle East and Africa
      • UAE
      • Saudi Arabia
      • South Africa
    • Rest of World (ROW)

By Type Insights

The entertainment segment is estimated to witness significant growth during the forecast period.

The entertainment segment is defined by a curated value chain focused on content creation, distribution, and spectatorial consumption. This includes everything from motion pictures to live theater, where success hinges on compelling intellectual property and sophisticated multichannel distribution strategies.

This market is shifting from transactional models to recurring revenue streams, driven by new guest experience technology. Advanced immersive experience design and augmented reality overlays are being used to enhance passive viewing.

The application of dynamic pricing algorithms helps manage demand, with data showing that optimized strategies can improve yield by over 7% without negatively impacting volume.

Operators of family entertainment centers (fecs) and providers of cinema exhibition technology use contactless payment integration to improve throughput within this spectatorial, semi-passive form of engagement.

Request Free Sample

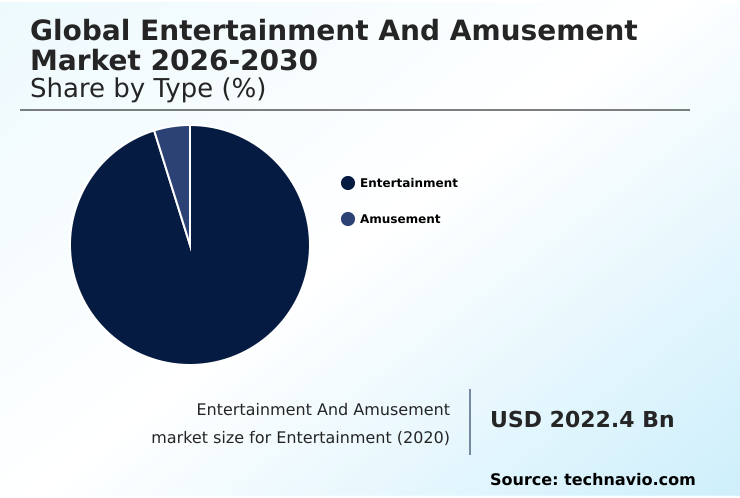
The Entertainment segment was valued at USD 2615.4 billion in 2024 and showed a gradual increase during the forecast period.

Request Free Sample

Regional Analysis

North America is estimated to contribute 59.8% to the growth of the global market during the forecast period.Technavio’s analysts have elaborately explained the regional trends and drivers that shape the market during the forecast period.

See How Entertainment And Amusement Market Demand is Rising in North America Request Free Sample

Geographically, the market shows varied maturity and growth trajectories, with North America poised to contribute nearly 60% of the incremental growth. This is driven by high consumer spending and significant investments in live entertainment production and theatrical lighting design.

The region's focus on special effects engineering and audio-visual integration for both new and existing attractions maintains its leadership.

Meanwhile, the APAC region, with the highest regional CAGR of 8.2%, demonstrates rapid adoption of mobile ticketing systems and biometric access control. This mobile-first environment accelerates the deployment of digital marketing for attractions and innovative brand integration strategies.

In Europe, a focus on sustainability and cultural integration shapes development, impacting everything from sponsorship and partnership models to workforce management solutions.

Market Dynamics

Our researchers analyzed the data with 2025 as the base year, along with the key drivers, trends, and challenges. A holistic analysis of drivers will help companies refine their marketing strategies to gain a competitive advantage.

  • Strategic decision-making in the current market requires a deep analysis of several key questions. Stakeholders are evaluating the impact of ip integration on theme park attendance and calculating the roi of virtual reality in amusement parks. A critical focus is on strategies for reducing operational costs in theme parks and deploying technology for enhancing guest personalization.
  • The financial modeling of comparing pay-per-ride vs all-inclusive pricing is a constant debate, alongside monitoring trends in sustainable amusement park development. Operationally, leveraging data analytics for guest flow optimization is now standard practice, though many still face challenges of integrating ar into existing parks.
  • Marketing teams are refining best practices for social media engagement, understanding that the role of storytelling in attraction design is paramount. In parallel, the evolution of cinema experience post-streaming continues, fueled by growth drivers for location-based vr. Examining the future of interactive and immersive art and comparing regional vs destination park models inform long-term investment.
  • These considerations are underpinned by rigorous safety standards in modern ride engineering.
  • Furthermore, the importance of integrating f&b into the overall park experience, building effective loyalty programs for attractions, and crafting unique marketing strategies for family entertainment centers are key to overcoming issues like managing seasonality in the amusement industry, where the role of live entertainment in theme parks becomes a significant differentiator, boosting off-peak traffic by over 15% compared to parks without such offerings.

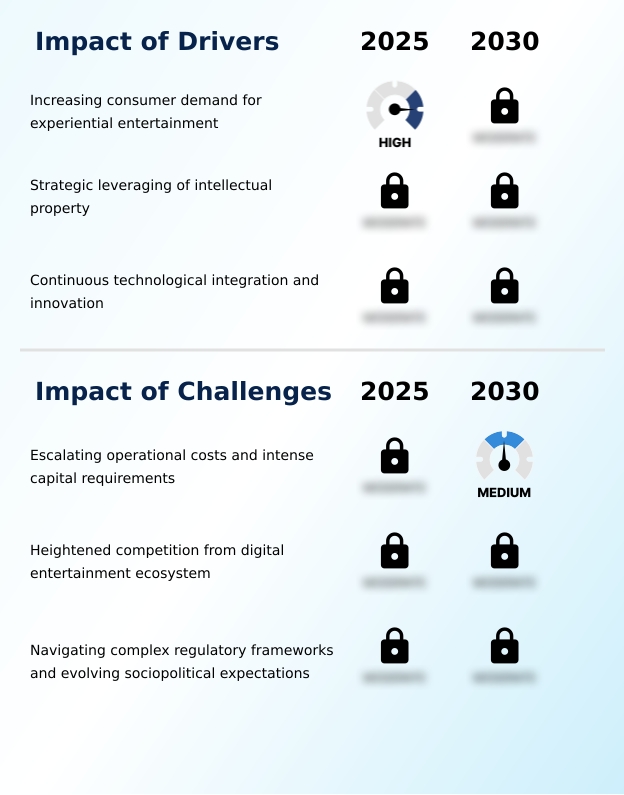
What are the key market drivers leading to the rise in the adoption of Entertainment And Amusement Industry?

  • The market's primary driver is the increasing consumer demand for experiential entertainment, which prioritizes memorable activities over the acquisition of material goods.

  • The market is propelled by the consumer economy's shift toward memorable experiences, demanding more than passive observation. Modern consumers seek active participation, driving development in gamification mechanics and personalized content delivery.
  • This has spurred investment in attractions that are more complex and story-driven, utilizing everything from advanced dark ride systems to multi-sensory stimulation. The strategic imperative for providers of motion-based simulators and 4d theater technology is to curate holistic environments.
  • The goal is to transform a simple visit into an immersive adventure, fostering deeper brand connection and encouraging higher spend on experiential retail concepts, with some venues seeing a 20% lift in ancillary revenue through integrated experience strategies.

What are the market trends shaping the Entertainment And Amusement Industry?

  • The ascendancy of hyper-personalized and immersive experiences is a defining trend, pushing the industry from standardized offerings toward unique, individually resonant consumer engagements.

  • A defining trend is the pivot toward deeply personalized engagement, leveraging technology to craft unique consumer journeys. The deployment of virtual reality attractions and advanced show control systems is central to this movement, enabling unprecedented levels of immersion. This shift necessitates investment in infrastructures for interactive narrative design, moving beyond passive spectatorship.
  • For operators of destination resorts and social entertainment venues, this means integrating new hardware and data science capabilities. The focus is on creating distinct, shareable moments through sophisticated intellectual property (ip) licensing and water park slide technology, ensuring repeat visitation.
  • Success in this area is measured by a more than 15% increase in guest satisfaction scores for personalized experiences versus generic offerings.

What challenges does the Entertainment And Amusement Industry face during its growth?

  • A key industry challenge is the combination of escalating operational costs and the intense capital requirements necessary to remain competitive and innovative.

  • A primary challenge is the relentless escalation of operational expenditures coupled with immense capital requirements. The resource-intensive nature of location-based entertainment is amplified by rising labor costs and supply chain volatility affecting everything from food and beverage management to predictive maintenance systems.
  • The technological arms race, requiring continuous investment in high-throughput attractions and customer relationship management (crm) systems, puts immense pressure on balance sheets. Operators of marine life parks and those involved in roller coaster design face high barriers to entry and the need for constant innovation.
  • Managing this dual pressure of rising daily costs and massive capital demands for sustainable park operations, with some projects seeing budgets overrun by up to 25%, is a critical strategic test for operators.

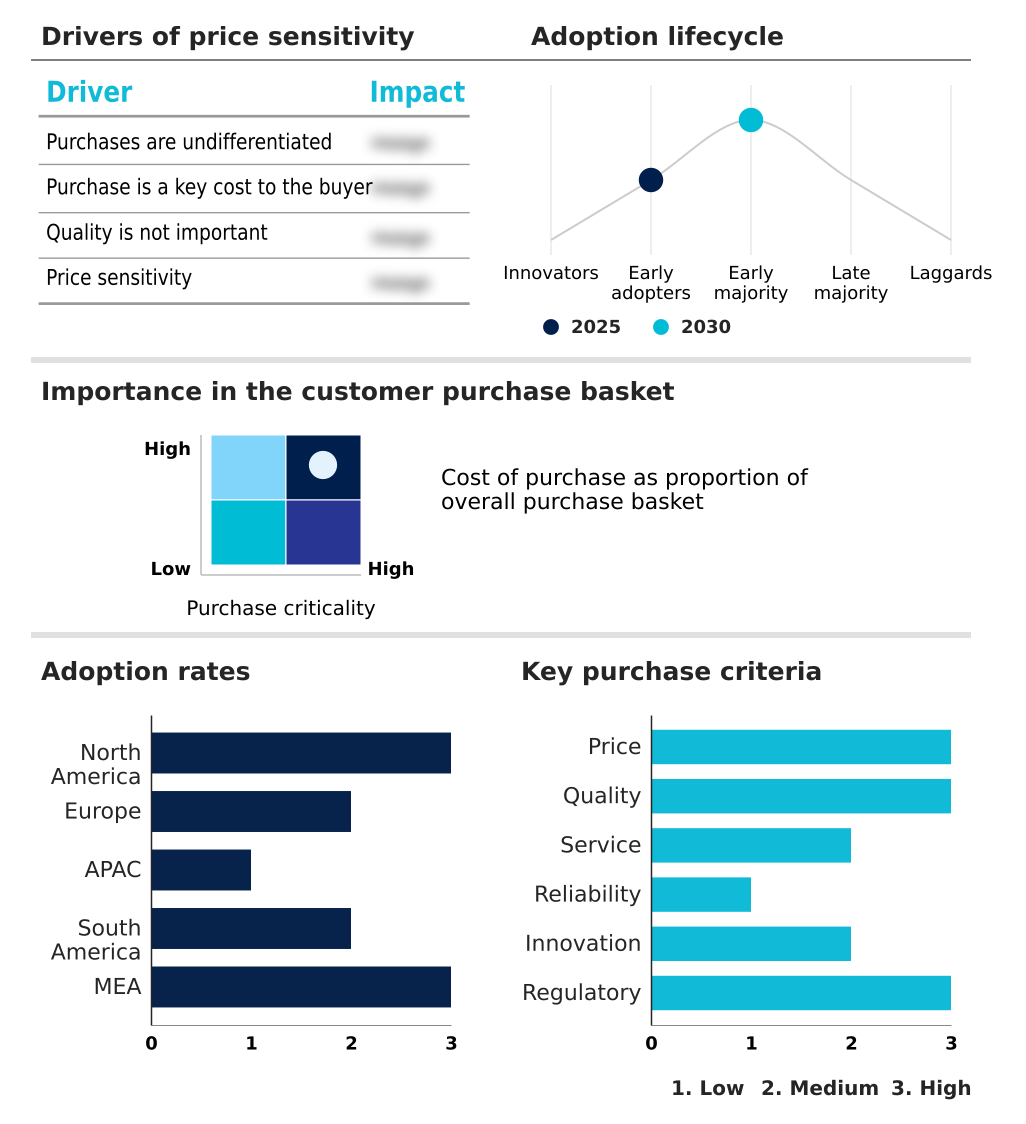
Exclusive Technavio Analysis on Customer Landscape

The entertainment and amusement market forecasting report includes the adoption lifecycle of the market, covering from the innovator’s stage to the laggard’s stage. It focuses on adoption rates in different regions based on penetration. Furthermore, the entertainment and amusement market report also includes key purchase criteria and drivers of price sensitivity to help companies evaluate and develop their market growth analysis strategies.

Customer Landscape of Entertainment And Amusement Industry

Competitive Landscape

Companies are implementing various strategies, such as strategic alliances, entertainment and amusement market forecast, partnerships, mergers and acquisitions, geographical expansion, and product/service launches, to enhance their presence in the industry.

AMC Entertainment Holdings Inc. - Analysis indicates a portfolio of entertainment and amusement offerings, including cinema exhibition, integrated theme parks, and location-based entertainment.

The industry research and growth report includes detailed analyses of the competitive landscape of the market and information about key companies, including:

  • AMC Entertainment Holdings Inc.
  • Bowlero Corp.
  • Chimelong Group Co. Ltd.
  • Cinemark Holdings Inc.
  • Cirque du Soleil Entertainment
  • Comcast Corp.
  • Dave and Busters Entertainment
  • Herschend Family Entertainment
  • Meow Wolf
  • Merlin Entertainments Ltd.
  • Parques Reunidos SAU
  • Raw Thrills Inc.
  • Regal Entertainment Group
  • Six Flags Entertainment Corp.
  • The Walt Disney Co.
  • Topgolf International Inc
  • Trio Tech International Pte Ltd
  • United Parks and Resorts Inc.
  • Vail Resorts Inc
  • WhiteWater West Industries Ltd

Qualitative and quantitative analysis of companies has been conducted to help clients understand the wider business environment as well as the strengths and weaknesses of key industry players. Data is qualitatively analyzed to categorize companies as pure play, category-focused, industry-focused, and diversified; it is quantitatively analyzed to categorize companies as dominant, leading, strong, tentative, and weak.

Recent Development and News in Entertainment and amusement market

  • In January 2025, the operators of Shanghai Jinjiang Action Park announced strategic plans to redevelop the park into a premier destination centered on the Harry Potter intellectual property.
  • In March 2025, Herschend Family Entertainment finalized its acquisition of more than twenty US-based amusement properties from Parques Reunidos, significantly expanding its portfolio and market presence in North America.
  • In November 2024, Comcast Corp. announced a strategic partnership with a leading technology firm to develop and integrate park-wide augmented reality experiences across its Universal theme parks, enhancing its guest experience offerings.
  • In May 2025, Six Flags Entertainment Corp. launched a comprehensive corporate sustainability initiative focused on reducing the environmental impact across all its properties, committing to new standards for park operations.

Dive into Technavio’s robust research methodology, blending expert interviews, extensive data synthesis, and validated models for unparalleled Entertainment And Amusement Market insights. See full methodology.

Market Scope
Page number 296
Base year 2025
Historic period 2020-2024
Forecast period 2026-2030
Growth momentum & CAGR Accelerate at a CAGR of 7.4%
Market growth 2026-2030 USD 1241.8 billion
Market structure Fragmented
YoY growth 2025-2026(%) 7.1%
Key countries US, Canada, Mexico, Germany, France, UK, Spain, Italy, The Netherlands, China, Japan, India, South Korea, Australia, Indonesia, Brazil, Argentina, Chile, UAE, Saudi Arabia, South Africa, Egypt and Israel
Competitive landscape Leading Companies, Market Positioning of Companies, Competitive Strategies, and Industry Risks

Request Free Sample

Research Analyst Overview

  • The entertainment and amusement market is undergoing a technical renaissance, driven by innovations in immersive experience design and guest experience technology. Advanced park management software now incorporates predictive maintenance systems and real-time data analytics for superior guest flow management and queue management technology.
  • The integration of augmented reality overlays, virtual reality attractions, and detailed animatronics programming is central to modern themed environment design. Success hinges on sophisticated ride system engineering, including dark ride systems and water park slide technology, governed by precise show control systems.
  • Behind the scenes, dynamic pricing algorithms and mobile ticketing systems, along with contactless payment integration and biometric access control, are streamlining operations. Strategic intellectual property (ip) licensing fuels personalized content delivery through complex gamification mechanics, while theatrical lighting design, special effects engineering, and audio-visual integration create multi-sensory stimulation for live entertainment production and experiential retail concepts.
  • Firms are focusing on sustainable park operations, high-throughput attractions, loyalty program management, and robust customer relationship management (crm) supported by digital wayfinding solutions to define the future of interactive narrative design.

What are the Key Data Covered in this Entertainment And Amusement Market Research and Growth Report?

  • What is the expected growth of the Entertainment And Amusement Market between 2026 and 2030?

    • USD 1241.8 billion, at a CAGR of 7.4%

  • What segmentation does the market report cover?

    • The report is segmented by Type (Entertainment, and Amusement), Age Group (13 to 20 years, Above 20 years, and Below 12 years), User Experience (Active experiences, Interactive experiences, Passive experiences, Themed experiences, and Educational experiences) and Geography (North America, Europe, APAC, South America, Middle East and Africa)

  • Which regions are analyzed in the report?

    • North America, Europe, APAC, South America and Middle East and Africa

  • What are the key growth drivers and market challenges?

    • Increasing consumer demand for experiential entertainment, Escalating operational costs and intense capital requirements

  • Who are the major players in the Entertainment And Amusement Market?

    • AMC Entertainment Holdings Inc., Bowlero Corp., Chimelong Group Co. Ltd., Cinemark Holdings Inc., Cirque du Soleil Entertainment, Comcast Corp., Dave and Busters Entertainment, Herschend Family Entertainment, Meow Wolf, Merlin Entertainments Ltd., Parques Reunidos SAU, Raw Thrills Inc., Regal Entertainment Group, Six Flags Entertainment Corp., The Walt Disney Co., Topgolf International Inc, Trio Tech International Pte Ltd, United Parks and Resorts Inc., Vail Resorts Inc and WhiteWater West Industries Ltd

Market Research Insights

  • The market's dynamism is evident across diverse segments, from regional theme parks and destination resorts to specialized family entertainment centers (fecs) and social entertainment venues. Innovations in cinema exhibition technology and premium large format (plf) cinema are reshaping movie-going, while bowling entertainment centers and arcade game manufacturing cater to interactive social demand.
  • Visitor attraction management now encompasses everything from marine life parks and ski resort operations to immersive art installations and indoor water parks. The ecosystem relies on roller coaster design, water slide manufacturing, and the technology for interactive dark rides and 4d theater technology.
  • Core business functions include strategic food and beverage management, retail merchandising strategy, and workforce management solutions, all governed by stringent guest safety protocols and ride inspection and certification.
  • Successful brand integration strategies, digital marketing for attractions, and sponsorship and partnership models are crucial, alongside seasonal event planning and efficient ticketing and admission systems, all while considering the overall environmental impact assessment of live circus production and motion-based simulators.
  • Adoption of integrated systems has led to a 10% increase in operational efficiency in some regional parks compared to those using disparate platforms.

We can help! Our analysts can customize this entertainment and amusement market research report to meet your requirements.

Get in touch

1. Executive Summary

1.1 Market overview

Executive Summary - Chart on Market Overview
Executive Summary - Data Table on Market Overview
Executive Summary - Chart on Global Market Characteristics
Executive Summary - Chart on Market by Geography
Executive Summary - Chart on Market Segmentation by Type
Executive Summary - Chart on Market Segmentation by Age Group
Executive Summary - Chart on Market Segmentation by User Experience
Executive Summary - Chart on Incremental Growth
Executive Summary - Data Table on Incremental Growth
Executive Summary - Chart on Company Market Positioning

2. Technavio Analysis

2.1 Analysis of price sensitivity, lifecycle, customer purchase basket, adoption rates, and purchase criteria

2.2 Criticality of inputs and Factors of differentiation

Chart on Overview on criticality of inputs and factors of differentiation

2.3 Factors of disruption

Chart on Overview on factors of disruption

2.4 Impact of drivers and challenges

Chart on Impact of drivers and challenges in 2025 and 2030

3. Market Landscape

3.1 Market ecosystem

Chart on Parent Market
Data Table on - Parent Market

3.2 Market characteristics

Chart on Market characteristics analysis

3.3 Value chain analysis

Chart on Value chain analysis

4. Market Sizing

4.1 Market definition

Data Table on Offerings of companies included in the market definition

4.2 Market segment analysis

Market segments

4.3 Market size 2025

4.4 Market outlook: Forecast for 2025-2030

Chart on Global - Market size and forecast 2025-2030 ($ billion)
Data Table on Global - Market size and forecast 2025-2030 ($ billion)
Chart on Global Market: Year-over-year growth 2025-2030 (%)
Data Table on Global Market: Year-over-year growth 2025-2030 (%)

5. Historic Market Size

5.1 Global Entertainment And Amusement Market 2020 - 2024

Historic Market Size - Data Table on Global Entertainment And Amusement Market 2020 - 2024 ($ billion)

5.2 Type segment analysis 2020 - 2024

Historic Market Size - Type Segment 2020 - 2024 ($ billion)

5.3 Age Group segment analysis 2020 - 2024

Historic Market Size - Age Group Segment 2020 - 2024 ($ billion)

5.4 User Experience segment analysis 2020 - 2024

Historic Market Size - User Experience Segment 2020 - 2024 ($ billion)

5.5 Geography segment analysis 2020 - 2024

Historic Market Size - Geography Segment 2020 - 2024 ($ billion)

5.6 Country segment analysis 2020 - 2024

Historic Market Size - Country Segment 2020 - 2024 ($ billion)

6. Qualitative Analysis

6.1 Impact of AI on global entertainment and amusement market

6.2 Impact of geopolitical conflicts on global entertainment and amusement market

7. Five Forces Analysis

7.1 Five forces summary

Five forces analysis - Comparison between 2025 and 2030

7.2 Bargaining power of buyers

Bargaining power of buyers - Impact of key factors 2025 and 2030

7.3 Bargaining power of suppliers

Bargaining power of suppliers - Impact of key factors in 2025 and 2030

7.4 Threat of new entrants

Threat of new entrants - Impact of key factors in 2025 and 2030

7.5 Threat of substitutes

Threat of substitutes - Impact of key factors in 2025 and 2030

7.6 Threat of rivalry

Threat of rivalry - Impact of key factors in 2025 and 2030

7.7 Market condition

Chart on Market condition - Five forces 2025 and 2030

8. Market Segmentation by Type

8.1 Market segments

Chart on Type - Market share 2025-2030 (%)
Data Table on Type - Market share 2025-2030 (%)

8.2 Comparison by Type

Chart on Comparison by Type
Data Table on Comparison by Type

8.3 Entertainment - Market size and forecast 2025-2030

Chart on Entertainment - Market size and forecast 2025-2030 ($ billion)
Data Table on Entertainment - Market size and forecast 2025-2030 ($ billion)
Chart on Entertainment - Year-over-year growth 2025-2030 (%)
Data Table on Entertainment - Year-over-year growth 2025-2030 (%)

8.4 Amusement - Market size and forecast 2025-2030

Chart on Amusement - Market size and forecast 2025-2030 ($ billion)
Data Table on Amusement - Market size and forecast 2025-2030 ($ billion)
Chart on Amusement - Year-over-year growth 2025-2030 (%)
Data Table on Amusement - Year-over-year growth 2025-2030 (%)

8.5 Market opportunity by Type

Market opportunity by Type ($ billion)
Data Table on Market opportunity by Type ($ billion)

9. Market Segmentation by Age Group

9.1 Market segments

Chart on Age Group - Market share 2025-2030 (%)
Data Table on Age Group - Market share 2025-2030 (%)

9.2 Comparison by Age Group

Chart on Comparison by Age Group
Data Table on Comparison by Age Group

9.3 13 to 20 years - Market size and forecast 2025-2030

Chart on 13 to 20 years - Market size and forecast 2025-2030 ($ billion)
Data Table on 13 to 20 years - Market size and forecast 2025-2030 ($ billion)
Chart on 13 to 20 years - Year-over-year growth 2025-2030 (%)
Data Table on 13 to 20 years - Year-over-year growth 2025-2030 (%)

9.4 Above 20 years - Market size and forecast 2025-2030

Chart on Above 20 years - Market size and forecast 2025-2030 ($ billion)
Data Table on Above 20 years - Market size and forecast 2025-2030 ($ billion)
Chart on Above 20 years - Year-over-year growth 2025-2030 (%)
Data Table on Above 20 years - Year-over-year growth 2025-2030 (%)

9.5 Below 12 years - Market size and forecast 2025-2030

Chart on Below 12 years - Market size and forecast 2025-2030 ($ billion)
Data Table on Below 12 years - Market size and forecast 2025-2030 ($ billion)
Chart on Below 12 years - Year-over-year growth 2025-2030 (%)
Data Table on Below 12 years - Year-over-year growth 2025-2030 (%)

9.6 Market opportunity by Age Group

Market opportunity by Age Group ($ billion)
Data Table on Market opportunity by Age Group ($ billion)

10. Market Segmentation by User Experience

10.1 Market segments

Chart on Market Segmentation by User Experience - Market share 2025-2030 (%)
Data Table on Market Segmentation by User Experience - Market share 2025-2030 (%)

10.2 Comparison by Market Segmentation by User Experience

Chart on Comparison by Market Segmentation by User Experience
Data Table on Comparison by Market Segmentation by User Experience

10.3 Active experiences - Market size and forecast 2025-2030

Chart on Active experiences - Market size and forecast 2025-2030 ($ billion)
Data Table on Active experiences - Market size and forecast 2025-2030 ($ billion)
Chart on Active experiences - Year-over-year growth 2025-2030 (%)
Data Table on Active experiences - Year-over-year growth 2025-2030 (%)

10.4 Interactive experiences - Market size and forecast 2025-2030

Chart on Interactive experiences - Market size and forecast 2025-2030 ($ billion)
Data Table on Interactive experiences - Market size and forecast 2025-2030 ($ billion)
Chart on Interactive experiences - Year-over-year growth 2025-2030 (%)
Data Table on Interactive experiences - Year-over-year growth 2025-2030 (%)

10.5 Passive experiences - Market size and forecast 2025-2030

Chart on Passive experiences - Market size and forecast 2025-2030 ($ billion)
Data Table on Passive experiences - Market size and forecast 2025-2030 ($ billion)
Chart on Passive experiences - Year-over-year growth 2025-2030 (%)
Data Table on Passive experiences - Year-over-year growth 2025-2030 (%)

10.6 Themed experiences - Market size and forecast 2025-2030

Chart on Themed experiences - Market size and forecast 2025-2030 ($ billion)
Data Table on Themed experiences - Market size and forecast 2025-2030 ($ billion)
Chart on Themed experiences - Year-over-year growth 2025-2030 (%)
Data Table on Themed experiences - Year-over-year growth 2025-2030 (%)

10.7 Educational experiences - Market size and forecast 2025-2030

Chart on Educational experiences - Market size and forecast 2025-2030 ($ billion)
Data Table on Educational experiences - Market size and forecast 2025-2030 ($ billion)
Chart on Educational experiences - Year-over-year growth 2025-2030 (%)
Data Table on Educational experiences - Year-over-year growth 2025-2030 (%)

10.8 Market opportunity by Market Segmentation by User Experience

Market opportunity by Market Segmentation by User Experience ($ billion)
Data Table on Market opportunity by Market Segmentation by User Experience ($ billion)

11. Customer Landscape

11.1 Customer landscape overview

Analysis of price sensitivity, lifecycle, customer purchase basket, adoption rates, and purchase criteria

12. Geographic Landscape

12.1 Geographic segmentation

Chart on Market share by geography 2025-2030 (%)
Data Table on Market share by geography 2025-2030 (%)

12.2 Geographic comparison

Chart on Geographic comparison
Data Table on Geographic comparison

12.3 North America - Market size and forecast 2025-2030

Chart on North America - Market size and forecast 2025-2030 ($ billion)
Data Table on North America - Market size and forecast 2025-2030 ($ billion)
Chart on North America - Year-over-year growth 2025-2030 (%)
Data Table on North America - Year-over-year growth 2025-2030 (%)
Chart on Regional Comparison - North America
Data Table on Regional Comparison - North America

12.3.1 US - Market size and forecast 2025-2030

Chart on US - Market size and forecast 2025-2030 ($ billion)
Data Table on US - Market size and forecast 2025-2030 ($ billion)
Chart on US - Year-over-year growth 2025-2030 (%)
Data Table on US - Year-over-year growth 2025-2030 (%)

12.3.2 Canada - Market size and forecast 2025-2030

Chart on Canada - Market size and forecast 2025-2030 ($ billion)
Data Table on Canada - Market size and forecast 2025-2030 ($ billion)
Chart on Canada - Year-over-year growth 2025-2030 (%)
Data Table on Canada - Year-over-year growth 2025-2030 (%)

12.3.3 Mexico - Market size and forecast 2025-2030

Chart on Mexico - Market size and forecast 2025-2030 ($ billion)
Data Table on Mexico - Market size and forecast 2025-2030 ($ billion)
Chart on Mexico - Year-over-year growth 2025-2030 (%)
Data Table on Mexico - Year-over-year growth 2025-2030 (%)

12.4 Europe - Market size and forecast 2025-2030

Chart on Europe - Market size and forecast 2025-2030 ($ billion)
Data Table on Europe - Market size and forecast 2025-2030 ($ billion)
Chart on Europe - Year-over-year growth 2025-2030 (%)
Data Table on Europe - Year-over-year growth 2025-2030 (%)
Chart on Regional Comparison - Europe
Data Table on Regional Comparison - Europe

12.4.1 Germany - Market size and forecast 2025-2030

Chart on Germany - Market size and forecast 2025-2030 ($ billion)
Data Table on Germany - Market size and forecast 2025-2030 ($ billion)
Chart on Germany - Year-over-year growth 2025-2030 (%)
Data Table on Germany - Year-over-year growth 2025-2030 (%)

12.4.2 France - Market size and forecast 2025-2030

Chart on France - Market size and forecast 2025-2030 ($ billion)
Data Table on France - Market size and forecast 2025-2030 ($ billion)
Chart on France - Year-over-year growth 2025-2030 (%)
Data Table on France - Year-over-year growth 2025-2030 (%)

12.4.3 UK - Market size and forecast 2025-2030

Chart on UK - Market size and forecast 2025-2030 ($ billion)
Data Table on UK - Market size and forecast 2025-2030 ($ billion)
Chart on UK - Year-over-year growth 2025-2030 (%)
Data Table on UK - Year-over-year growth 2025-2030 (%)

12.4.4 Spain - Market size and forecast 2025-2030

Chart on Spain - Market size and forecast 2025-2030 ($ billion)
Data Table on Spain - Market size and forecast 2025-2030 ($ billion)
Chart on Spain - Year-over-year growth 2025-2030 (%)
Data Table on Spain - Year-over-year growth 2025-2030 (%)

12.4.5 Italy - Market size and forecast 2025-2030

Chart on Italy - Market size and forecast 2025-2030 ($ billion)
Data Table on Italy - Market size and forecast 2025-2030 ($ billion)
Chart on Italy - Year-over-year growth 2025-2030 (%)
Data Table on Italy - Year-over-year growth 2025-2030 (%)

12.4.6 The Netherlands - Market size and forecast 2025-2030

Chart on The Netherlands - Market size and forecast 2025-2030 ($ billion)
Data Table on The Netherlands - Market size and forecast 2025-2030 ($ billion)
Chart on The Netherlands - Year-over-year growth 2025-2030 (%)
Data Table on The Netherlands - Year-over-year growth 2025-2030 (%)

12.5 APAC - Market size and forecast 2025-2030

Chart on APAC - Market size and forecast 2025-2030 ($ billion)
Data Table on APAC - Market size and forecast 2025-2030 ($ billion)
Chart on APAC - Year-over-year growth 2025-2030 (%)
Data Table on APAC - Year-over-year growth 2025-2030 (%)
Chart on Regional Comparison - APAC
Data Table on Regional Comparison - APAC

12.5.1 China - Market size and forecast 2025-2030

Chart on China - Market size and forecast 2025-2030 ($ billion)
Data Table on China - Market size and forecast 2025-2030 ($ billion)
Chart on China - Year-over-year growth 2025-2030 (%)
Data Table on China - Year-over-year growth 2025-2030 (%)

12.5.2 Japan - Market size and forecast 2025-2030

Chart on Japan - Market size and forecast 2025-2030 ($ billion)
Data Table on Japan - Market size and forecast 2025-2030 ($ billion)
Chart on Japan - Year-over-year growth 2025-2030 (%)
Data Table on Japan - Year-over-year growth 2025-2030 (%)

12.5.3 India - Market size and forecast 2025-2030

Chart on India - Market size and forecast 2025-2030 ($ billion)
Data Table on India - Market size and forecast 2025-2030 ($ billion)
Chart on India - Year-over-year growth 2025-2030 (%)
Data Table on India - Year-over-year growth 2025-2030 (%)

12.5.4 South Korea - Market size and forecast 2025-2030

Chart on South Korea - Market size and forecast 2025-2030 ($ billion)
Data Table on South Korea - Market size and forecast 2025-2030 ($ billion)
Chart on South Korea - Year-over-year growth 2025-2030 (%)
Data Table on South Korea - Year-over-year growth 2025-2030 (%)

12.5.5 Australia - Market size and forecast 2025-2030

Chart on Australia - Market size and forecast 2025-2030 ($ billion)
Data Table on Australia - Market size and forecast 2025-2030 ($ billion)
Chart on Australia - Year-over-year growth 2025-2030 (%)
Data Table on Australia - Year-over-year growth 2025-2030 (%)

12.5.6 Indonesia - Market size and forecast 2025-2030

Chart on Indonesia - Market size and forecast 2025-2030 ($ billion)
Data Table on Indonesia - Market size and forecast 2025-2030 ($ billion)
Chart on Indonesia - Year-over-year growth 2025-2030 (%)
Data Table on Indonesia - Year-over-year growth 2025-2030 (%)

12.6 South America - Market size and forecast 2025-2030

Chart on South America - Market size and forecast 2025-2030 ($ billion)
Data Table on South America - Market size and forecast 2025-2030 ($ billion)
Chart on South America - Year-over-year growth 2025-2030 (%)
Data Table on South America - Year-over-year growth 2025-2030 (%)
Chart on Regional Comparison - South America
Data Table on Regional Comparison - South America

12.6.1 Brazil - Market size and forecast 2025-2030

Chart on Brazil - Market size and forecast 2025-2030 ($ billion)
Data Table on Brazil - Market size and forecast 2025-2030 ($ billion)
Chart on Brazil - Year-over-year growth 2025-2030 (%)
Data Table on Brazil - Year-over-year growth 2025-2030 (%)

12.6.2 Argentina - Market size and forecast 2025-2030

Chart on Argentina - Market size and forecast 2025-2030 ($ billion)
Data Table on Argentina - Market size and forecast 2025-2030 ($ billion)
Chart on Argentina - Year-over-year growth 2025-2030 (%)
Data Table on Argentina - Year-over-year growth 2025-2030 (%)

12.6.3 Chile - Market size and forecast 2025-2030

Chart on Chile - Market size and forecast 2025-2030 ($ billion)
Data Table on Chile - Market size and forecast 2025-2030 ($ billion)
Chart on Chile - Year-over-year growth 2025-2030 (%)
Data Table on Chile - Year-over-year growth 2025-2030 (%)

12.7 Middle East and Africa - Market size and forecast 2025-2030

Chart on Middle East and Africa - Market size and forecast 2025-2030 ($ billion)
Data Table on Middle East and Africa - Market size and forecast 2025-2030 ($ billion)
Chart on Middle East and Africa - Year-over-year growth 2025-2030 (%)
Data Table on Middle East and Africa - Year-over-year growth 2025-2030 (%)
Chart on Regional Comparison - Middle East and Africa
Data Table on Regional Comparison - Middle East and Africa

12.7.1 UAE - Market size and forecast 2025-2030

Chart on UAE - Market size and forecast 2025-2030 ($ billion)
Data Table on UAE - Market size and forecast 2025-2030 ($ billion)
Chart on UAE - Year-over-year growth 2025-2030 (%)
Data Table on UAE - Year-over-year growth 2025-2030 (%)

12.7.2 Saudi Arabia - Market size and forecast 2025-2030

Chart on Saudi Arabia - Market size and forecast 2025-2030 ($ billion)
Data Table on Saudi Arabia - Market size and forecast 2025-2030 ($ billion)
Chart on Saudi Arabia - Year-over-year growth 2025-2030 (%)
Data Table on Saudi Arabia - Year-over-year growth 2025-2030 (%)

12.7.3 South Africa - Market size and forecast 2025-2030

Chart on South Africa - Market size and forecast 2025-2030 ($ billion)
Data Table on South Africa - Market size and forecast 2025-2030 ($ billion)
Chart on South Africa - Year-over-year growth 2025-2030 (%)
Data Table on South Africa - Year-over-year growth 2025-2030 (%)

12.7.4 Egypt - Market size and forecast 2025-2030

Chart on Egypt - Market size and forecast 2025-2030 ($ billion)
Data Table on Egypt - Market size and forecast 2025-2030 ($ billion)
Chart on Egypt - Year-over-year growth 2025-2030 (%)
Data Table on Egypt - Year-over-year growth 2025-2030 (%)

12.7.5 Israel - Market size and forecast 2025-2030

Chart on Israel - Market size and forecast 2025-2030 ($ billion)
Data Table on Israel - Market size and forecast 2025-2030 ($ billion)
Chart on Israel - Year-over-year growth 2025-2030 (%)
Data Table on Israel - Year-over-year growth 2025-2030 (%)

12.8 Market opportunity by geography

Market opportunity by geography ($ billion)
Data Tables on Market opportunity by geography ($ billion)

13. Drivers, Challenges, and Opportunity

13.1 Market drivers

Increasing consumer demand for experiential entertainment
Strategic leveraging of intellectual property
Continuous technological integration and innovation

13.2 Market challenges

Escalating operational costs and intense capital requirements
Heightened competition from digital entertainment ecosystem
Navigating complex regulatory frameworks and evolving sociopolitical expectations

13.3 Impact of drivers and challenges

Impact of drivers and challenges in 2025 and 2030

13.4 Market opportunities

Ascendancy of hyper-personalized and immersive experiences
Convergence of physical and digital realms in location-based entertainment
Strategic imperative of sustainability and purpose-driven operations

14. Competitive Landscape

14.1 Overview

14.2

Overview on criticality of inputs and factors of differentiation

14.3 Landscape disruption

Overview on factors of disruption

14.4 Industry risks

Impact of key risks on business

15. Competitive Analysis

15.1 Companies profiled

Companies covered

15.2 Company ranking index

15.3 Market positioning of companies

Matrix on companies position and classification

15.4 AMC Entertainment Holdings Inc.

AMC Entertainment Holdings Inc. - Overview
AMC Entertainment Holdings Inc. - Business segments
AMC Entertainment Holdings Inc. - Key offerings
AMC Entertainment Holdings Inc. - Segment focus
SWOT

15.5 Bowlero Corp.

Bowlero Corp. - Overview
Bowlero Corp. - Product / Service
Bowlero Corp. - Key offerings
SWOT

15.6 Chimelong Group Co. Ltd.

Chimelong Group Co. Ltd. - Overview
Chimelong Group Co. Ltd. - Product / Service
Chimelong Group Co. Ltd. - Key offerings
SWOT

15.7 Cinemark Holdings Inc.

Cinemark Holdings Inc. - Overview
Cinemark Holdings Inc. - Business segments
Cinemark Holdings Inc. - Key offerings
Cinemark Holdings Inc. - Segment focus
SWOT

15.8 Cirque du Soleil Entertainment

Cirque du Soleil Entertainment - Overview
Cirque du Soleil Entertainment - Product / Service
Cirque du Soleil Entertainment - Key offerings
SWOT

15.9 Comcast Corp.

Comcast Corp. - Overview
Comcast Corp. - Business segments
Comcast Corp. - Key news
Comcast Corp. - Key offerings
Comcast Corp. - Segment focus
SWOT

15.10 Dave and Busters Entertainment

Dave and Busters Entertainment - Overview
Dave and Busters Entertainment - Product / Service
Dave and Busters Entertainment - Key offerings
SWOT

15.11 Herschend Family Entertainment

Herschend Family Entertainment - Overview
Herschend Family Entertainment - Product / Service
Herschend Family Entertainment - Key offerings
SWOT

15.12 Merlin Entertainments Ltd.

Merlin Entertainments Ltd. - Overview
Merlin Entertainments Ltd. - Product / Service
Merlin Entertainments Ltd. - Key offerings
SWOT

15.13 Parques Reunidos SAU

Parques Reunidos SAU - Overview
Parques Reunidos SAU - Product / Service
Parques Reunidos SAU - Key offerings
SWOT

15.14 Regal Entertainment Group

Regal Entertainment Group - Overview
Regal Entertainment Group - Product / Service
Regal Entertainment Group - Key offerings
SWOT

15.15 Six Flags Entertainment Corp.

Six Flags Entertainment Corp. - Overview
Six Flags Entertainment Corp. - Product / Service
Six Flags Entertainment Corp. - Key offerings
SWOT

15.16 The Walt Disney Co.

The Walt Disney Co. - Overview
The Walt Disney Co. - Business segments
The Walt Disney Co. - Key offerings
The Walt Disney Co. - Segment focus
SWOT

15.17 Trio Tech International Pte Ltd

Trio Tech International Pte Ltd - Overview
Trio Tech International Pte Ltd - Product / Service
Trio Tech International Pte Ltd - Key offerings
SWOT

15.18 United Parks and Resorts Inc.

United Parks and Resorts Inc. - Overview
United Parks and Resorts Inc. - Product / Service
United Parks and Resorts Inc. - Key offerings
SWOT

16. Appendix

16.1 Scope of the report

Market definition
Objectives
Notes and caveats

16.2 Inclusions and exclusions checklist

Inclusions checklist
Exclusions checklist

16.3 Currency conversion rates for US$

16.4 Research methodology

16.5 Data procurement

Information sources

16.6 Data validation

16.7 Validation techniques employed for market sizing

16.8 Data synthesis

16.9 360 degree market analysis

16.10 List of abbreviations

Research Methodology

Technavio presents a detailed picture of the market by way of study, synthesis, and summation of data from multiple sources. The analysts have presented the various facets of the market with a particular focus on identifying the key industry influencers. The data thus presented is comprehensive, reliable, and the result of extensive research, both primary and secondary.

INFORMATION SOURCES

Primary sources

  • Manufacturers and suppliers
  • Channel partners
  • Industry experts
  • Strategic decision makers

Secondary sources

  • Industry journals and periodicals
  • Government data
  • Financial reports of key industry players
  • Historical data
  • Press releases

DATA ANALYSIS

Data Synthesis

  • Collation of data
  • Estimation of key figures
  • Analysis of derived insights

Data Validation

  • Triangulation with data models
  • Reference against proprietary databases
  • Corroboration with industry experts

REPORT WRITING

Qualitative

  • Market drivers
  • Market challenges
  • Market trends
  • Five forces analysis

Quantitative

  • Market size and forecast
  • Market segmentation
  • Geographical insights
  • Competitive landscape

Interested in this report?

Get your sample now to see our research methodology and insights!

Download Now

Frequently Asked Questions

Entertainment And Amusement market growth will increase by USD 1241.8 billion during 2026-2030.

The Entertainment And Amusement market is expected to grow at a CAGR of 7.4% during 2026-2030.

Entertainment And Amusement market is segmented by Type (Entertainment, Amusement) Age group (13 to 20 years, Above 20 years, Below 12 years) User experience (Active experiences, Interactive experiences, Passive experiences, Themed experiences, Educational experiences)

AMC Entertainment Holdings Inc., Bowlero Corp., Chimelong Group Co. Ltd., Cinemark Holdings Inc., Cirque du Soleil Entertainment, Comcast Corp., Dave and Busters Entertainment, Herschend Family Entertainment, Meow Wolf, Merlin Entertainments Ltd., Parques Reunidos SAU, Raw Thrills Inc., Regal Entertainment Group, Six Flags Entertainment Corp., The Walt Disney Co., Topgolf International Inc, Trio Tech International Pte Ltd, United Parks and Resorts Inc., Vail Resorts Inc, WhiteWater West Industries Ltd are a few of the key vendors in the Entertainment And Amusement market.

North America will register the highest growth rate of 59.8% among the other regions. Therefore, the Entertainment And Amusement market in North America is expected to garner significant business opportunities for the vendors during the forecast period.

US, Canada, Mexico, Germany, France, UK, Spain, Italy, The Netherlands, China, Japan, India, South Korea, Australia, Indonesia, Brazil, Argentina, Chile, UAE, Saudi Arabia, South Africa, Egypt, Israel

  • Increasing consumer demand for experiential entertainment is the driving factor this market.

The Entertainment And Amusement market vendors should focus on grabbing business opportunities from the Type segment as it accounted for the largest market share in the base year.
RIA - Research AI Assistant
Ask RIA