Analog Semiconductor Market Analysis, Size, and Forecast 2026-2030: APAC (China, South Korea, and Japan), Europe (UK, Germany, and France), North America (US, Canada, and Mexico), South America (Brazil and Argentina), Middle East and Africa (Saudi Arabia, UAE, and South Africa), and Rest of World (ROW)

Analog Semiconductor Market Analysis, Size, and Forecast 2026-2030:
APAC (China, South Korea, and Japan), Europe (UK, Germany, and France), North America (US, Canada, and Mexico), South America (Brazil and Argentina), Middle East and Africa (Saudi Arabia, UAE, and South Africa), and Rest of World (ROW)

Published: Mar 2026 299 Pages SKU: IRTNTR77101

Market Overview at a Glance

$31.53 B
Market Opportunity
6%
CAGR 2025 - 2030
47.3%
APAC Growth
$26.84 B
Consumer electronics segment 2024

Analog Semiconductor Market Size 2026-2030

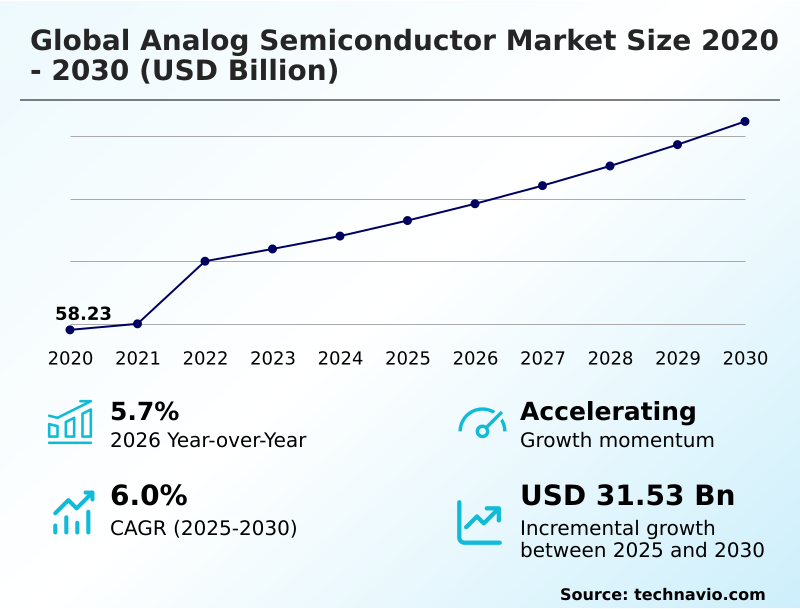
The analog semiconductor market size is valued to increase by USD 31.53 billion, at a CAGR of 6% from 2025 to 2030. Acceleration of automotive electrification and zonal architectures will drive the analog semiconductor market.

Major Market Trends & Insights

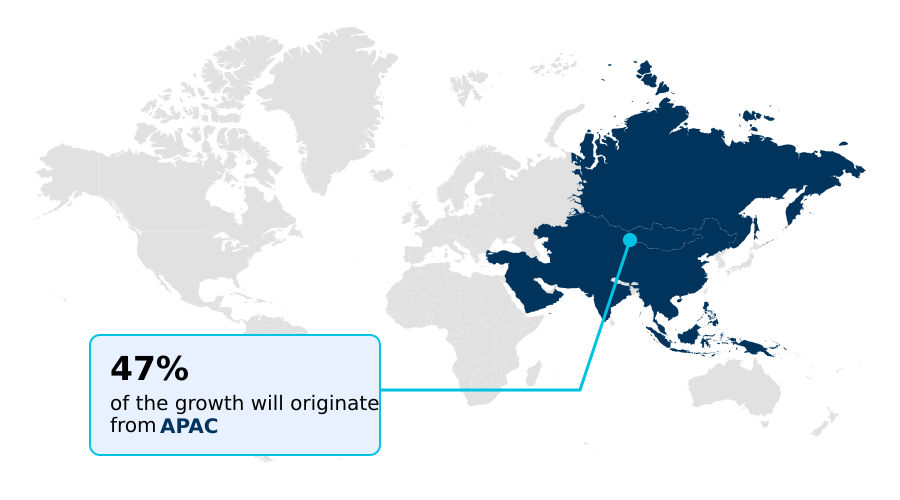
  • APAC dominated the market and accounted for a 47.3% growth during the forecast period.
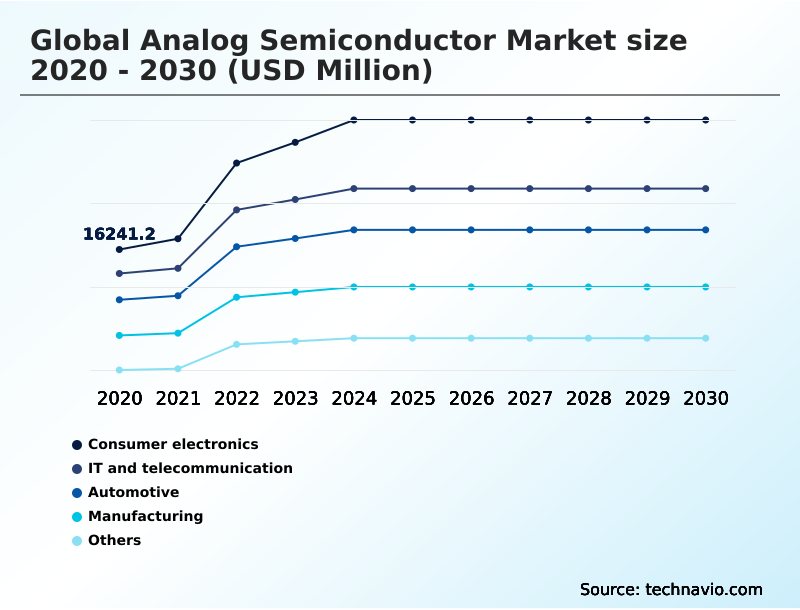
  • By Industry Application - Consumer electronics segment was valued at USD 26.84 billion in 2024
  • By Type - General purpose segment accounted for the largest market revenue share in 2024

Market Size & Forecast

  • Market Opportunities: USD 66.31 billion
  • Market Future Opportunities: USD 31.53 billion
  • CAGR from 2025 to 2030 : 6%

Market Summary

  • The analog semiconductor market is foundational to modern electronics, acting as the critical interface between the digital and physical worlds. Its trajectory is defined by increasing demand from the automotive, industrial, and communications sectors, where precision and reliability are paramount.
  • The transition to electric vehicles, for instance, requires a host of advanced analog components, including robust power management units and high-fidelity signal chain components to manage battery systems and powertrain controls. Similarly, the expansion of 5G infrastructure and AI-driven data centers fuels the need for sophisticated mixed-signal ICs and power management ICs that deliver high performance with exceptional energy efficiency.
  • In industrial automation, sensor interface chips and precise operational amplifiers are essential for robotics and process control. The industry continually innovates with materials like silicon carbide (SiC) and gallium nitride (GaN), alongside advanced system-in-package designs, to meet the complex requirements of these evolving applications.
  • This focus on integrating more functionality into smaller footprints while improving power density and signal integrity underscores the market's enduring importance.

What will be the Size of the Analog Semiconductor Market during the forecast period?

Get Key Insights on Market Forecast (PDF) Request Free Sample

How is the Analog Semiconductor Market Segmented?

The analog semiconductor industry research report provides comprehensive data (region-wise segment analysis), with forecasts and estimates in "USD million" for the period 2026-2030, as well as historical data from 2020-2024 for the following segments.

  • Industry application
    • Consumer electronics
    • IT and telecommunication
    • Automotive
    • Manufacturing
    • Others
  • Type
    • General purpose
    • Application specific
  • Form factor
    • Integrated circuits
    • Discrete components
  • Geography
    • APAC
      • China
      • South Korea
      • Japan
    • Europe
      • UK
      • Germany
      • France
    • North America
      • US
      • Canada
      • Mexico
    • South America
      • Brazil
      • Argentina
    • Middle East and Africa
      • Saudi Arabia
      • UAE
      • South Africa
    • Rest of World (ROW)

By Industry Application Insights

The consumer electronics segment is estimated to witness significant growth during the forecast period.

The consumer electronics segment remains a foundational pillar, driven by the demand for energy efficiency and feature integration in portable devices. The role of analog components is critical, handling functions from sound amplification to data conversion.

A key trend is the miniaturization of power management integrated circuits (PMICs) to fit shrinking device form factors. Manufacturers are developing high-efficiency regulators to minimize thermal dissipation, a crucial factor for wearable technology.

The proliferation of IoT has also spurred demand for ultra-low-power analog interfaces and power management units for extended battery life.

Furthermore, haptic feedback integration, where precise analog drivers and signal chain components create tactile sensations, has improved user engagement in gaming applications by over 15%, requiring advanced analog signal processing and display drivers.

Request Free Sample

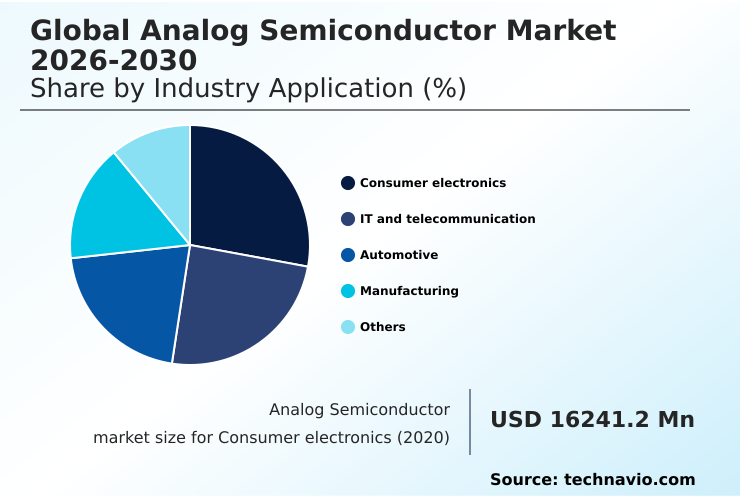
The Consumer electronics segment was valued at USD 26.84 billion in 2024 and showed a gradual increase during the forecast period.

Request Free Sample

Regional Analysis

APAC is estimated to contribute 47.3% to the growth of the global market during the forecast period.Technavio’s analysts have elaborately explained the regional trends and drivers that shape the market during the forecast period.

See How Analog Semiconductor Market Demand is Rising in APAC Request Free Sample

The geographic landscape is undergoing significant realignment, with APAC emerging as the central driver of both production and demand, accounting for nearly 47.3% of the market's incremental growth.

This dominance is reinforced by a strategic diversification of supply chains, exemplified by the establishment of India's first commercial semiconductor fabrication facility to produce power management units and sensor interface chips on legacy technology nodes.

This 'China Plus One' strategy creates a resilient, multi-polar network. While established hubs in Taiwan and South Korea focus on high-end mixed-signal ICs and power transistors, emerging regions are building capacity.

The region’s growth rate, projected to be 1.1 times that of North America, underscores its pivotal role.

This evolution away from a monolithic manufacturing bloc toward specialized regional hubs is reshaping global supply dynamics for essential components like power regulation chips.

Market Dynamics

Our researchers analyzed the data with 2025 as the base year, along with the key drivers, trends, and challenges. A holistic analysis of drivers will help companies refine their marketing strategies to gain a competitive advantage.

  • The global analog semiconductor market is navigating a complex landscape shaped by several strategic imperatives. The intense focus on analog semiconductors for automotive electrification is a primary growth engine, driving innovation in areas like high-voltage gate drivers for SiC and imaging radar processors for autonomous driving.
  • This demand highlights the impact of zonal architectures on semiconductors, pushing for more integrated and efficient designs. Concurrently, the industry is grappling with the talent gap in analog semiconductor design and the high capital expenditure for analog fabs, which are significant analog IC design complexity challenges. In response, some firms are exploring open-source hardware for analog design to foster innovation.
  • A key trend is the transition to 300mm wafer manufacturing for analog, which promises cost per die reduction 300mm wafer. This shift is critical for addressing power density in data center ICs and enabling high-volume production of power management ICs in consumer electronics.
  • The adoption of wide-bandgap materials in power conversion and development of power architectures for AI infrastructure are also vital. In mobile applications, the RF front end for mobile devices and mixed-signal ICs for 5G communication are key focus areas. For medical technology, the analog front-end for medical imaging remains a specialized growth segment.
  • Strategically, OEMs that prioritize the localization of automotive chip supply are reporting lead time reductions of over 30%, showcasing the benefits of regionalized manufacturing, which complements efforts in legacy node manufacturing for industrial ICs and enhancing high-speed video connectivity in vehicles.

What are the key market drivers leading to the rise in the adoption of Analog Semiconductor Industry?

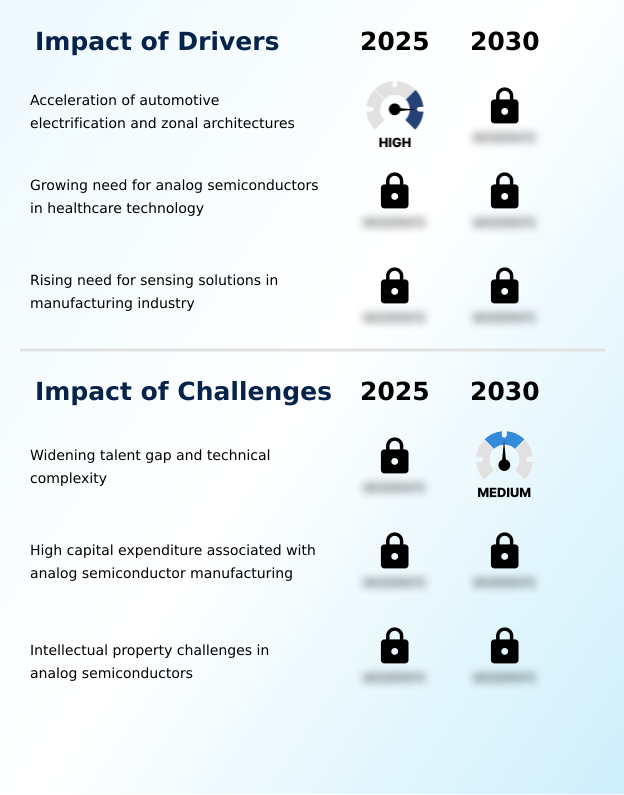
  • The acceleration of automotive electrification and the adoption of zonal architectures are primary drivers, creating exponential demand for high-performance analog components in vehicle systems.

  • The primary driver for the market is the accelerating transition to automotive electrification. The shift to electric vehicles increases the analog semiconductor content per vehicle by more than 50% compared to internal combustion engine models.
  • This surge is due to the complex requirements of battery management systems, traction inverters, and on-board chargers, all of which depend on high-performance analog ICs such as precision data converters and operational amplifiers.
  • The adoption of wide-bandgap materials is also critical; specialized gate drivers for silicon carbide (SiC) components, for instance, enable a 10% gain in powertrain efficiency.
  • Furthermore, the migration toward zonal architectures is increasing the need for smart power distribution and high-speed analog communication transceivers, including those supporting advanced automotive networking protocols.

What are the market trends shaping the Analog Semiconductor Industry?

  • A strategic shift toward 300mm wafer manufacturing is fundamentally reshaping the market. This transition drives economies of scale and creates significant competitive advantages for capital-rich leaders.

  • A fundamental trend reshaping the competitive landscape is the strategic shift to 300-millimeter wafer manufacturing. This move enables massive economies of scale, with manufacturing on 300mm wafers more than doubling the chip output per wafer compared to legacy 200mm facilities. This transition is critical for meeting volume demand from the automotive and industrial sectors for components like power management units.
  • Furthermore, this advanced manufacturing process allows for the integration of more complex digital logic with analog circuits, a key requirement for modern mixed-signal ICs and system-in-package designs. The adoption of advanced mixed-signal ICs is improving system-level power efficiency by up to 15%, a crucial metric for battery-powered devices and data centers.
  • This trend enables the production of sophisticated power transistors and signal chain components with enhanced performance.

What challenges does the Analog Semiconductor Industry face during its growth?

  • A widening talent gap, compounded by increasing technical complexity in analog design, presents a significant challenge to innovation and growth across the industry.

  • A critical challenge constraining market growth is the severe shortage of specialized engineering talent for analog design. Unlike digital design, which is highly automated, analog design remains a manual, experience-driven process. This talent deficit is extending product development timelines by an average of 15% for complex system-on-chip projects.
  • In response, some companies are resorting to 'acqui-hiring,' a strategy that can accelerate project kick-off times by over 40% compared to traditional recruitment cycles. This issue is compounded by the high capital expenditure associated with manufacturing, as building a new 300mm fab can cost upwards of 2.5 times more than a 200mm equivalent.
  • These factors create significant barriers to entry and innovation, particularly for developing complex sensor interface chips and RF transceivers.

Exclusive Technavio Analysis on Customer Landscape

The analog semiconductor market forecasting report includes the adoption lifecycle of the market, covering from the innovator’s stage to the laggard’s stage. It focuses on adoption rates in different regions based on penetration. Furthermore, the analog semiconductor market report also includes key purchase criteria and drivers of price sensitivity to help companies evaluate and develop their market growth analysis strategies.

Customer Landscape of Analog Semiconductor Industry

Competitive Landscape

Companies are implementing various strategies, such as strategic alliances, analog semiconductor market forecast, partnerships, mergers and acquisitions, geographical expansion, and product/service launches, to enhance their presence in the industry.

Analog Devices Inc. - Offerings include high-performance analog and mixed-signal integrated circuits, encompassing precision data converters, amplifiers, and power management solutions for critical industrial and communication applications.

The industry research and growth report includes detailed analyses of the competitive landscape of the market and information about key companies, including:

  • Analog Devices Inc.
  • Applied Materials Inc.
  • Chiplogic Technologies
  • Continental Device India Ltd.
  • eInfochips Pvt. Ltd.
  • Emerson Electric Co.
  • Infineon Technologies AG
  • Kistler Group
  • MediaTek Inc.
  • Microchip Technology Inc.
  • Micron Technology Inc.
  • NXP Semiconductors NV
  • ON Semiconductor Corp.
  • Qorvo Inc.
  • Qualcomm Inc.
  • Renesas Electronics Corp.
  • Semtech Corp.
  • Taiwan Semiconductor Co. Ltd.
  • Texas Instruments Inc.

Qualitative and quantitative analysis of companies has been conducted to help clients understand the wider business environment as well as the strengths and weaknesses of key industry players. Data is qualitatively analyzed to categorize companies as pure play, category-focused, industry-focused, and diversified; it is quantitatively analyzed to categorize companies as dominant, leading, strong, tentative, and weak.

Recent Development and News in Analog semiconductor market

  • In August, 2025, Infineon Technologies AG acquired a specialized engineering unit to create a new Ethernet Solutions business line, bringing in approximately 400 skilled employees to strengthen its automotive capabilities.
  • In June, 2025, Texas Instruments Inc. strategically increased prices across more than 3,000 analog integrated circuit part numbers, signaling a focus on profitability and market stabilization.
  • In May, 2025, NXP Semiconductors NV launched the S32R47 imaging radar processor, a device specifically engineered to enhance detection capabilities for Level 2+ autonomous driving systems.
  • In March, 2025, STMicroelectronics launched a new series of high-voltage galvanically isolated gate drivers engineered to optimize the performance of silicon carbide MOSFETs in electric vehicle traction inverters.

Dive into Technavio’s robust research methodology, blending expert interviews, extensive data synthesis, and validated models for unparalleled Analog Semiconductor Market insights. See full methodology.

Market Scope
Page number 299
Base year 2025
Historic period 2020-2024
Forecast period 2026-2030
Growth momentum & CAGR Accelerate at a CAGR of 6%
Market growth 2026-2030 USD 31527.1 million
Market structure Fragmented
YoY growth 2025-2026(%) 5.7%
Key countries China, Taiwan, South Korea, Japan, India, Indonesia, UK, Germany, France, Italy, Spain, The Netherlands, US, Canada, Mexico, Brazil, Argentina, Chile, Saudi Arabia, UAE, South Africa, Egypt and Nigeria
Competitive landscape Leading Companies, Market Positioning of Companies, Competitive Strategies, and Industry Risks

Request Free Sample

Research Analyst Overview

  • The analog semiconductor market is defined by a strategic push toward technological sovereignty and higher-value applications. Boardroom decisions are increasingly focused on mitigating supply chain risks through investments in 300-millimeter wafer fabrication, which directly impacts long-term cost structures and competitive positioning.
  • This is driven by the need for advanced components like high-voltage galvanically isolated gate drivers and imaging radar processors, particularly for automotive applications utilizing silicon carbide (SiC) and gallium nitride (GaN). The core of product development revolves around precision data converters, power management ICs, operational amplifiers, and other signal chain components.
  • Innovations in analog design, supported by electronic design automation, are essential to manage high-speed signal integrity in automotive networking. The market encompasses everything from RF transceivers, sensor interface chips, and microcontrollers to discrete power transistors and transient voltage suppressors. Advanced packaging, including wafer-level chip-scale packaging, ball grid arrays, and system-in-package on a monolithic substrate, is critical.
  • Key products such as power management units, gate drivers, display drivers, and power regulation chips are in high demand.
  • Strategic repricing on legacy interface chips and low-dropout regulators has improved margins by an average of 10% on select product families, reflecting a mature market balancing volume and profitability for items like automotive-grade gate drivers, high-speed video connectivity solutions, and analog front-end for CMOS image sensors.

What are the Key Data Covered in this Analog Semiconductor Market Research and Growth Report?

  • What is the expected growth of the Analog Semiconductor Market between 2026 and 2030?

    • USD 31.53 billion, at a CAGR of 6%

  • What segmentation does the market report cover?

    • The report is segmented by Industry Application (Consumer electronics, IT and telecommunication, Automotive, Manufacturing, and Others), Type (General purpose, and Application specific), Form Factor (Integrated circuits, and Discrete components) and Geography (APAC, Europe, North America, South America, Middle East and Africa)

  • Which regions are analyzed in the report?

    • APAC, Europe, North America, South America and Middle East and Africa

  • What are the key growth drivers and market challenges?

    • Acceleration of automotive electrification and zonal architectures, Widening talent gap and technical complexity

  • Who are the major players in the Analog Semiconductor Market?

    • Analog Devices Inc., Applied Materials Inc., Chiplogic Technologies, Continental Device India Ltd., eInfochips Pvt. Ltd., Emerson Electric Co., Infineon Technologies AG, Kistler Group, MediaTek Inc., Microchip Technology Inc., Micron Technology Inc., NXP Semiconductors NV, ON Semiconductor Corp., Qorvo Inc., Qualcomm Inc., Renesas Electronics Corp., Semtech Corp., Taiwan Semiconductor Co. Ltd. and Texas Instruments Inc.

Market Research Insights

  • The market's momentum is propelled by automotive electrification and the adoption of zonal architectures, which improve vehicle efficiency, with some implementations reducing wiring complexity by over 20%. Demand from AI-driven data centers for efficient data center power management and from 5G/6G communications for high-speed connectivity is also a key factor.
  • Trends include a shift toward open-source analog design and the use of automotive analog solutions and industrial power control. Innovations in healthcare technology sensing and manufacturing sensing solutions are expanding applications. Key components include automotive mixed signal devices, RF power amplifiers, and connectivity front end modules. Technology drivers like 3D radars, MEMS microphones, and 3D ToF image sensors are crucial.
  • Development of electric vehicle traction inverters for 800-volt architectures and advanced power management integrated circuits (PMICs) that improve battery life by 15% are notable. The market relies on embedded processing chips, signal integrity ICs, and specialty memory components, all supported by an expanding semiconductor fabrication facility infrastructure focused on both advanced and legacy technology nodes.

We can help! Our analysts can customize this analog semiconductor market research report to meet your requirements.

Get in touch

1. Executive Summary

1.1 Market overview

Executive Summary - Chart on Market Overview
Executive Summary - Data Table on Market Overview
Executive Summary - Chart on Global Market Characteristics
Executive Summary - Chart on Market by Geography
Executive Summary - Chart on Market Segmentation by Industry Application
Executive Summary - Chart on Market Segmentation by Type
Executive Summary - Chart on Market Segmentation by Form Factor
Executive Summary - Chart on Incremental Growth
Executive Summary - Data Table on Incremental Growth
Executive Summary - Chart on Company Market Positioning

2. Technavio Analysis

2.1 Analysis of price sensitivity, lifecycle, customer purchase basket, adoption rates, and purchase criteria

2.2 Criticality of inputs and Factors of differentiation

Chart on Overview on criticality of inputs and factors of differentiation

2.3 Factors of disruption

Chart on Overview on factors of disruption

2.4 Impact of drivers and challenges

Chart on Impact of drivers and challenges in 2025 and 2030

3. Market Landscape

3.1 Market ecosystem

Chart on Parent Market
Data Table on - Parent Market

3.2 Market characteristics

Chart on Market characteristics analysis

3.3 Value chain analysis

Chart on Value chain analysis

4. Market Sizing

4.1 Market definition

Data Table on Offerings of companies included in the market definition

4.2 Market segment analysis

Market segments

4.3 Market size 2025

4.4 Market outlook: Forecast for 2025-2030

Chart on Global - Market size and forecast 2025-2030 ($ million)
Data Table on Global - Market size and forecast 2025-2030 ($ million)
Chart on Global Market: Year-over-year growth 2025-2030 (%)
Data Table on Global Market: Year-over-year growth 2025-2030 (%)

5. Historic Market Size

5.1 Global Analog Semiconductor Market 2020 - 2024

Historic Market Size - Data Table on Global Analog Semiconductor Market 2020 - 2024 ($ million)

5.2 Industry Application segment analysis 2020 - 2024

Historic Market Size - Industry Application Segment 2020 - 2024 ($ million)

5.3 Type segment analysis 2020 - 2024

Historic Market Size - Type Segment 2020 - 2024 ($ million)

5.4 Form Factor segment analysis 2020 - 2024

Historic Market Size - Form Factor Segment 2020 - 2024 ($ million)

5.5 Geography segment analysis 2020 - 2024

Historic Market Size - Geography Segment 2020 - 2024 ($ million)

5.6 Country segment analysis 2020 - 2024

Historic Market Size - Country Segment 2020 - 2024 ($ million)

6. Qualitative Analysis

6.1 Impact of AI on Global Analog Semiconductor Market

7. Five Forces Analysis

7.1 Five forces summary

Five forces analysis - Comparison between 2025 and 2030

7.2 Bargaining power of buyers

Bargaining power of buyers - Impact of key factors 2025 and 2030

7.3 Bargaining power of suppliers

Bargaining power of suppliers - Impact of key factors in 2025 and 2030

7.4 Threat of new entrants

Threat of new entrants - Impact of key factors in 2025 and 2030

7.5 Threat of substitutes

Threat of substitutes - Impact of key factors in 2025 and 2030

7.6 Threat of rivalry

Threat of rivalry - Impact of key factors in 2025 and 2030

7.7 Market condition

Chart on Market condition - Five forces 2025 and 2030

8. Market Segmentation by Industry Application

8.1 Market segments

Chart on Industry Application - Market share 2025-2030 (%)
Data Table on Industry Application - Market share 2025-2030 (%)

8.2 Comparison by Industry Application

Chart on Comparison by Industry Application
Data Table on Comparison by Industry Application

8.3 Consumer electronics - Market size and forecast 2025-2030

Chart on Consumer electronics - Market size and forecast 2025-2030 ($ million)
Data Table on Consumer electronics - Market size and forecast 2025-2030 ($ million)
Chart on Consumer electronics - Year-over-year growth 2025-2030 (%)
Data Table on Consumer electronics - Year-over-year growth 2025-2030 (%)

8.4 IT and telecommunication - Market size and forecast 2025-2030

Chart on IT and telecommunication - Market size and forecast 2025-2030 ($ million)
Data Table on IT and telecommunication - Market size and forecast 2025-2030 ($ million)
Chart on IT and telecommunication - Year-over-year growth 2025-2030 (%)
Data Table on IT and telecommunication - Year-over-year growth 2025-2030 (%)

8.5 Automotive - Market size and forecast 2025-2030

Chart on Automotive - Market size and forecast 2025-2030 ($ million)
Data Table on Automotive - Market size and forecast 2025-2030 ($ million)
Chart on Automotive - Year-over-year growth 2025-2030 (%)
Data Table on Automotive - Year-over-year growth 2025-2030 (%)

8.6 Manufacturing - Market size and forecast 2025-2030

Chart on Manufacturing - Market size and forecast 2025-2030 ($ million)
Data Table on Manufacturing - Market size and forecast 2025-2030 ($ million)
Chart on Manufacturing - Year-over-year growth 2025-2030 (%)
Data Table on Manufacturing - Year-over-year growth 2025-2030 (%)

8.7 Others - Market size and forecast 2025-2030

Chart on Others - Market size and forecast 2025-2030 ($ million)
Data Table on Others - Market size and forecast 2025-2030 ($ million)
Chart on Others - Year-over-year growth 2025-2030 (%)
Data Table on Others - Year-over-year growth 2025-2030 (%)

8.8 Market opportunity by Industry Application

Market opportunity by Industry Application ($ million)
Data Table on Market opportunity by Industry Application ($ million)

9. Market Segmentation by Type

9.1 Market segments

Chart on Type - Market share 2025-2030 (%)
Data Table on Type - Market share 2025-2030 (%)

9.2 Comparison by Type

Chart on Comparison by Type
Data Table on Comparison by Type

9.3 General purpose - Market size and forecast 2025-2030

Chart on General purpose - Market size and forecast 2025-2030 ($ million)
Data Table on General purpose - Market size and forecast 2025-2030 ($ million)
Chart on General purpose - Year-over-year growth 2025-2030 (%)
Data Table on General purpose - Year-over-year growth 2025-2030 (%)

9.4 Application specific - Market size and forecast 2025-2030

Chart on Application specific - Market size and forecast 2025-2030 ($ million)
Data Table on Application specific - Market size and forecast 2025-2030 ($ million)
Chart on Application specific - Year-over-year growth 2025-2030 (%)
Data Table on Application specific - Year-over-year growth 2025-2030 (%)

9.5 Market opportunity by Type

Market opportunity by Type ($ million)
Data Table on Market opportunity by Type ($ million)

10. Market Segmentation by Form Factor

10.1 Market segments

Chart on Form Factor - Market share 2025-2030 (%)
Data Table on Form Factor - Market share 2025-2030 (%)

10.2 Comparison by Form Factor

Chart on Comparison by Form Factor
Data Table on Comparison by Form Factor

10.3 Integrated circuits - Market size and forecast 2025-2030

Chart on Integrated circuits - Market size and forecast 2025-2030 ($ million)
Data Table on Integrated circuits - Market size and forecast 2025-2030 ($ million)
Chart on Integrated circuits - Year-over-year growth 2025-2030 (%)
Data Table on Integrated circuits - Year-over-year growth 2025-2030 (%)

10.4 Discrete components - Market size and forecast 2025-2030

Chart on Discrete components - Market size and forecast 2025-2030 ($ million)
Data Table on Discrete components - Market size and forecast 2025-2030 ($ million)
Chart on Discrete components - Year-over-year growth 2025-2030 (%)
Data Table on Discrete components - Year-over-year growth 2025-2030 (%)

10.5 Market opportunity by Form Factor

Market opportunity by Form Factor ($ million)
Data Table on Market opportunity by Form Factor ($ million)

11. Customer Landscape

11.1 Customer landscape overview

Analysis of price sensitivity, lifecycle, customer purchase basket, adoption rates, and purchase criteria

12. Geographic Landscape

12.1 Geographic segmentation

Chart on Market share by geography 2025-2030 (%)
Data Table on Market share by geography 2025-2030 (%)

12.2 Geographic comparison

Chart on Geographic comparison
Data Table on Geographic comparison

12.3 APAC - Market size and forecast 2025-2030

Chart on APAC - Market size and forecast 2025-2030 ($ million)
Data Table on APAC - Market size and forecast 2025-2030 ($ million)
Chart on APAC - Year-over-year growth 2025-2030 (%)
Data Table on APAC - Year-over-year growth 2025-2030 (%)
Chart on Regional Comparison - APAC
Data Table on Regional Comparison - APAC

12.3.1 China - Market size and forecast 2025-2030

Chart on China - Market size and forecast 2025-2030 ($ million)
Data Table on China - Market size and forecast 2025-2030 ($ million)
Chart on China - Year-over-year growth 2025-2030 (%)
Data Table on China - Year-over-year growth 2025-2030 (%)

12.3.2 Taiwan - Market size and forecast 2025-2030

Chart on Taiwan - Market size and forecast 2025-2030 ($ million)
Data Table on Taiwan - Market size and forecast 2025-2030 ($ million)
Chart on Taiwan - Year-over-year growth 2025-2030 (%)
Data Table on Taiwan - Year-over-year growth 2025-2030 (%)

12.3.3 South Korea - Market size and forecast 2025-2030

Chart on South Korea - Market size and forecast 2025-2030 ($ million)
Data Table on South Korea - Market size and forecast 2025-2030 ($ million)
Chart on South Korea - Year-over-year growth 2025-2030 (%)
Data Table on South Korea - Year-over-year growth 2025-2030 (%)

12.3.4 Japan - Market size and forecast 2025-2030

Chart on Japan - Market size and forecast 2025-2030 ($ million)
Data Table on Japan - Market size and forecast 2025-2030 ($ million)
Chart on Japan - Year-over-year growth 2025-2030 (%)
Data Table on Japan - Year-over-year growth 2025-2030 (%)

12.3.5 India - Market size and forecast 2025-2030

Chart on India - Market size and forecast 2025-2030 ($ million)
Data Table on India - Market size and forecast 2025-2030 ($ million)
Chart on India - Year-over-year growth 2025-2030 (%)
Data Table on India - Year-over-year growth 2025-2030 (%)

12.3.6 Indonesia - Market size and forecast 2025-2030

Chart on Indonesia - Market size and forecast 2025-2030 ($ million)
Data Table on Indonesia - Market size and forecast 2025-2030 ($ million)
Chart on Indonesia - Year-over-year growth 2025-2030 (%)
Data Table on Indonesia - Year-over-year growth 2025-2030 (%)

12.4 Europe - Market size and forecast 2025-2030

Chart on Europe - Market size and forecast 2025-2030 ($ million)
Data Table on Europe - Market size and forecast 2025-2030 ($ million)
Chart on Europe - Year-over-year growth 2025-2030 (%)
Data Table on Europe - Year-over-year growth 2025-2030 (%)
Chart on Regional Comparison - Europe
Data Table on Regional Comparison - Europe

12.4.1 UK - Market size and forecast 2025-2030

Chart on UK - Market size and forecast 2025-2030 ($ million)
Data Table on UK - Market size and forecast 2025-2030 ($ million)
Chart on UK - Year-over-year growth 2025-2030 (%)
Data Table on UK - Year-over-year growth 2025-2030 (%)

12.4.2 Germany - Market size and forecast 2025-2030

Chart on Germany - Market size and forecast 2025-2030 ($ million)
Data Table on Germany - Market size and forecast 2025-2030 ($ million)
Chart on Germany - Year-over-year growth 2025-2030 (%)
Data Table on Germany - Year-over-year growth 2025-2030 (%)

12.4.3 France - Market size and forecast 2025-2030

Chart on France - Market size and forecast 2025-2030 ($ million)
Data Table on France - Market size and forecast 2025-2030 ($ million)
Chart on France - Year-over-year growth 2025-2030 (%)
Data Table on France - Year-over-year growth 2025-2030 (%)

12.4.4 Italy - Market size and forecast 2025-2030

Chart on Italy - Market size and forecast 2025-2030 ($ million)
Data Table on Italy - Market size and forecast 2025-2030 ($ million)
Chart on Italy - Year-over-year growth 2025-2030 (%)
Data Table on Italy - Year-over-year growth 2025-2030 (%)

12.4.5 Spain - Market size and forecast 2025-2030

Chart on Spain - Market size and forecast 2025-2030 ($ million)
Data Table on Spain - Market size and forecast 2025-2030 ($ million)
Chart on Spain - Year-over-year growth 2025-2030 (%)
Data Table on Spain - Year-over-year growth 2025-2030 (%)

12.4.6 The Netherlands - Market size and forecast 2025-2030

Chart on The Netherlands - Market size and forecast 2025-2030 ($ million)
Data Table on The Netherlands - Market size and forecast 2025-2030 ($ million)
Chart on The Netherlands - Year-over-year growth 2025-2030 (%)
Data Table on The Netherlands - Year-over-year growth 2025-2030 (%)

12.5 North America - Market size and forecast 2025-2030

Chart on North America - Market size and forecast 2025-2030 ($ million)
Data Table on North America - Market size and forecast 2025-2030 ($ million)
Chart on North America - Year-over-year growth 2025-2030 (%)
Data Table on North America - Year-over-year growth 2025-2030 (%)
Chart on Regional Comparison - North America
Data Table on Regional Comparison - North America

12.5.1 US - Market size and forecast 2025-2030

Chart on US - Market size and forecast 2025-2030 ($ million)
Data Table on US - Market size and forecast 2025-2030 ($ million)
Chart on US - Year-over-year growth 2025-2030 (%)
Data Table on US - Year-over-year growth 2025-2030 (%)

12.5.2 Canada - Market size and forecast 2025-2030

Chart on Canada - Market size and forecast 2025-2030 ($ million)
Data Table on Canada - Market size and forecast 2025-2030 ($ million)
Chart on Canada - Year-over-year growth 2025-2030 (%)
Data Table on Canada - Year-over-year growth 2025-2030 (%)

12.5.3 Mexico - Market size and forecast 2025-2030

Chart on Mexico - Market size and forecast 2025-2030 ($ million)
Data Table on Mexico - Market size and forecast 2025-2030 ($ million)
Chart on Mexico - Year-over-year growth 2025-2030 (%)
Data Table on Mexico - Year-over-year growth 2025-2030 (%)

12.6 South America - Market size and forecast 2025-2030

Chart on South America - Market size and forecast 2025-2030 ($ million)
Data Table on South America - Market size and forecast 2025-2030 ($ million)
Chart on South America - Year-over-year growth 2025-2030 (%)
Data Table on South America - Year-over-year growth 2025-2030 (%)
Chart on Regional Comparison - South America
Data Table on Regional Comparison - South America

12.6.1 Brazil - Market size and forecast 2025-2030

Chart on Brazil - Market size and forecast 2025-2030 ($ million)
Data Table on Brazil - Market size and forecast 2025-2030 ($ million)
Chart on Brazil - Year-over-year growth 2025-2030 (%)
Data Table on Brazil - Year-over-year growth 2025-2030 (%)

12.6.2 Argentina - Market size and forecast 2025-2030

Chart on Argentina - Market size and forecast 2025-2030 ($ million)
Data Table on Argentina - Market size and forecast 2025-2030 ($ million)
Chart on Argentina - Year-over-year growth 2025-2030 (%)
Data Table on Argentina - Year-over-year growth 2025-2030 (%)

12.6.3 Chile - Market size and forecast 2025-2030

Chart on Chile - Market size and forecast 2025-2030 ($ million)
Data Table on Chile - Market size and forecast 2025-2030 ($ million)
Chart on Chile - Year-over-year growth 2025-2030 (%)
Data Table on Chile - Year-over-year growth 2025-2030 (%)

12.7 Middle East and Africa - Market size and forecast 2025-2030

Chart on Middle East and Africa - Market size and forecast 2025-2030 ($ million)
Data Table on Middle East and Africa - Market size and forecast 2025-2030 ($ million)
Chart on Middle East and Africa - Year-over-year growth 2025-2030 (%)
Data Table on Middle East and Africa - Year-over-year growth 2025-2030 (%)
Chart on Regional Comparison - Middle East and Africa
Data Table on Regional Comparison - Middle East and Africa

12.7.1 Saudi Arabia - Market size and forecast 2025-2030

Chart on Saudi Arabia - Market size and forecast 2025-2030 ($ million)
Data Table on Saudi Arabia - Market size and forecast 2025-2030 ($ million)
Chart on Saudi Arabia - Year-over-year growth 2025-2030 (%)
Data Table on Saudi Arabia - Year-over-year growth 2025-2030 (%)

12.7.2 UAE - Market size and forecast 2025-2030

Chart on UAE - Market size and forecast 2025-2030 ($ million)
Data Table on UAE - Market size and forecast 2025-2030 ($ million)
Chart on UAE - Year-over-year growth 2025-2030 (%)
Data Table on UAE - Year-over-year growth 2025-2030 (%)

12.7.3 South Africa - Market size and forecast 2025-2030

Chart on South Africa - Market size and forecast 2025-2030 ($ million)
Data Table on South Africa - Market size and forecast 2025-2030 ($ million)
Chart on South Africa - Year-over-year growth 2025-2030 (%)
Data Table on South Africa - Year-over-year growth 2025-2030 (%)

12.7.4 Egypt - Market size and forecast 2025-2030

Chart on Egypt - Market size and forecast 2025-2030 ($ million)
Data Table on Egypt - Market size and forecast 2025-2030 ($ million)
Chart on Egypt - Year-over-year growth 2025-2030 (%)
Data Table on Egypt - Year-over-year growth 2025-2030 (%)

12.7.5 Nigeria - Market size and forecast 2025-2030

Chart on Nigeria - Market size and forecast 2025-2030 ($ million)
Data Table on Nigeria - Market size and forecast 2025-2030 ($ million)
Chart on Nigeria - Year-over-year growth 2025-2030 (%)
Data Table on Nigeria - Year-over-year growth 2025-2030 (%)

12.8 Market opportunity by geography

Market opportunity by geography ($ million)
Data Tables on Market opportunity by geography ($ million)

13. Drivers, Challenges, and Opportunity

13.1 Market drivers

Acceleration of automotive electrification and zonal architectures
Growing need for analog semiconductors in healthcare technology
Rising need for sensing solutions in manufacturing industry

13.2 Market challenges

Widening talent gap and technical complexity
High capital expenditure associated with analog semiconductor manufacturing
Intellectual property challenges in analog semiconductors

13.3 Impact of drivers and challenges

Impact of drivers and challenges in 2025 and 2030

13.4 Market opportunities

Strategic shift toward 300mm wafer manufacturing dominance
Increasing adoption of mixed-signal and power management ICs
Rise of open-source hardware and software for analog design

14. Competitive Landscape

14.1 Overview

14.2

Overview on criticality of inputs and factors of differentiation

14.3 Landscape disruption

Overview on factors of disruption

14.4 Industry risks

Impact of key risks on business

15. Competitive Analysis

15.1 Companies profiled

Companies covered

15.2 Company ranking index

15.3 Market positioning of companies

Matrix on companies position and classification

15.4 Analog Devices Inc.

Analog Devices Inc. - Overview
Analog Devices Inc. - Business segments
Analog Devices Inc. - Key news
Analog Devices Inc. - Key offerings
Analog Devices Inc. - Segment focus
SWOT

15.5 Applied Materials Inc.

Applied Materials Inc. - Overview
Applied Materials Inc. - Business segments
Applied Materials Inc. - Key offerings
Applied Materials Inc. - Segment focus
SWOT

15.6 Emerson Electric Co.

Emerson Electric Co. - Overview
Emerson Electric Co. - Business segments
Emerson Electric Co. - Key news
Emerson Electric Co. - Key offerings
Emerson Electric Co. - Segment focus
SWOT

15.7 Infineon Technologies AG

Infineon Technologies AG - Overview
Infineon Technologies AG - Business segments
Infineon Technologies AG - Key news
Infineon Technologies AG - Key offerings
Infineon Technologies AG - Segment focus
SWOT

15.8 MediaTek Inc.

MediaTek Inc. - Overview
MediaTek Inc. - Product / Service
MediaTek Inc. - Key news
MediaTek Inc. - Key offerings
SWOT

15.9 Microchip Technology Inc.

Microchip Technology Inc. - Overview
Microchip Technology Inc. - Business segments
Microchip Technology Inc. - Key news
Microchip Technology Inc. - Key offerings
Microchip Technology Inc. - Segment focus
SWOT

15.10 Micron Technology Inc.

Micron Technology Inc. - Overview
Micron Technology Inc. - Business segments
Micron Technology Inc. - Key news
Micron Technology Inc. - Key offerings
Micron Technology Inc. - Segment focus
SWOT

15.11 NXP Semiconductors NV

NXP Semiconductors NV - Overview
NXP Semiconductors NV - Business segments
NXP Semiconductors NV - Key offerings
NXP Semiconductors NV - Segment focus
SWOT

15.12 ON Semiconductor Corp.

ON Semiconductor Corp. - Overview
ON Semiconductor Corp. - Business segments
ON Semiconductor Corp. - Key news
ON Semiconductor Corp. - Key offerings
ON Semiconductor Corp. - Segment focus
SWOT

15.13 Qorvo Inc.

Qorvo Inc. - Overview
Qorvo Inc. - Business segments
Qorvo Inc. - Key news
Qorvo Inc. - Key offerings
Qorvo Inc. - Segment focus
SWOT

15.14 Qualcomm Inc.

Qualcomm Inc. - Overview
Qualcomm Inc. - Business segments
Qualcomm Inc. - Key news
Qualcomm Inc. - Key offerings
Qualcomm Inc. - Segment focus
SWOT

15.15 Renesas Electronics Corp.

Renesas Electronics Corp. - Overview
Renesas Electronics Corp. - Business segments
Renesas Electronics Corp. - Key news
Renesas Electronics Corp. - Key offerings
Renesas Electronics Corp. - Segment focus
SWOT

15.16 Semtech Corp.

Semtech Corp. - Overview
Semtech Corp. - Business segments
Semtech Corp. - Key news
Semtech Corp. - Key offerings
Semtech Corp. - Segment focus
SWOT

15.17 Taiwan Semiconductor Co. Ltd.

Taiwan Semiconductor Co. Ltd. - Overview
Taiwan Semiconductor Co. Ltd. - Product / Service
Taiwan Semiconductor Co. Ltd. - Key news
Taiwan Semiconductor Co. Ltd. - Key offerings
SWOT

15.18 Texas Instruments Inc.

Texas Instruments Inc. - Overview
Texas Instruments Inc. - Business segments
Texas Instruments Inc. - Key offerings
Texas Instruments Inc. - Segment focus
SWOT

16. Appendix

16.1 Scope of the report

Market definition
Objectives
Notes and caveats

16.2 Inclusions and exclusions checklist

Inclusions checklist
Exclusions checklist

16.3 Currency conversion rates for US$

16.4 Research methodology

16.5 Data procurement

Information sources

16.6 Data validation

16.7 Validation techniques employed for market sizing

16.8 Data synthesis

16.9 360 degree market analysis

16.10 List of abbreviations

Research Methodology

Technavio presents a detailed picture of the market by way of study, synthesis, and summation of data from multiple sources. The analysts have presented the various facets of the market with a particular focus on identifying the key industry influencers. The data thus presented is comprehensive, reliable, and the result of extensive research, both primary and secondary.

INFORMATION SOURCES

Primary sources

  • Manufacturers and suppliers
  • Channel partners
  • Industry experts
  • Strategic decision makers

Secondary sources

  • Industry journals and periodicals
  • Government data
  • Financial reports of key industry players
  • Historical data
  • Press releases

DATA ANALYSIS

Data Synthesis

  • Collation of data
  • Estimation of key figures
  • Analysis of derived insights

Data Validation

  • Triangulation with data models
  • Reference against proprietary databases
  • Corroboration with industry experts

REPORT WRITING

Qualitative

  • Market drivers
  • Market challenges
  • Market trends
  • Five forces analysis

Quantitative

  • Market size and forecast
  • Market segmentation
  • Geographical insights
  • Competitive landscape

Interested in this report?

Get your sample now to see our research methodology and insights!

Download Now

Frequently Asked Questions

Analog Semiconductor market growth will increase by USD 31527.1 million during 2026-2030.

The Analog Semiconductor market is expected to grow at a CAGR of 6% during 2026-2030.

Analog Semiconductor market is segmented by Industry application (Consumer electronics, IT and telecommunication, Automotive, Manufacturing, Others) Type (General purpose, Application specific) Form factor (Integrated circuits, Discrete components)

Analog Devices Inc., Applied Materials Inc., Chiplogic Technologies, Continental Device India Ltd., eInfochips Pvt. Ltd., Emerson Electric Co., Infineon Technologies AG, Kistler Group, MediaTek Inc., Microchip Technology Inc., Micron Technology Inc., NXP Semiconductors NV, ON Semiconductor Corp., Qorvo Inc., Qualcomm Inc., Renesas Electronics Corp., Semtech Corp., Taiwan Semiconductor Co. Ltd., Texas Instruments Inc. are a few of the key vendors in the Analog Semiconductor market.

APAC will register the highest growth rate of 47.3% among the other regions. Therefore, the Analog Semiconductor market in APAC is expected to garner significant business opportunities for the vendors during the forecast period.

China, Taiwan, South Korea, Japan, India, Indonesia, UK, Germany, France, Italy, Spain, The Netherlands, US, Canada, Mexico, Brazil, Argentina, Chile, Saudi Arabia, UAE, South Africa, Egypt, Nigeria

  • Acceleration of automotive electrification and zonal architectures is the driving factor this market.

The Analog Semiconductor market vendors should focus on grabbing business opportunities from the Industry application segment as it accounted for the largest market share in the base year.
RIA - Research AI Assistant
Ask RIA