Animal Genetics Market Analysis North America, Europe, Asia, Rest of World (ROW) - US, Germany, UK, France, China - Size and Forecast 2024-2028

Animal Genetics Market Analysis North America, Europe, Asia, Rest of World (ROW) - US, Germany, UK, France, China - Size and Forecast 2024-2028

Published: Mar 2024 158 Pages SKU: IRTNTR40040

Market Overview at a Glance

$2.59 B
Market Opportunity
7.45%
CAGR
7.0
YoY growth 2023-2024(%)

Animal Genetics Market Size 2024-2028

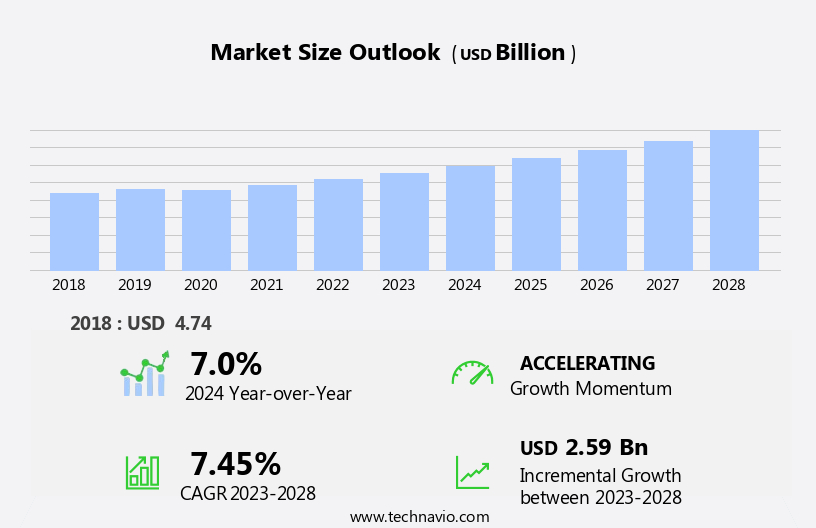
The animal genetics market size is forecast to increase by USD 2.59 billion, at a CAGR of 7.45% between 2023 and 2028.

  • The market is experiencing significant growth due to the increasing demand for genetic testing services for companion animals. Companies specialize in advanced animal genetics services, offering a comprehensive range of tests including DNA sequencing, disease diagnostics, and DNA genotyping for exotic avian species. This trend is driven by pet owners seeking to ensure the health and wellbeing of their pets through early detection and prevention of genetic disorders. Additionally, advancements in genetic research and technology are enabling more accurate and accessible testing, further fueling market growth. However, the market faces challenges as well. The animal genetics industry is witnessing a rise in mergers and acquisitions among companies, leading to increased competition and consolidation. Furthermore, stringent regulations on animal genetic products pose significant challenges for market participants.
  • Ensuring compliance with these regulations can be costly and time-consuming, requiring substantial resources and expertise. Companies must navigate these regulatory hurdles while also staying abreast of the latest scientific advancements and consumer trends to remain competitive in the market. To capitalize on opportunities and overcome challenges, market players must focus on innovation, regulatory compliance, and strategic partnerships.

What will be the Size of the Animal Genetics Market during the forecast period?

Animal Genetics Market Size

Explore in-depth regional segment analysis with market size data - historical 2018-2022 and forecasts 2024-2028 - in the full report.  
Request Free Sample

The market continues to evolve, driven by advancements in genomic selection, quantitative genetics, and next-generation sequencing (NGS). These technologies enable the identification and manipulation of polygenic traits, gene expression, and genetic markers, revolutionizing genetic improvement in various sectors. Livestock production, including beef and dairy cattle, benefits from these innovations through gene editing, genetic diversity management, and breeding programs. Genetic engineering, with its applications in transgenic animals and gene mapping, further expands the potential for genetic improvement. Massively parallel sequencing and SNP genotyping facilitate the analysis of large datasets, enhancing marker-assisted selection (MAS) and population genetics. Fish farming and embryo transfer are among the sectors adopting these technologies, with genetic databases and pedigree analysis playing crucial roles in their implementation.

Inbreeding depression is mitigated through embryo cryopreservation, sperm cryopreservation, and artificial insemination. The ongoing unfolding of market activities underscores the continuous dynamism of the animal genetics industry, with its applications shaping the future of livestock production and beyond.

How is this Animal Genetics Industry segmented?

The animal genetics industry research report provides comprehensive data (region-wise segment analysis), with forecasts and estimates in "USD billion" for the period 2024-2028, as well as historical data from 2018-2022 for the following segments.

  • End-user
    • Research centers
    • Hospitals and clinics
    • Diagnostic centers
  • Solution
    • Live animal
    • Genetic testing services
    • Genetic materials
  • Animal
    • Bovine
    • Porcine
    • Bovine
    • Porcine
  • Technology
    • PCR
    • NGS
    • rDNA
    • Microarray Technology
    • PCR
    • NGS
    • rDNA
    • Microarray Technology
  • Geography
    • North America
      • US
      • Canada
    • Europe
      • France
      • Germany
      • UK
    • Middle East and Africa
      • South Africa
    • APAC
      • China
      • India
      • Japan
    • Rest of World (ROW)

By End-user Insights

The research centers segment is estimated to witness significant growth during the forecast period.

Animal genetics plays a pivotal role in advancing livestock production and fish farming through diagnostic tests and potential therapies for disease intervention. Genetic research, including genomic selection, genetic engineering, linkage analysis, and gene mapping, contributes to the creation of genomic databases for pathogens, driving demand for genetic testing products. Quantitative genetics, gene expression, and population genetics enable a better understanding of animal health risks and breeding programs. Next-generation sequencing (NGS) and massively parallel sequencing technologies facilitate the discovery of genetic markers for genetic improvement. Transgenic animals and marker-assisted selection (MAS) are essential tools for breeding programs, while pedigree analysis and genotyping-by-sequencing (GBS) enhance genetic diversity.

In livestock production, technologies like embryo transfer, embryo cryopreservation, sperm cryopreservation, and artificial insemination have revolutionized animal breeding. Gene editing, SNP genotyping, and gene expression analysis further expand the potential for genetic research and innovation. In the realm of fish farming, genetic research facilitates the development of disease-resistant strains and improved growth rates. Overall, the market witnesses significant growth due to the increasing focus on cutting-edge animal selection techniques and effective genetic testing solutions.

Animal Genetics Market Size

Request Free Sample

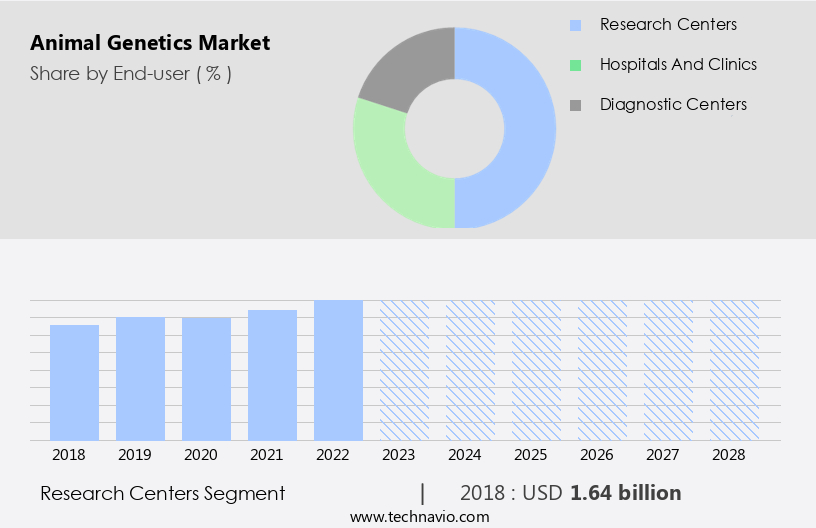
The Research centers segment was valued at USD 1.64 billion in 2018 and showed a gradual increase during the forecast period.

Regional Analysis

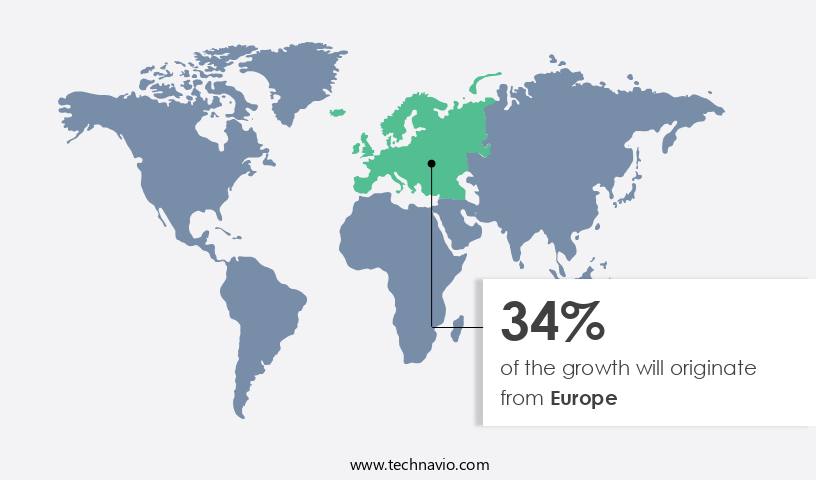
Europe is estimated to contribute 34% to the growth of the global market during the forecast period. Technavio’s analysts have elaborately explained the regional trends and drivers that shape the market during the forecast period.

Animal Genetics Market Share by Geography

 Request Free Sample

The market is experiencing significant advancements with the integration of genomic selection, genetic engineering, and next-generation sequencing (NGS) technologies. Polygenic traits, linkage analysis, and massively parallel sequencing are key techniques driving genetic improvement in livestock production. Transgenic animals and gene editing are revolutionizing the industry, enabling the manipulation of specific genes for desired traits. Genetic markers, marker-assisted selection (MAS), and gene mapping are essential tools for breeding programs, enhancing genetic diversity and population genetics. In North America, the largest geographical segment, the US is the primary contributor to the market's growth. The demand for animal genetic solutions is increasing due to the adoption of sustainable livestock management practices.

Approximately 40-50% of agricultural revenue in Canada and the US comes from farm gate livestock receipts. Gene expression analysis, embryo transfer, genetic databases, SNP genotyping, embryo cryopreservation, sperm cryopreservation, and artificial insemination are some of the essential applications. Inbreeding depression is a concern in fish farming, leading to the development of new strategies, including selective breeding and genetic engineering. Overall, the market is evolving, with quantitative genetics, pedigree analysis, and genotyping-by-sequencing (GBS) playing crucial roles. Beef cattle and dairy cattle are significant sectors, with DNA microarrays providing valuable insights into their genetics. The integration of these technologies is transforming animal breeding and production, ensuring the continued growth of the market.

Market Dynamics

Our researchers analyzed the data with 2023 as the base year, along with the key drivers, trends, and challenges. A holistic analysis of drivers will help companies refine their marketing strategies to gain a competitive advantage.

What are the key market drivers leading to the rise in the adoption of Animal Genetics Industry?

  • The increasing demand for genetic testing services is a primary market driver, particularly in the companion animal sector. 
  • Genetic testing in animal sciences is gaining popularity among pet owners for identifying inheritable diseases and genetic predispositions in companion animals. Early detection of these risks enables proactive management and treatment, enhancing their health and well-being. Genetic testing can also provide insights into an animal's ancestry and breed composition, satisfying the curiosity of pet owners about their pet's background and characteristics. Moreover, genetic testing is being utilized to identify genetic markers linked to behavioral traits such as aggression, anxiety, and trainability in dogs. Understanding the genetic basis of behavior can significantly aid in training and behavior modification programs, thereby strengthening the bond between pets and their owners.
  • Advancements in genomic selection, genetic engineering, and next-generation sequencing (NGS) technologies have facilitated the identification of polygenic traits and linkage analysis in animals. Massively parallel sequencing and quantitative genetics are other techniques used to study the genetic makeup of animals, leading to the development of transgenic animals for various applications. These technological advancements have revolutionized the field of animal genetics, offering numerous opportunities for research and development in animal health, breeding, and behavioral studies. Pet owners' growing awareness of the benefits of genetic testing and the availability of user-friendly testing kits are expected to fuel the market's growth.

What are the market trends shaping the Animal Genetics Industry?

  • The number of mergers and acquisitions among companies is on the rise, representing a significant market trend. This trend reflects the dynamic business landscape and the continuous efforts of companies to expand their reach and enhance their competitive position.
  • The market is experiencing significant growth and development as companies invest in advanced technologies to improve livestock production. Gene expression analysis, gene editing, and the use of genetic markers are key areas of focus for genetic improvement in animal breeding. Companies are leveraging pedigree analysis and marker-assisted selection (MAS) to enhance the efficiency and accuracy of breeding programs. Mergers and acquisitions are a common strategy for animal genetics companies to expand their geographic presence and diversify their offerings. By acquiring complementary businesses or entering new markets, companies can strengthen their competitive position and capture a larger market share. Vertical integration through acquisitions enables companies to control more stages of the value chain, from genetics and breeding to the production and distribution of animal products.
  • This integration can lead to increased efficiency, improved quality control, and better supply chain management. For instance, in June 2022, Zoetis Inc. announced its acquisition of a leading animal genetics company to expand its portfolio and enhance its capabilities in genetic testing and analysis.

What challenges does the Animal Genetics Industry face during its growth?

  • The stringent regulations governing the production and sale of animal genetic products pose a significant challenge to the industry's growth. This complex regulatory environment requires companies to adhere to strict standards, which can increase costs and limit innovation. Ensuring the safety and ethical treatment of animals is a critical concern, but navigating the intricacies of various regulatory bodies can hinder progress and impede the industry's ability to expand. 
  • The market is subject to rigorous regulation due to the production of animal-derived food products and the implementation of breeding programs utilizing genetic solutions. Regulatory bodies prioritize ensuring the safety of food products such as beef and dairy, including meat, eggs, and milk. They also verify that these solutions are devoid of genetic modification, adhering to laws and regulations against genetically modified organisms (GMOs) in various countries. For instance, companies involved in egg and poultry production must confirm that their products adhere to non-GMO regulations. Genetic diversity plays a crucial role in breeding programs, with techniques such as genotyping-by-sequencing (GBS) and gene mapping employed to enhance genetic diversity and improve breeding outcomes.
  • DNA microarrays are also used for gene expression analysis, providing valuable insights into genetic traits and potential health issues. Inbreeding depression is a significant concern in animal genetics, necessitating the implementation of strategies to minimize its impact on breeding programs.

Exclusive Customer Landscape

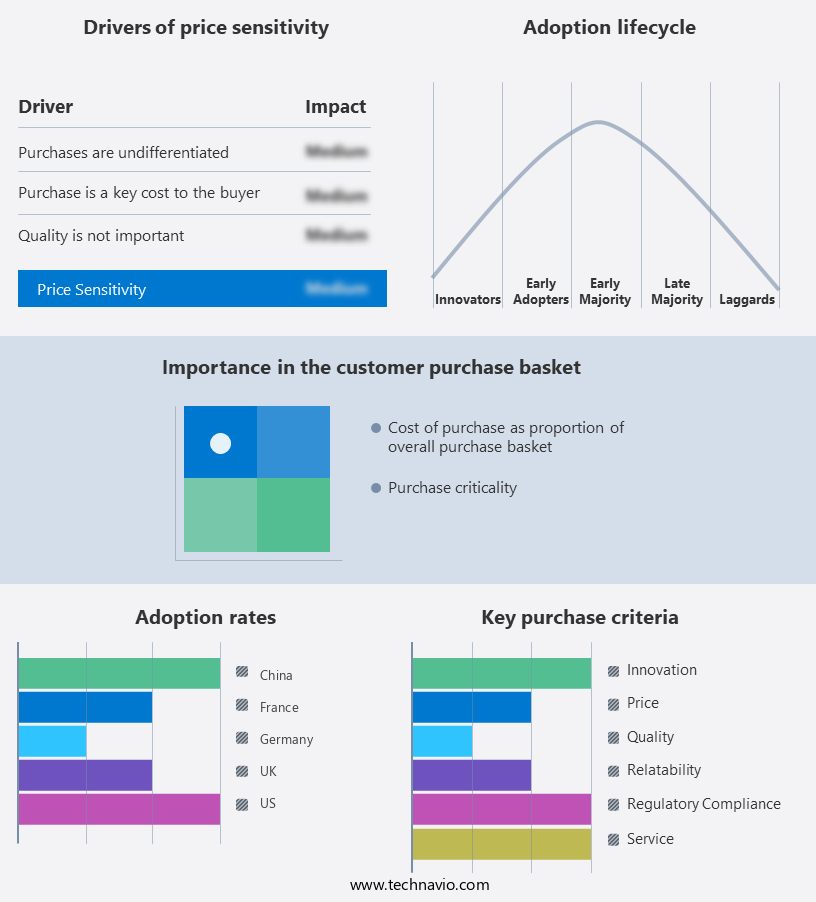
The animal genetics market forecasting report includes the adoption lifecycle of the market, covering from the innovator’s stage to the laggard’s stage. It focuses on adoption rates in different regions based on penetration. Furthermore, the animal genetics market report also includes key purchase criteria and drivers of price sensitivity to help companies evaluate and develop their market growth analysis strategies.

Animal Genetics Market Share by Geography

 Customer Landscape

Key Companies & Market Insights

Companies are implementing various strategies, such as strategic alliances, animal genetics market forecast, partnerships, mergers and acquisitions, geographical expansion, and product/service launches, to enhance their presence in the industry.

EasyDNA - This company specializes in advanced animal genetics services, providing tests for exotic birds, DNA sexing, disease detection, and genotyping, enhancing agricultural productivity and animal health through scientific innovation.

The industry research and growth report includes detailed analyses of the competitive landscape of the market and information about key companies, including:

  • EasyDNA
  • Inguran LLC
  • Neogen Corp.
  • URUS Group LP
  • VikingGenetics F.M.B.A
  • Zoetis Inc.
  • Animal Genetics Inc.
  • Aviagen Group
  •  DNA Genetics
  • Genus Plc
  • Groupe Grimaud
  • Hendrix Genetics BV
  • Koko Genetics
  • Sandor Animal Biogenics Pvt. Ltd.
  • Superior Animal Genetics
  • SWINE GENETICS INTERNATIONAL
  • TOPIGS NORSVIN
  • Trans Ova Genetics
  • Tropical Animal Genetics
  • Vaxxinova International BV

Qualitative and quantitative analysis of companies has been conducted to help clients understand the wider business environment as well as the strengths and weaknesses of key industry players. Data is qualitatively analyzed to categorize companies as pure play, category-focused, industry-focused, and diversified; it is quantitatively analyzed to categorize companies as dominant, leading, strong, tentative, and weak.

Recent Development and News in Animal Genetics Market

  • In January 2024, Genus plc, a global leader in animal genetics, announced the launch of its new pig genetics product, PIC BOARVANTAGE, in partnership with Topigs Norsvin. This innovative product combines the strengths of both companies' genetics, aiming to improve the productivity and efficiency of pig farming (Genus plc Press Release).
  • In March 2024, Merck Animal Health, a well-known animal health company, acquired Bio-M Pharma, a leading provider of genetics and breeding solutions for dairy cattle. This strategic acquisition expanded Merck Animal Health's portfolio and strengthened its position in the market (Merck Animal Health Press Release).
  • In May 2024, the European Commission approved the use of gene editing techniques in farm animals, including those for improving animal genetics. This decision marked a significant regulatory milestone, paving the way for the development and adoption of genetically modified animals in Europe (European Commission Press Release).
  • In April 2025, Zoetis, a leading animal health company, announced a major investment in CRISPR Gene Editing technology to enhance its animal genetics offerings. The exact investment amount was undisclosed, but the company stated it would accelerate the development of innovative genetics solutions for livestock producers (Zoetis Press Release).

Research Analyst Overview

  • In the dynamic market, welfare indicators and genome annotation play crucial roles in breed improvement. Linkage disequilibrium and statistical modeling are essential tools for disease genomics, enabling the identification of genetic variations associated with diseases and stress tolerance. Reproductive technologies, such as precision breeding and genome editing, facilitate the creation of genetically superior animals with improved milk production, feed efficiency, and egg production. Regulatory frameworks ensure ethical considerations are met while intellectual property protections foster innovation in machine learning, predictive modeling, and data analysis.
  • Disease resistance, growth rate, meat quality, and egg production are key performance indicators driving market trends. Evolutionary biology and comparative genomics contribute to a deeper understanding of animal genetics, further fueling advancements in animal health and breeding.

Dive into Technavio’s robust research methodology, blending expert interviews, extensive data synthesis, and validated models for unparalleled Animal Genetics Market insights. See full methodology.

Market Scope

Report Coverage

Details

Page number

158

Base year

2023

Historic period

2018-2022

Forecast period

2024-2028

Growth momentum & CAGR

Accelerate at a CAGR of 7.45%

Market growth 2024-2028

USD 2.59 billion

Market structure

Fragmented

YoY growth 2023-2024(%)

7.0

Key countries

US, Germany, UK, France, China, India, Japan, Canada, and South Africa

Competitive landscape

Leading Companies, Market Positioning of Companies, Competitive Strategies, and Industry Risks

Request Free Sample

What are the Key Data Covered in this Animal Genetics Market Research and Growth Report?

  • CAGR of the Animal Genetics industry during the forecast period
  • Detailed information on factors that will drive the growth and forecasting between 2024 and 2028
  • Precise estimation of the size of the market and its contribution of the industry in focus to the parent market
  • Accurate predictions about upcoming growth and trends and changes in consumer behaviour
  • Growth of the market across North America, Europe, Asia, and Rest of World (ROW)
  • Thorough analysis of the market’s competitive landscape and detailed information about companies
  • Comprehensive analysis of factors that will challenge the animal genetics market growth of industry companies

We can help! Our analysts can customize this animal genetics market research report to meet your requirements.

Get in touch

1 Executive Summary

  • 1.1 Market overview
    • Exhibit 01: Executive Summary – Chart on Market Overview
    • Exhibit 02: Executive Summary – Data Table on Market Overview
    • Exhibit 03: Executive Summary – Chart on Global Market Characteristics
    • Exhibit 04: Executive Summary – Chart on Market by Geography
    • Exhibit 05: Executive Summary – Chart on Market Segmentation by End-user
    • Exhibit 06: Executive Summary – Chart on Market Segmentation by Solution
    • Exhibit 07: Executive Summary – Chart on Incremental Growth
    • Exhibit 08: Executive Summary – Data Table on Incremental Growth
    • Exhibit 09: Executive Summary – Chart on Vendor Market Positioning

2 Market Landscape

  • 2.1 Market ecosystem
    • Exhibit 10: Parent market
    • Exhibit 11: Market Characteristics

3 Market Sizing

  • 3.1 Market definition
    • Exhibit 12: Offerings of vendors included in the market definition
  • 3.2 Market segment analysis
    • Exhibit 13: Market segments
  • 3.3 Market size 2023
    • 3.4 Market outlook: Forecast for 2023-2028
      • Exhibit 14: Chart on Global - Market size and forecast 2023-2028 ($ million)
      • Exhibit 15: Data Table on Global - Market size and forecast 2023-2028 ($ million)
      • Exhibit 16: Chart on Global Market: Year-over-year growth 2023-2028 (%)
      • Exhibit 17: Data Table on Global Market: Year-over-year growth 2023-2028 (%)

    4 Historic Market Size

    • 4.1 Global animal genetics market 2018 - 2022
      • Exhibit 18: Historic Market Size – Data Table on global animal genetics market 2018 - 2022 ($ million)
    • 4.2 End-User Segment Analysis 2018 - 2022
      • Exhibit 19: Historic Market Size – End-User Segment 2018 - 2022 ($ million)
    • 4.3 Solution Segment Analysis 2018 - 2022
      • Exhibit 20: Historic Market Size – Solution Segment 2018 - 2022 ($ million)
    • 4.4 Geography Segment Analysis 2018 - 2022
      • Exhibit 21: Historic Market Size – Geography Segment 2018 - 2022 ($ million)
    • 4.5 Country Segment Analysis 2018 - 2022
      • Exhibit 22: Historic Market Size – Country Segment 2018 - 2022 ($ million)

    5 Five Forces Analysis

    • 5.1 Five forces summary
      • Exhibit 23: Five forces analysis - Comparison between 2023 and 2028
    • 5.2 Bargaining power of buyers
      • Exhibit 24: Chart on Bargaining power of buyers – Impact of key factors 2023 and 2028
    • 5.3 Bargaining power of suppliers
      • Exhibit 25: Bargaining power of suppliers – Impact of key factors in 2023 and 2028
    • 5.4 Threat of new entrants
      • Exhibit 26: Threat of new entrants – Impact of key factors in 2023 and 2028
    • 5.5 Threat of substitutes
      • Exhibit 27: Threat of substitutes – Impact of key factors in 2023 and 2028
    • 5.6 Threat of rivalry
      • Exhibit 28: Threat of rivalry – Impact of key factors in 2023 and 2028
    • 5.7 Market condition
      • Exhibit 29: Chart on Market condition - Five forces 2023 and 2028

    6 Market Segmentation by End-user

    • 6.1 Market segments
      • Exhibit 30: Chart on End-user - Market share 2023-2028 (%)
      • Exhibit 31: Data Table on End-user - Market share 2023-2028 (%)
    • 6.2 Comparison by End-user
      • Exhibit 32: Chart on Comparison by End-user
      • Exhibit 33: Data Table on Comparison by End-user
    • 6.3 Research centers - Market size and forecast 2023-2028
      • Exhibit 34: Chart on Research centers - Market size and forecast 2023-2028 ($ million)
      • Exhibit 35: Data Table on Research centers - Market size and forecast 2023-2028 ($ million)
      • Exhibit 36: Chart on Research centers - Year-over-year growth 2023-2028 (%)
      • Exhibit 37: Data Table on Research centers - Year-over-year growth 2023-2028 (%)
    • 6.4 Hospitals and clinics - Market size and forecast 2023-2028
      • Exhibit 38: Chart on Hospitals and clinics - Market size and forecast 2023-2028 ($ million)
      • Exhibit 39: Data Table on Hospitals and clinics - Market size and forecast 2023-2028 ($ million)
      • Exhibit 40: Chart on Hospitals and clinics - Year-over-year growth 2023-2028 (%)
      • Exhibit 41: Data Table on Hospitals and clinics - Year-over-year growth 2023-2028 (%)
    • 6.5 Diagnostic centers - Market size and forecast 2023-2028
      • Exhibit 42: Chart on Diagnostic centers - Market size and forecast 2023-2028 ($ million)
      • Exhibit 43: Data Table on Diagnostic centers - Market size and forecast 2023-2028 ($ million)
      • Exhibit 44: Chart on Diagnostic centers - Year-over-year growth 2023-2028 (%)
      • Exhibit 45: Data Table on Diagnostic centers - Year-over-year growth 2023-2028 (%)
    • 6.6 Market opportunity by End-user
      • Exhibit 46: Market opportunity by End-user ($ million)
      • Exhibit 47: Data Table on Market opportunity by End-user ($ million)

    7 Market Segmentation by Solution

    • 7.1 Market segments
      • Exhibit 48: Chart on Solution - Market share 2023-2028 (%)
      • Exhibit 49: Data Table on Solution - Market share 2023-2028 (%)
    • 7.2 Comparison by Solution
      • Exhibit 50: Chart on Comparison by Solution
      • Exhibit 51: Data Table on Comparison by Solution
    • 7.3 Live animal - Market size and forecast 2023-2028
      • Exhibit 52: Chart on Live animal - Market size and forecast 2023-2028 ($ million)
      • Exhibit 53: Data Table on Live animal - Market size and forecast 2023-2028 ($ million)
      • Exhibit 54: Chart on Live animal - Year-over-year growth 2023-2028 (%)
      • Exhibit 55: Data Table on Live animal - Year-over-year growth 2023-2028 (%)
    • 7.4 Genetic testing services - Market size and forecast 2023-2028
      • Exhibit 56: Chart on Genetic testing services - Market size and forecast 2023-2028 ($ million)
      • Exhibit 57: Data Table on Genetic testing services - Market size and forecast 2023-2028 ($ million)
      • Exhibit 58: Chart on Genetic testing services - Year-over-year growth 2023-2028 (%)
      • Exhibit 59: Data Table on Genetic testing services - Year-over-year growth 2023-2028 (%)
    • 7.5 Genetic materials - Market size and forecast 2023-2028
      • Exhibit 60: Chart on Genetic materials - Market size and forecast 2023-2028 ($ million)
      • Exhibit 61: Data Table on Genetic materials - Market size and forecast 2023-2028 ($ million)
      • Exhibit 62: Chart on Genetic materials - Year-over-year growth 2023-2028 (%)
      • Exhibit 63: Data Table on Genetic materials - Year-over-year growth 2023-2028 (%)
    • 7.6 Market opportunity by Solution
      • Exhibit 64: Market opportunity by Solution ($ million)
      • Exhibit 65: Data Table on Market opportunity by Solution ($ million)

    8 Market Segmentation by Animal

    • 8.1 Market segments
      • Chart on Animal - Market share (2023-2028) (%)
      • Data Table on Animal - Market share (2023-2028) (%)
    • 8.2 Comparison by Animal
      • Chart on Comparison by Animal
      • Data Table on Comparison by Animal
    • 8.3 Bovine - Market size and forecast (2023-2028)
      • Chart on Bovine - Market size and forecast (2023-2028) ($ million)
      • Data Table on Bovine - Market size and forecast (2023-2028) ($ million)
      • Chart on Bovine - Year-over-year growth (2023-2028) (%)
      • Data Table on Bovine - Year-over-year growth (2023-2028) (%)
    • 8.4 Porcine - Market size and forecast (2023-2028)
      • Chart on Porcine - Market size and forecast (2023-2028) ($ million)
      • Data Table on Porcine - Market size and forecast (2023-2028) ($ million)
      • Chart on Porcine - Year-over-year growth (2023-2028) (%)
      • Data Table on Porcine - Year-over-year growth (2023-2028) (%)
    • 8.5 Market opportunity by Animal
      • Market opportunity by $segment_name ($ million)
      • Data Table on Market opportunity by $segment_name ($ million)

    9 Market Segmentation by Technology

    • 9.1 Market segments
      • Chart on Technology - Market share (2023-2028) (%)
      • Data Table on Technology - Market share (2023-2028) (%)
    • 9.2 Comparison by Technology
      • Chart on Comparison by Technology
      • Data Table on Comparison by Technology
    • 9.3 PCR - Market size and forecast (2023-2028)
      • Chart on PCR - Market size and forecast (2023-2028) ($ million)
      • Data Table on PCR - Market size and forecast (2023-2028) ($ million)
      • Chart on PCR - Year-over-year growth (2023-2028) (%)
      • Data Table on PCR - Year-over-year growth (2023-2028) (%)
    • 9.4 NGS - Market size and forecast (2023-2028)
      • Chart on NGS - Market size and forecast (2023-2028) ($ million)
      • Data Table on NGS - Market size and forecast (2023-2028) ($ million)
      • Chart on NGS - Year-over-year growth (2023-2028) (%)
      • Data Table on NGS - Year-over-year growth (2023-2028) (%)
    • 9.5 rDNA - Market size and forecast (2023-2028)
      • Chart on rDNA - Market size and forecast (2023-2028) ($ million)
      • Data Table on rDNA - Market size and forecast (2023-2028) ($ million)
      • Chart on rDNA - Year-over-year growth (2023-2028) (%)
      • Data Table on rDNA - Year-over-year growth (2023-2028) (%)
    • 9.6 Microarray Technology - Market size and forecast (2023-2028)
      • Chart on Microarray Technology - Market size and forecast (2023-2028) ($ million)
      • Data Table on Microarray Technology - Market size and forecast (2023-2028) ($ million)
      • Chart on Microarray Technology - Year-over-year growth (2023-2028) (%)
      • Data Table on Microarray Technology - Year-over-year growth (2023-2028) (%)
    • 9.7 Market opportunity by Technology
      • Market opportunity by $segment_name ($ million)
      • Data Table on Market opportunity by $segment_name ($ million)

    8 Customer Landscape

    • 8.1 Customer landscape overview
      • Exhibit 66: Analysis of price sensitivity, lifecycle, customer purchase basket, adoption rates, and purchase criteria

    9 Geographic Landscape

    • 9.1 Geographic segmentation
      • Exhibit 67: Chart on Market share by geography 2023-2028 (%)
      • Exhibit 68: Data Table on Market share by geography 2023-2028 (%)
    • 9.2 Geographic comparison
      • Exhibit 69: Chart on Geographic comparison
      • Exhibit 70: Data Table on Geographic comparison
    • 9.3 North America - Market size and forecast 2023-2028
      • Exhibit 71: Chart on North America - Market size and forecast 2023-2028 ($ million)
      • Exhibit 72: Data Table on North America - Market size and forecast 2023-2028 ($ million)
      • Exhibit 73: Chart on North America - Year-over-year growth 2023-2028 (%)
      • Exhibit 74: Data Table on North America - Year-over-year growth 2023-2028 (%)
    • 9.4 Europe - Market size and forecast 2023-2028
      • Exhibit 75: Chart on Europe - Market size and forecast 2023-2028 ($ million)
      • Exhibit 76: Data Table on Europe - Market size and forecast 2023-2028 ($ million)
      • Exhibit 77: Chart on Europe - Year-over-year growth 2023-2028 (%)
      • Exhibit 78: Data Table on Europe - Year-over-year growth 2023-2028 (%)
    • 9.5 Asia - Market size and forecast 2023-2028
      • Exhibit 79: Chart on Asia - Market size and forecast 2023-2028 ($ million)
      • Exhibit 80: Data Table on Asia - Market size and forecast 2023-2028 ($ million)
      • Exhibit 81: Chart on Asia - Year-over-year growth 2023-2028 (%)
      • Exhibit 82: Data Table on Asia - Year-over-year growth 2023-2028 (%)
    • 9.6 Rest of World (ROW) - Market size and forecast 2023-2028
      • Exhibit 83: Chart on Rest of World (ROW) - Market size and forecast 2023-2028 ($ million)
      • Exhibit 84: Data Table on Rest of World (ROW) - Market size and forecast 2023-2028 ($ million)
      • Exhibit 85: Chart on Rest of World (ROW) - Year-over-year growth 2023-2028 (%)
      • Exhibit 86: Data Table on Rest of World (ROW) - Year-over-year growth 2023-2028 (%)
    • 9.7 US - Market size and forecast 2023-2028
      • Exhibit 87: Chart on US - Market size and forecast 2023-2028 ($ million)
      • Exhibit 88: Data Table on US - Market size and forecast 2023-2028 ($ million)
      • Exhibit 89: Chart on US - Year-over-year growth 2023-2028 (%)
      • Exhibit 90: Data Table on US - Year-over-year growth 2023-2028 (%)
    • 9.8 Germany - Market size and forecast 2023-2028
      • Exhibit 91: Chart on Germany - Market size and forecast 2023-2028 ($ million)
      • Exhibit 92: Data Table on Germany - Market size and forecast 2023-2028 ($ million)
      • Exhibit 93: Chart on Germany - Year-over-year growth 2023-2028 (%)
      • Exhibit 94: Data Table on Germany - Year-over-year growth 2023-2028 (%)
    • 9.9 UK - Market size and forecast 2023-2028
      • Exhibit 95: Chart on UK - Market size and forecast 2023-2028 ($ million)
      • Exhibit 96: Data Table on UK - Market size and forecast 2023-2028 ($ million)
      • Exhibit 97: Chart on UK - Year-over-year growth 2023-2028 (%)
      • Exhibit 98: Data Table on UK - Year-over-year growth 2023-2028 (%)
    • 9.10 France - Market size and forecast 2023-2028
      • Exhibit 99: Chart on France - Market size and forecast 2023-2028 ($ million)
      • Exhibit 100: Data Table on France - Market size and forecast 2023-2028 ($ million)
      • Exhibit 101: Chart on France - Year-over-year growth 2023-2028 (%)
      • Exhibit 102: Data Table on France - Year-over-year growth 2023-2028 (%)
    • 9.11 China - Market size and forecast 2023-2028
      • Exhibit 103: Chart on China - Market size and forecast 2023-2028 ($ million)
      • Exhibit 104: Data Table on China - Market size and forecast 2023-2028 ($ million)
      • Exhibit 105: Chart on China - Year-over-year growth 2023-2028 (%)
      • Exhibit 106: Data Table on China - Year-over-year growth 2023-2028 (%)
    • 9.12 Market opportunity by geography
      • Exhibit 107: Market opportunity by geography ($ million)
      • Exhibit 108: Data Tables on Market opportunity by geography ($ million)
    • 11.13 US - Market size and forecast (2023-2028)
      • Chart on US - Market size and forecast (2023-2028) ($ million)
      • Data Table on US - Market size and forecast (2023-2028) ($ million)
      • Chart on US - Year-over-year growth (2023-2028) (%)
      • Data Table on US - Year-over-year growth (2023-2028) (%)
    • 11.14 Germany - Market size and forecast (2023-2028)
      • Chart on Germany - Market size and forecast (2023-2028) ($ million)
      • Data Table on Germany - Market size and forecast (2023-2028) ($ million)
      • Chart on Germany - Year-over-year growth (2023-2028) (%)
      • Data Table on Germany - Year-over-year growth (2023-2028) (%)
    • 11.15 UK - Market size and forecast (2023-2028)
      • Chart on UK - Market size and forecast (2023-2028) ($ million)
      • Data Table on UK - Market size and forecast (2023-2028) ($ million)
      • Chart on UK - Year-over-year growth (2023-2028) (%)
      • Data Table on UK - Year-over-year growth (2023-2028) (%)
    • 11.16 France - Market size and forecast (2023-2028)
      • Chart on France - Market size and forecast (2023-2028) ($ million)
      • Data Table on France - Market size and forecast (2023-2028) ($ million)
      • Chart on France - Year-over-year growth (2023-2028) (%)
      • Data Table on France - Year-over-year growth (2023-2028) (%)
    • 11.17 China - Market size and forecast (2023-2028)
      • Chart on China - Market size and forecast (2023-2028) ($ million)
      • Data Table on China - Market size and forecast (2023-2028) ($ million)
      • Chart on China - Year-over-year growth (2023-2028) (%)
      • Data Table on China - Year-over-year growth (2023-2028) (%)

    10 Drivers, Challenges, and Trends

    • 10.1 Market drivers
      • 10.2 Market challenges
        • 10.3 Impact of drivers and challenges
          • Exhibit 109: Impact of drivers and challenges in 2023 and 2028
        • 10.4 Market trends

          11 Vendor Landscape

          • 11.1 Overview
            • 11.2 Vendor landscape
              • Exhibit 110: Overview on Criticality of inputs and Factors of differentiation
            • 11.3 Landscape disruption
              • Exhibit 111: Overview on factors of disruption
            • 11.4 Industry risks
              • Exhibit 112: Impact of key risks on business

            12 Vendor Analysis

            • 12.1 Vendors covered
              • Exhibit 113: Vendors covered
            • 12.2 Market positioning of vendors
              • Exhibit 114: Matrix on vendor position and classification
            • 12.3 Animal Genetics Inc.
              • Exhibit 115: Animal Genetics Inc. - Overview
              • Exhibit 116: Animal Genetics Inc. - Product / Service
              • Exhibit 117: Animal Genetics Inc. - Key offerings
            • 12.4 Aviagen Group
              • Exhibit 118: Aviagen Group - Overview
              • Exhibit 119: Aviagen Group - Product / Service
              • Exhibit 120: Aviagen Group - Key offerings
            • 12.5 EasyDNA
              • Exhibit 121: EasyDNA - Overview
              • Exhibit 122: EasyDNA - Product / Service
              • Exhibit 123: EasyDNA - Key offerings
            • 12.6 Genus Plc
              • Exhibit 124: Genus Plc - Overview
              • Exhibit 125: Genus Plc - Business segments
              • Exhibit 126: Genus Plc - Key offerings
              • Exhibit 127: Genus Plc - Segment focus
            • 12.7 Groupe Grimaud
              • Exhibit 128: Groupe Grimaud - Overview
              • Exhibit 129: Groupe Grimaud - Product / Service
              • Exhibit 130: Groupe Grimaud - Key offerings
            • 12.8 Hendrix Genetics BV
              • Exhibit 131: Hendrix Genetics BV - Overview
              • Exhibit 132: Hendrix Genetics BV - Product / Service
              • Exhibit 133: Hendrix Genetics BV - Key offerings
            • 12.9 Neogen Corp.
              • Exhibit 134: Neogen Corp. - Overview
              • Exhibit 135: Neogen Corp. - Business segments
              • Exhibit 136: Neogen Corp. - Key news
              • Exhibit 137: Neogen Corp. - Key offerings
              • Exhibit 138: Neogen Corp. - Segment focus
            • 12.10 Sandor Animal Biogenics Pvt. Ltd.
              • Exhibit 139: Sandor Animal Biogenics Pvt. Ltd. - Overview
              • Exhibit 140: Sandor Animal Biogenics Pvt. Ltd. - Product / Service
              • Exhibit 141: Sandor Animal Biogenics Pvt. Ltd. - Key offerings
            • 12.11 Superior Animal Genetics
              • Exhibit 142: Superior Animal Genetics - Overview
              • Exhibit 143: Superior Animal Genetics - Product / Service
              • Exhibit 144: Superior Animal Genetics - Key offerings
            • 12.12 SWINE GENETICS INTERNATIONAL
              • Exhibit 145: SWINE GENETICS INTERNATIONAL - Overview
              • Exhibit 146: SWINE GENETICS INTERNATIONAL - Product / Service
              • Exhibit 147: SWINE GENETICS INTERNATIONAL - Key offerings
            • 12.13 TOPIGS NORSVIN
              • Exhibit 148: TOPIGS NORSVIN - Overview
              • Exhibit 149: TOPIGS NORSVIN - Product / Service
              • Exhibit 150: TOPIGS NORSVIN - Key offerings
            • 12.14 Tropical Animal Genetics
              • Exhibit 151: Tropical Animal Genetics - Overview
              • Exhibit 152: Tropical Animal Genetics - Product / Service
              • Exhibit 153: Tropical Animal Genetics - Key offerings
            • 12.15 URUS Group LP
              • Exhibit 154: URUS Group LP - Overview
              • Exhibit 155: URUS Group LP - Product / Service
              • Exhibit 156: URUS Group LP - Key offerings
            • 12.16 Vaxxinova International BV
              • Exhibit 157: Vaxxinova International BV - Overview
              • Exhibit 158: Vaxxinova International BV - Product / Service
              • Exhibit 159: Vaxxinova International BV - Key offerings
            • 12.17 Zoetis Inc.
              • Exhibit 160: Zoetis Inc. - Overview
              • Exhibit 161: Zoetis Inc. - Business segments
              • Exhibit 162: Zoetis Inc. - Key news
              • Exhibit 163: Zoetis Inc. - Key offerings
              • Exhibit 164: Zoetis Inc. - Segment focus

            13 Appendix

            • 13.1 Scope of the report
              • 13.2 Inclusions and exclusions checklist
                • Exhibit 165: Inclusions checklist
                • Exhibit 166: Exclusions checklist
              • 13.3 Currency conversion rates for US$
                • Exhibit 167: Currency conversion rates for US$
              • 13.4 Research methodology
                • Exhibit 168: Research methodology
                • Exhibit 169: Validation techniques employed for market sizing
                • Exhibit 170: Information sources
              • 13.5 List of abbreviations
                • Exhibit 171: List of abbreviations

              Research Methodology

              Technavio presents a detailed picture of the market by way of study, synthesis, and summation of data from multiple sources. The analysts have presented the various facets of the market with a particular focus on identifying the key industry influencers. The data thus presented is comprehensive, reliable, and the result of extensive research, both primary and secondary.

              INFORMATION SOURCES

              Primary sources

              • Manufacturers and suppliers
              • Channel partners
              • Industry experts
              • Strategic decision makers

              Secondary sources

              • Industry journals and periodicals
              • Government data
              • Financial reports of key industry players
              • Historical data
              • Press releases

              DATA ANALYSIS

              Data Synthesis

              • Collation of data
              • Estimation of key figures
              • Analysis of derived insights

              Data Validation

              • Triangulation with data models
              • Reference against proprietary databases
              • Corroboration with industry experts

              REPORT WRITING

              Qualitative

              • Market drivers
              • Market challenges
              • Market trends
              • Five forces analysis

              Quantitative

              • Market size and forecast
              • Market segmentation
              • Geographical insights
              • Competitive landscape

              Interested in this report?

              Get your sample now to see our research methodology and insights!

              Download Now

              Frequently Asked Questions

              Animal Genetics market growth will increase by $ 2.59 bn during 2024-2028.

              The Animal Genetics market is expected to grow at a CAGR of 7.45% during 2024-2028.

              Animal Genetics market is segmented by End-user( Research centers, Hospitals and clinics, Diagnostic centers) Solution( Live animal, Genetic testing services, Genetic materials, ROW)

              EasyDNA, Inguran LLC, Neogen Corp., URUS Group LP, VikingGenetics F.M.B.A, Zoetis Inc., Animal Genetics Inc., Aviagen Group,  DNA Genetics, Genus Plc, Groupe Grimaud, Hendrix Genetics BV, Koko Genetics, Sandor Animal Biogenics Pvt. Ltd., Superior Animal Genetics, SWINE GENETICS INTERNATIONAL, TOPIGS NORSVIN, Trans Ova Genetics, Tropical Animal Genetics, Vaxxinova International BV are a few of the key vendors in the Animal Genetics market.

              Europe will register the highest growth rate of 34% among the other regions. Therefore, the Animal Genetics market in Europe is expected to garner significant business opportunities for the vendors during the forecast period.

              US, Germany, UK, France, China, India, Japan, Canada, South Africa, US, Germany, UK, France, China, US, Germany, UK, France, China

              • Growing demand for genetic testing services for companion animalsPet owners increasingly seek genetic testing to screen their pets for inheritable diseases and genetic predispositions. Early detection of genetic health risks allows for proactive management and treatment is the driving factor this market.
              • improving the overall health and well-being of companion animals. Genetic testing can provide insights into the ancestry and breed composition of mixed-breed or rescue animals. Pet owners are often curious about their pets genetic background and characteristics is the driving factor this market.
              • which can help in understanding behavior is the driving factor this market.
              • predicting size is the driving factor this market.
              • and addressing breed-specific health concerns. Genetic testing is being used to identify genetic markers associated with behavioral traits such as aggression is the driving factor this market.
              • anxiety is the driving factor this market.
              • and trainability in dogs. Understanding the genetic basis of behavior can aid in training and behavior modification programs is the driving factor this market.
              • enhancing the bond between pets and their owners. Genetic testing can inform personalized health management plans for individual pets is the driving factor this market.
              • including dietary recommendations is the driving factor this market.
              • exercise regimens is the driving factor this market.
              • and preventive care strategies tailored to their genetic predispositions and risk factors. Breeders use genetic testing to make informed breeding decisions aimed at reducing the incidence of inherited diseases is the driving factor this market.
              • improving breed health is the driving factor this market.
              • and preserving genetic diversity. Genetic testing helps in selecting breeding pairs with compatible genetic profiles and reducing the transmission of genetic disorders to offspring. Increased awareness of the role of genetics in companion animal health and welfare has led to a growing demand for genetic testing among pet owners. Veterinary clinics is the driving factor this market.
              • breeders is the driving factor this market.
              • and pet retailers often offer genetic testing services to meet this demand and provide value-added services to their clients. As genetic testing technologies continue to advance and awareness of genetic issues grows is the driving factor this market.
              • the demand for genetic testing services for companion animals is expected to continue rising is the driving factor this market.
              • which will positively impact the growth of the global animal genetics market during the forecast period.   is the driving factor this market.

              The Animal Genetics market vendors should focus on grabbing business opportunities from the Research centers segment as it accounted for the largest market share in the base year.
              RIA - Research AI Assistant
              Ask RIA