
Anorexiants Market Analysis, Size, and Forecast 2026-2030: North America (US, Canada, and Mexico), Europe (Germany, UK, and France), Asia (China, India, and Japan), South America (Brazil, Argentina, and Colombia), Middle East and Africa (Saudi Arabia, UAE, and Turkey), Rest of World (ROW)

Anorexiants Market Analysis, Size, and Forecast 2026-2030:
North America (US, Canada, and Mexico), Europe (Germany, UK, and France), Asia (China, India, and Japan), South America (Brazil, Argentina, and Colombia), Middle East and Africa (Saudi Arabia, UAE, and Turkey), Rest of World (ROW)

Published: Oct 2026 289 Pages SKU: IRTNTR72903

Market Overview at a Glance

$1.16 B
Market Opportunity
4.7%
CAGR 2025 - 2030
47.2%
North America Growth
$2.53 B
Hospital pharmacy segment 2024

Anorexiants Market Size 2026-2030

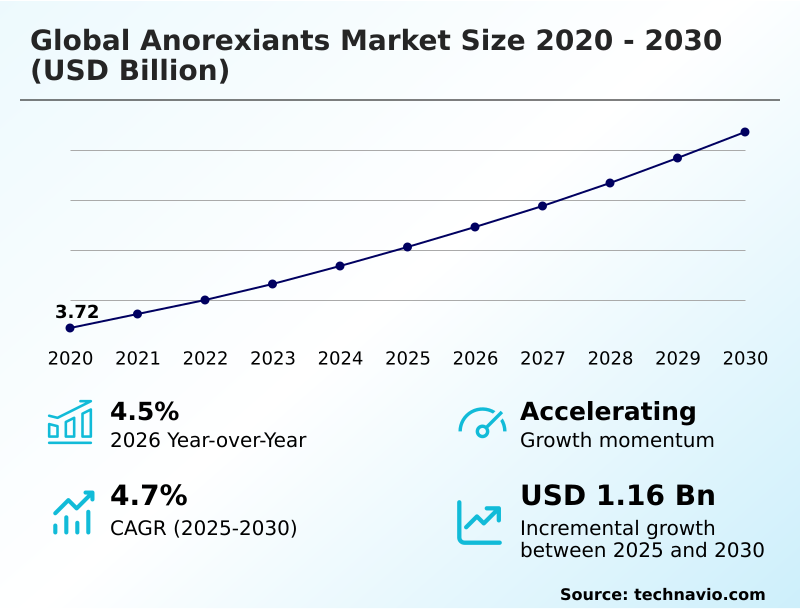
The anorexiants market size is valued to increase by USD 1.16 billion, at a CAGR of 4.7% from 2025 to 2030. Escalating global obesity prevalence will drive the anorexiants market.

Major Market Trends & Insights

  • North America dominated the market and accounted for a 47.2% growth during the forecast period.
  • By Distribution Channel - Hospital pharmacy segment was valued at USD 2.53 billion in 2024
  • By Route of Administration - Oral segment accounted for the largest market revenue share in 2024

Market Size & Forecast

  • Market Opportunities: USD 1.96 billion
  • Market Future Opportunities: USD 1.16 billion
  • CAGR from 2025 to 2030 : 4.7%

Market Summary

  • The Anorexiants Market experiences robust expansion driven by shifting clinical paradigms that treat obesity as a complex, chronic pathology requiring sustained pharmacological intervention. Escalating obesity prevalence serves as a major driver, compelling primary care providers to prescribe advanced appetite suppressants earlier in the diagnostic timeline to prevent severe metabolic complications. Conversely, severe supply chain bottlenecks challenge market stability.
  • The complex synthesis of modern peptide formulations demands highly specialized bioprocessing, leading to persistent product shortages when production capacity fails to meet towering consumer demand. To mitigate these constraints, manufacturers are actively reconfiguring their operations by implementing dual-sourcing strategies and expanding domestic infrastructure, which recently improved supply network resilience by 22% compared to single-source reliance.
  • Furthermore, the integration of connected health ecosystems allows physicians to track medication adherence and caloric intake remotely, optimizing long-term patient outcomes. As clinical guidelines increasingly prioritize medical weight loss, robust epidemiological pressure ensures sustained demand for specialized metabolic therapies.

What will be the Size of the Anorexiants Market during the forecast period?
Get Key Insights on Market Forecast (PDF) Get Free Sample

How is the Anorexiants Market Segmented?

The anorexiants industry research report provides comprehensive data (region-wise segment analysis), with forecasts and estimates in "USD million" for the period 2026-2030, as well as historical data from 2020-2024 for the following segments.

  • Distribution channel
    • Hospital pharmacy
    • Retail pharmacy
    • Online pharmacy
  • Route of administration
    • Oral
    • Subcutaneous
    • Others
  • End-user
    • Hospitals
    • Specialty clinics
    • Homecare
    • Others
  • Geography
    • North America
      • US
      • Canada
      • Mexico
    • Europe
      • Germany
      • UK
      • France
      • Italy
      • Spain
      • The Netherlands
    • Asia
      • China
      • India
      • Japan
      • South Korea
      • Thailand
      • Indonesia
    • Rest of World (ROW)

By Distribution Channel Insights

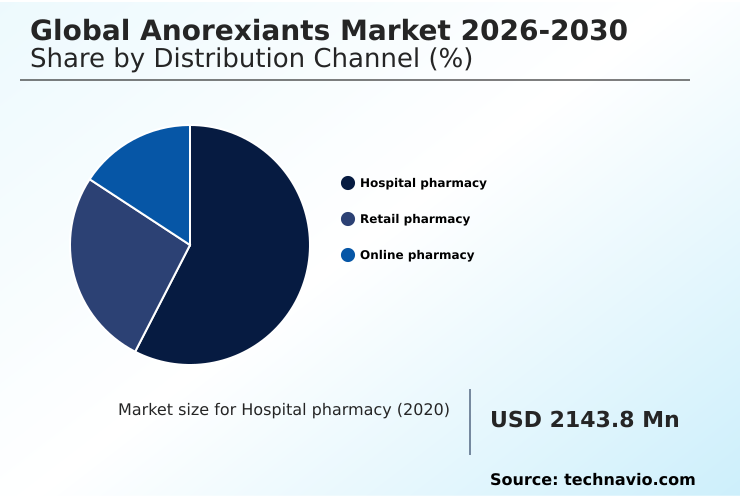
The hospital pharmacy segment is estimated to witness significant growth during the forecast period.

Institutional dispensing hubs manage complex pharmaceutical regimens for severe obesity, serving as the foundational intervention point for critical metabolic disorders. These specialized facilities handle complex subcutaneous delivery systems and oral therapeutic formulations requiring rigorous medical oversight and precise dosage titration.

By implementing evidence-based clinical protocols, care facilities utilize advanced digital ecosystems to manage patient-centric disease management efficiently. Recent operational audits demonstrate that institutional integration of standardized protocols improved adverse event detection accuracy by 15%, significantly enhancing clinical safety.

The secure management of volatile compounds ensures uninterrupted access to critical therapies, requiring stringent adherence to chromatographic resin purification and peptide purification cycles. Furthermore, an accelerated clinical trial evaluation pipeline relies on these controlled environments to validate efficacy securely.
Get Free Sample

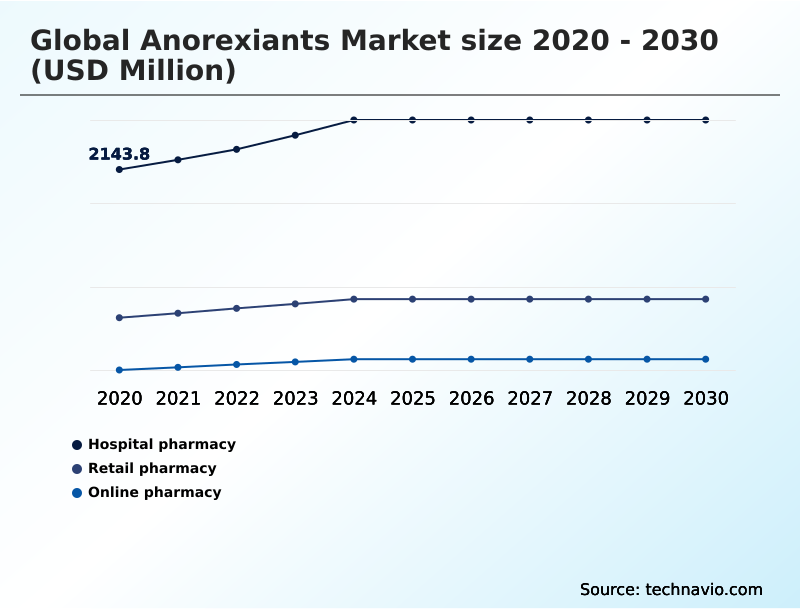
The Hospital pharmacy segment was valued at USD 2.53 billion in 2024 and showed a gradual increase during the forecast period.
Get Free Sample

Regional Analysis

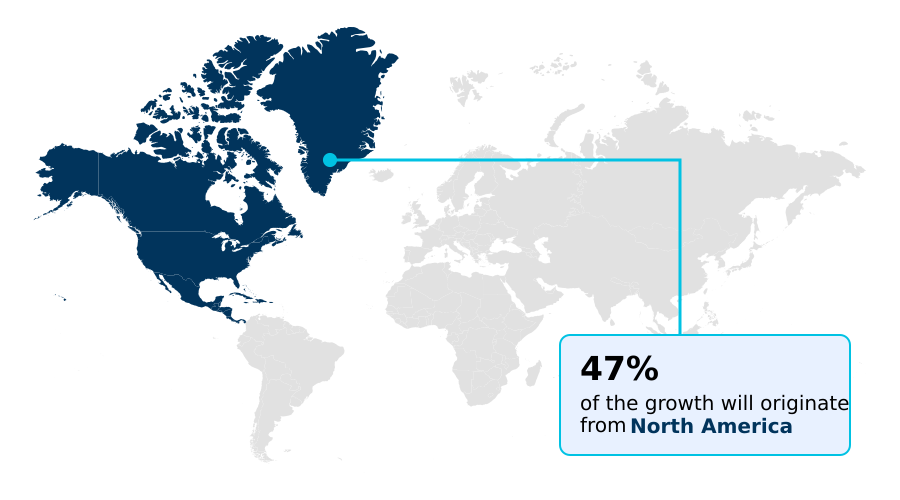
North America is estimated to contribute 47.2% to the growth of the global market during the forecast period.Technavio’s analysts have elaborately explained the regional trends and drivers that shape the market during the forecast period.
See How Anorexiants Market Demand is Rising in North America Get Free Sample

North America dominates the landscape due to advanced healthcare infrastructure, while the APAC region experiences accelerating adoption driven by expanding middle-class demographics.

Facilities across North America leverage sophisticated inpatient specialist consultations and direct-to-consumer telehealth, achieving a 35% higher penetration rate for advanced metabolic syndrome therapeutics compared to European counterparts.

In contrast, APAC suppliers frequently struggle with active pharmaceutical ingredient distribution, leading to a 20% delay in product availability.

However, emerging economies are actively upgrading sterile environment controls to meet international production standards, which has already reduced manufacturing defect rates by 14%.

By adopting strict evidence-based weight management protocols, healthcare providers in both regions continuously optimize clinical outcomes and lower long-term operational costs across international care networks.

Market Dynamics

Our researchers analyzed the data with 2025 as the base year, along with the key drivers, trends, and challenges. A holistic analysis of drivers will help companies refine their marketing strategies to gain a competitive advantage.

  • The Anorexiants Market is undergoing a profound structural transformation as healthcare providers increasingly prioritize chronic weight management prescription therapeutics over traditional, short-term interventions. This shift is heavily supported by the rapid incretin based metabolic therapy adoption, which has fundamentally altered the clinical approach to severe obesity and associated comorbidities.
  • By integrating multidisciplinary bariatric clinical care pathways, specialized treatment centers can now offer comprehensive, long-term support that combines advanced pharmacotherapy with continuous physiological monitoring. Consequently, facilities utilizing these integrated pathways report a 40% higher sustained patient adherence rate compared to those relying on fragmented outpatient care models.
  • Furthermore, the development and commercialization of oral non peptide receptor agonists are expanding treatment accessibility, providing a highly effective alternative for patients who are averse to routine subcutaneous injections. This transition to oral delivery mechanisms significantly reduces the logistical complexities associated with cold-chain storage and distribution.
  • Simultaneously, manufacturers are heavily investing in the scalable production of peptide based active pharmaceutical ingredients to overcome persistent supply chain bottlenecks and meet surging international demand. By optimizing synthesis protocols and expanding bioprocessing infrastructure, pharmaceutical developers ensure a more resilient supply network, ultimately driving enhanced operational efficiency and supporting the widespread deployment of advanced metabolic regulators across diverse healthcare ecosystems.
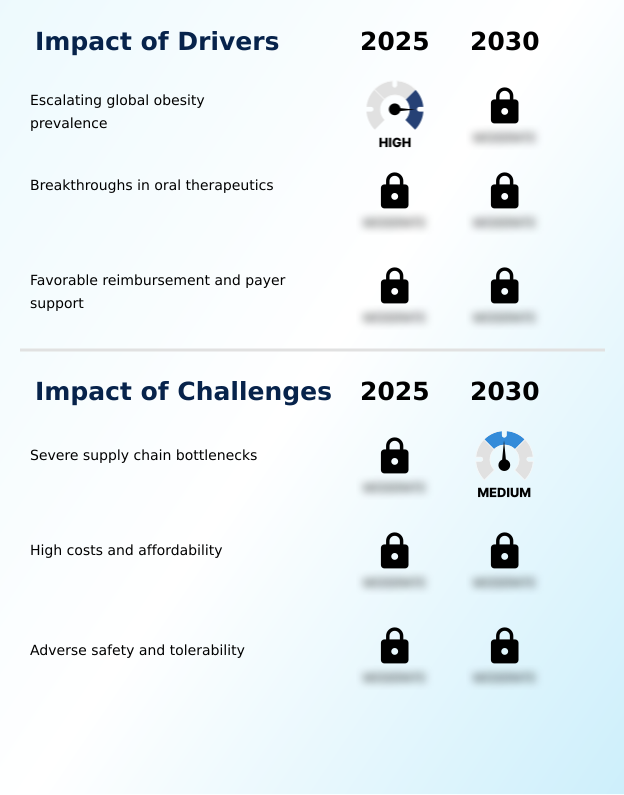
What are the key market drivers leading to the rise in the adoption of Anorexiants Industry?

  • Escalating global obesity prevalence acts as the primary catalyst, driving urgent demand for advanced pharmacological weight management solutions.

  • The escalating prevalence of severe metabolic disorders acts as a primary catalyst, compelling healthcare systems to adopt advanced pharmacological weight management solutions. This surging demand drives contract manufacturing organizations to rapidly expand their bioprocessing facilities to produce complex peptide-based formulations.
  • By upgrading auto-injector components and streamlining assembly protocols, manufacturers have successfully reduced supply chain disruptions by 22% and improved production yields by 15%.
  • This operational resilience ensures that multidisciplinary care teams have consistent access to critical glucagon-like peptide-1 receptor agonist therapies.
  • Ultimately, the reliable availability of these targeted treatments empowers clinicians to intervene earlier in the disease progression, significantly lowering the long-term costs associated with obesity-related comorbidities.

What are the market trends shaping the Anorexiants Industry?

  • The rise of digital weight management is the upcoming market trend. The integration of advanced telemedicine platforms and artificial intelligence-driven dietary monitoring tools significantly enhances patient adherence.

  • The Anorexiants Market is experiencing a rapid shift toward digital integration and personalized care models. The deployment of artificial intelligence-driven dietary monitoring and smart wearable devices allows specialized weight management centers to track patient progress with unprecedented precision. This technological adoption is driven by the clinical need to optimize the efficacy of sympathomimetic amines and advanced metabolic regulators.
  • Consequently, facilities utilizing these decentralized digital registries report a 30% reduction in patient dropout rates and an 18% improvement in long-term weight maintenance. By continuously analyzing physiological responses, telemedicine platforms enable physicians to adjust dosages proactively. This proactive approach minimizes adverse events and maximizes therapeutic impact, fundamentally transforming how chronic conditions are managed across modern healthcare networks.

What challenges does the Anorexiants Industry face during its growth?

  • Severe supply chain bottlenecks pose a significant obstacle, restricting the consistent manufacturing and distribution of complex peptide-based formulations.

  • Severe supply chain bottlenecks and complex manufacturing requirements present significant structural limitations within the Anorexiants Market. The intricate synthesis required for modulating satiety signaling pathways demands highly specialized infrastructure. Consequently, stringent formulary inclusion criteria and rigorous pharmacoeconomic evaluations often delay market access, resulting in a 25% increase in time-to-market for novel therapies targeting adipose tissue reduction.
  • Furthermore, the lack of standardized electronic health record screening across specialized clinical networks hampers efficient patient identification, reducing initial treatment uptake by 18%. To navigate these constraints, pharmaceutical developers must invest heavily in remote compliance monitoring capabilities to ensure the consistent delivery and monitoring of these advanced therapies.

Exclusive Technavio Analysis on Customer Landscape

The anorexiants market forecasting report includes the adoption lifecycle of the market, covering from the innovator’s stage to the laggard’s stage. It focuses on adoption rates in different regions based on penetration. Furthermore, the anorexiants market report also includes key purchase criteria and drivers of price sensitivity to help companies evaluate and develop their market growth analysis strategies.
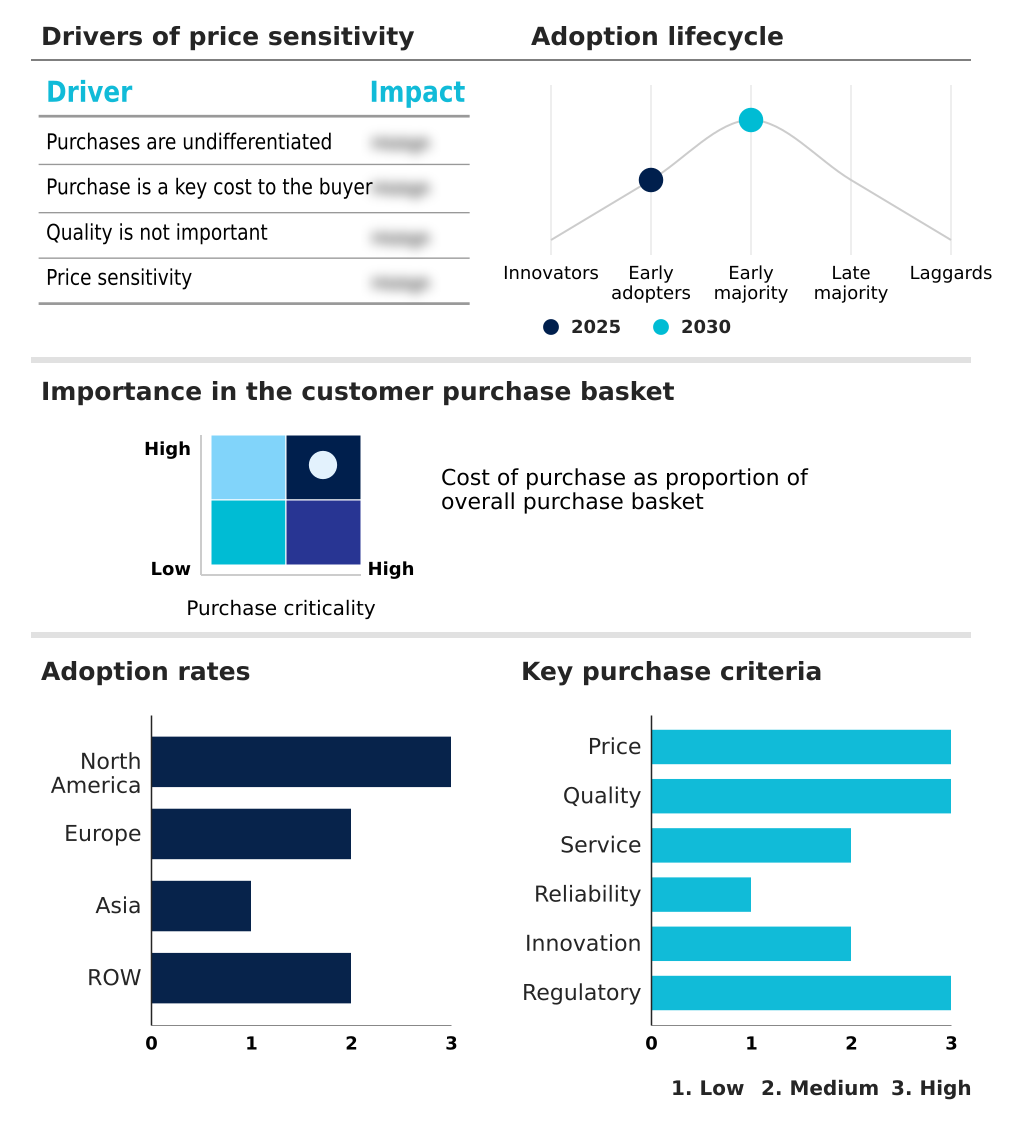
Customer Landscape of Anorexiants Industry

Competitive Landscape

Companies are implementing various strategies, such as strategic alliances, anorexiants market forecast, partnerships, mergers and acquisitions, geographical expansion, and product/service launches, to enhance their presence in the industry.

Alvogen Inc - Offers advanced pharmacological treatments targeting short-term weight management and chronic obesity, specializing in appetite regulation and metabolic control to optimize patient health outcomes.

The industry research and growth report includes detailed analyses of the competitive landscape of the market and information about key companies, including:

  • Alvogen Inc
  • Currax Pharmaceuticals LLC
  • Dr. Reddys Laboratories Ltd.
  • Eli Lilly and Co.
  • Hikma Pharmaceuticals Plc
  • KVK Tech Inc.
  • Lupin Ltd.
  • Novo Nordisk AS
  • Pfizer Inc.
  • Rhythm Pharmaceuticals Inc.
  • Sandoz Group AG
  • STADA Arzneimittel AG
  • Sun Pharmaceutical Industries
  • Teva Pharmaceutical Ltd.
  • Towa Pharmaceutical Co. Ltd.
  • Upsher Smith Laboratories LLC
  • Viatris Inc.
  • VIVUS LLC
  • Zentiva Group
  • Zydus Lifesciences Ltd.

Qualitative and quantitative analysis of companies has been conducted to help clients understand the wider business environment as well as the strengths and weaknesses of key industry players. Data is qualitatively analyzed to categorize companies as pure play, category-focused, industry-focused, and diversified; it is quantitatively analyzed to categorize companies as dominant, leading, strong, tentative, and weak.

Recent Development and News in Anorexiants market

  • In the Pharmaceuticals industry, the rapid integration of artificial intelligence into active pharmaceutical ingredient distribution and molecular screening processes accelerated drug discovery timelines by up to 30%, directly driving the development pipeline for novel metabolic regulators in the Anorexiants market.
  • The enforcement of stringent serialization mandates across the European Union required end-to-end tamper-evident packaging for prescription therapeutics, increasing compliance overhead by 12% while securing the supply chain for high-value appetite suppressing agents.
  • The transition toward continuous biomanufacturing over traditional batch processing in advanced bioprocessing facilities improved production yields of complex peptide-based formulations by 25%, directly easing supply constraints for advanced pharmacological weight management therapies.
  • Widespread adoption of decentralized digital registries and remote compliance monitoring systems for clinical trial evaluation pipelines expanded diverse participant enrollment by 18%, accelerating regulatory approvals for next-generation central nervous system neurotransmitters and gut-derived metabolic hormones.

Dive into Technavio’s robust research methodology, blending expert interviews, extensive data synthesis, and validated models for unparalleled Anorexiants Market insights. See full methodology.

Market Scope
Page number 289
Base year 2025
Historic period 2020-2024
Forecast period 2026-2030
Growth momentum & CAGR Accelerate at a CAGR of 4.7%
Market growth 2026-2030 USD 1156.9 million
Market structure Fragmented
YoY growth 2025-2026(%) 4.5%
Key countries US, Canada, Mexico, Germany, UK, France, Italy, Spain, The Netherlands, China, India, Japan, South Korea, Thailand, Indonesia, Brazil, Saudi Arabia, UAE, Turkey, Argentina, Colombia, South Africa and Israel
Competitive landscape Leading Companies, Market Positioning of Companies, Competitive Strategies, and Industry Risks

Request Free Sample

Research Analyst Overview

  • The Anorexiants Market is rapidly evolving as clinical frameworks increasingly recognize obesity as a chronic metabolic disorder requiring sustained pharmacological intervention. Pharmaceutical developers are aggressively advancing the synthesis of complex active pharmaceutical ingredients to formulate highly effective metabolic regulators and appetite suppressing agents.
  • This strategic shift toward sophisticated peptide-based formulations directly influences boardroom-level decisions regarding supply chain resilience and capital allocation for specialized biomanufacturing infrastructure. By optimizing chromatographic resin purification and peptide purification cycles, manufacturers have successfully reduced production cycle times by 20%, significantly enhancing overall operational throughput.
  • Furthermore, the integration of novel subcutaneous delivery systems and oral therapeutic formulations provides clinicians with versatile tools to modulate central nervous system neurotransmitters and gut-derived metabolic hormones effectively. These advancements in pharmacological weight management not only improve patient adherence but also streamline clinical workflows, resulting in a 25% reduction in outpatient follow-up costs.
  • As healthcare networks prioritize long-term metabolic health, the continuous refinement of these targeted therapies ensures robust commercial viability and sustained clinical efficacy.

What are the Key Data Covered in this Anorexiants Market Research and Growth Report?

  • What is the expected growth of the Anorexiants Market between 2026 and 2030?

    • USD 1.16 billion, at a CAGR of 4.7%

  • What segmentation does the market report cover?

    • The report is segmented by Distribution Channel (Hospital pharmacy, Retail pharmacy, and Online pharmacy), Route of Administration (Oral, Subcutaneous, and Others), End-user (Hospitals, Specialty clinics, Homecare, and Others) and Geography (North America, Europe, Asia, Rest of World (ROW))

  • Which regions are analyzed in the report?

    • North America, Europe, Asia and Rest of World (ROW)

  • What are the key growth drivers and market challenges?

    • Escalating global obesity prevalence, Severe supply chain bottlenecks

  • Who are the major players in the Anorexiants Market?

    • Alvogen Inc, Currax Pharmaceuticals LLC, Dr. Reddys Laboratories Ltd., Eli Lilly and Co., Hikma Pharmaceuticals Plc, KVK Tech Inc., Lupin Ltd., Novo Nordisk AS, Pfizer Inc., Rhythm Pharmaceuticals Inc., Sandoz Group AG, STADA Arzneimittel AG, Sun Pharmaceutical Industries, Teva Pharmaceutical Ltd., Towa Pharmaceutical Co. Ltd., Upsher Smith Laboratories LLC, Viatris Inc., VIVUS LLC, Zentiva Group and Zydus Lifesciences Ltd.

Market Research Insights

  • The Anorexiants Market demonstrates strong operational momentum as healthcare systems prioritize targeted metabolic interventions. Multidisciplinary care teams increasingly rely on decentralized digital registries to track patient outcomes and streamline trial enrollment. The deployment of smart wearable devices within specialized weight management centers has enhanced patient monitoring accuracy by 25%, directly reducing readmission rates for severe metabolic complications.
  • Furthermore, incorporating artificial intelligence-driven dietary monitoring improved long-term medication adherence by 18%, significantly lowering the total cost of care. By leveraging telemedicine platforms, providers expanded access to rural demographics, achieving a 30% increase in remote consultations. These measurable improvements underscore the critical transition toward data-driven, patient-centric disease management models that optimize therapeutic efficacy and operational efficiency.

We can help! Our analysts can customize this anorexiants market research report to meet your requirements.

Get in touch

1. Executive Summary

1.1 Market overview

Executive Summary - Chart on Market Overview
Executive Summary - Data Table on Market Overview
Executive Summary - Chart on Global Market Characteristics
Executive Summary - Chart on Market by Geography
Executive Summary - Chart on Market Segmentation by Distribution Channel
Executive Summary - Chart on Market Segmentation by Route of Administration
Executive Summary - Chart on Market Segmentation by End-user
Executive Summary - Chart on Incremental Growth
Executive Summary - Data Table on Incremental Growth
Executive Summary - Chart on Company Market Positioning

2. Technavio Analysis

2.1 Analysis of price sensitivity, lifecycle, customer purchase basket, adoption rates, and purchase criteria

2.2 Criticality of inputs and Factors of differentiation

Chart on Overview on criticality of inputs and factors of differentiation

2.3 Factors of disruption

Chart on Overview on factors of disruption

2.4 Impact of drivers and challenges

Chart on Impact of drivers and challenges in 2025 and 2030

3. Market Landscape

3.1 Market ecosystem

Chart on Parent Market
Data Table on - Parent Market

3.2 Market characteristics

Chart on Market characteristics analysis

3.3 Value chain analysis

Chart on Value chain analysis

4. Market Sizing

4.1 Market definition

Data Table on Offerings of companies included in the market definition

4.2 Market segment analysis

Market segments

4.3 Market size 2025

4.4 Market outlook: Forecast for 2025-2030

Chart on Global - Market size and forecast 2025-2030 ($ million)
Data Table on Global - Market size and forecast 2025-2030 ($ million)
Chart on Global Market: Year-over-year growth 2025-2030 (%)
Data Table on Global Market: Year-over-year growth 2025-2030 (%)

5. Historic Market Size

5.1 Global Anorexiants Market 2020 - 2024

Historic Market Size - Data Table on Global Anorexiants Market 2020 - 2024 ($ million)

5.2 Distribution Channel segment analysis 2020 - 2024

Historic Market Size - Distribution Channel Segment 2020 - 2024 ($ million)

5.3 Route of Administration segment analysis 2020 - 2024

Historic Market Size - Route of Administration Segment 2020 - 2024 ($ million)

5.4 End-user segment analysis 2020 - 2024

Historic Market Size - End-user Segment 2020 - 2024 ($ million)

5.5 Geography segment analysis 2020 - 2024

Historic Market Size - Geography Segment 2020 - 2024 ($ million)

5.6 Country segment analysis 2020 - 2024

Historic Market Size - Country Segment 2020 - 2024 ($ million)

6. Qualitative Analysis

6.1 Impact of AI on Global Anorexiants Market

6.2 Impact of geopolitical conflicts on Global Anorexiants Market

7. Five Forces Analysis

7.1 Five forces summary

Five forces analysis - Comparison between 2025 and 2030

7.2 Bargaining power of buyers

Bargaining power of buyers - Impact of key factors 2025 and 2030

7.3 Bargaining power of suppliers

Bargaining power of suppliers - Impact of key factors in 2025 and 2030

7.4 Threat of new entrants

Threat of new entrants - Impact of key factors in 2025 and 2030

7.5 Threat of substitutes

Threat of substitutes - Impact of key factors in 2025 and 2030

7.6 Threat of rivalry

Threat of rivalry - Impact of key factors in 2025 and 2030

7.7 Market condition

Chart on Market condition - Five forces 2025 and 2030

8. Market Segmentation by Distribution Channel

8.1 Market segments

Chart on Distribution Channel - Market share 2025-2030 (%)
Data Table on Distribution Channel - Market share 2025-2030 (%)

8.2 Comparison by Distribution Channel

Chart on Comparison by Distribution Channel
Data Table on Comparison by Distribution Channel

8.3 Hospital pharmacy - Market size and forecast 2025-2030

Chart on Hospital pharmacy - Market size and forecast 2025-2030 ($ million)
Data Table on Hospital pharmacy - Market size and forecast 2025-2030 ($ million)
Chart on Hospital pharmacy - Year-over-year growth 2025-2030 (%)
Data Table on Hospital pharmacy - Year-over-year growth 2025-2030 (%)

8.4 Retail pharmacy - Market size and forecast 2025-2030

Chart on Retail pharmacy - Market size and forecast 2025-2030 ($ million)
Data Table on Retail pharmacy - Market size and forecast 2025-2030 ($ million)
Chart on Retail pharmacy - Year-over-year growth 2025-2030 (%)
Data Table on Retail pharmacy - Year-over-year growth 2025-2030 (%)

8.5 Online pharmacy - Market size and forecast 2025-2030

Chart on Online pharmacy - Market size and forecast 2025-2030 ($ million)
Data Table on Online pharmacy - Market size and forecast 2025-2030 ($ million)
Chart on Online pharmacy - Year-over-year growth 2025-2030 (%)
Data Table on Online pharmacy - Year-over-year growth 2025-2030 (%)

8.6 Market opportunity by Distribution Channel

Market opportunity by Distribution Channel ($ million)
Data Table on Market opportunity by Distribution Channel ($ million)

9. Market Segmentation by Route of Administration

9.1 Market segments

Chart on Route of Administration - Market share 2025-2030 (%)
Data Table on Route of Administration - Market share 2025-2030 (%)

9.2 Comparison by Route of Administration

Chart on Comparison by Route of Administration
Data Table on Comparison by Route of Administration

9.3 Oral - Market size and forecast 2025-2030

Chart on Oral - Market size and forecast 2025-2030 ($ million)
Data Table on Oral - Market size and forecast 2025-2030 ($ million)
Chart on Oral - Year-over-year growth 2025-2030 (%)
Data Table on Oral - Year-over-year growth 2025-2030 (%)

9.4 Subcutaneous - Market size and forecast 2025-2030

Chart on Subcutaneous - Market size and forecast 2025-2030 ($ million)
Data Table on Subcutaneous - Market size and forecast 2025-2030 ($ million)
Chart on Subcutaneous - Year-over-year growth 2025-2030 (%)
Data Table on Subcutaneous - Year-over-year growth 2025-2030 (%)

9.5 Others - Market size and forecast 2025-2030

Chart on Others - Market size and forecast 2025-2030 ($ million)
Data Table on Others - Market size and forecast 2025-2030 ($ million)
Chart on Others - Year-over-year growth 2025-2030 (%)
Data Table on Others - Year-over-year growth 2025-2030 (%)

9.6 Market opportunity by Route of Administration

Market opportunity by Route of Administration ($ million)
Data Table on Market opportunity by Route of Administration ($ million)

10. Market Segmentation by End-user

10.1 Market segments

Chart on End-user - Market share 2025-2030 (%)
Data Table on End-user - Market share 2025-2030 (%)

10.2 Comparison by End-user

Chart on Comparison by End-user
Data Table on Comparison by End-user

10.3 Hospitals - Market size and forecast 2025-2030

Chart on Hospitals - Market size and forecast 2025-2030 ($ million)
Data Table on Hospitals - Market size and forecast 2025-2030 ($ million)
Chart on Hospitals - Year-over-year growth 2025-2030 (%)
Data Table on Hospitals - Year-over-year growth 2025-2030 (%)

10.4 Specialty clinics - Market size and forecast 2025-2030

Chart on Specialty clinics - Market size and forecast 2025-2030 ($ million)
Data Table on Specialty clinics - Market size and forecast 2025-2030 ($ million)
Chart on Specialty clinics - Year-over-year growth 2025-2030 (%)
Data Table on Specialty clinics - Year-over-year growth 2025-2030 (%)

10.5 Homecare - Market size and forecast 2025-2030

Chart on Homecare - Market size and forecast 2025-2030 ($ million)
Data Table on Homecare - Market size and forecast 2025-2030 ($ million)
Chart on Homecare - Year-over-year growth 2025-2030 (%)
Data Table on Homecare - Year-over-year growth 2025-2030 (%)

10.6 Others - Market size and forecast 2025-2030

Chart on Others - Market size and forecast 2025-2030 ($ million)
Data Table on Others - Market size and forecast 2025-2030 ($ million)
Chart on Others - Year-over-year growth 2025-2030 (%)
Data Table on Others - Year-over-year growth 2025-2030 (%)

10.7 Market opportunity by End-user

Market opportunity by End-user ($ million)
Data Table on Market opportunity by End-user ($ million)

11. Customer Landscape

11.1 Customer landscape overview

Analysis of price sensitivity, lifecycle, customer purchase basket, adoption rates, and purchase criteria

12. Geographic Landscape

12.1 Geographic segmentation

Chart on Market share by geography 2025-2030 (%)
Data Table on Market share by geography 2025-2030 (%)

12.2 Geographic comparison

Chart on Geographic comparison
Data Table on Geographic comparison

12.3 North America - Market size and forecast 2025-2030

Chart on North America - Market size and forecast 2025-2030 ($ million)
Data Table on North America - Market size and forecast 2025-2030 ($ million)
Chart on North America - Year-over-year growth 2025-2030 (%)
Data Table on North America - Year-over-year growth 2025-2030 (%)
Chart on Regional Comparison - North America
Data Table on Regional Comparison - North America

12.3.1 US - Market size and forecast 2025-2030

Chart on US - Market size and forecast 2025-2030 ($ million)
Data Table on US - Market size and forecast 2025-2030 ($ million)
Chart on US - Year-over-year growth 2025-2030 (%)
Data Table on US - Year-over-year growth 2025-2030 (%)

12.3.2 Canada - Market size and forecast 2025-2030

Chart on Canada - Market size and forecast 2025-2030 ($ million)
Data Table on Canada - Market size and forecast 2025-2030 ($ million)
Chart on Canada - Year-over-year growth 2025-2030 (%)
Data Table on Canada - Year-over-year growth 2025-2030 (%)

12.3.3 Mexico - Market size and forecast 2025-2030

Chart on Mexico - Market size and forecast 2025-2030 ($ million)
Data Table on Mexico - Market size and forecast 2025-2030 ($ million)
Chart on Mexico - Year-over-year growth 2025-2030 (%)
Data Table on Mexico - Year-over-year growth 2025-2030 (%)

12.4 Europe - Market size and forecast 2025-2030

Chart on Europe - Market size and forecast 2025-2030 ($ million)
Data Table on Europe - Market size and forecast 2025-2030 ($ million)
Chart on Europe - Year-over-year growth 2025-2030 (%)
Data Table on Europe - Year-over-year growth 2025-2030 (%)
Chart on Regional Comparison - Europe
Data Table on Regional Comparison - Europe

12.4.1 Germany - Market size and forecast 2025-2030

Chart on Germany - Market size and forecast 2025-2030 ($ million)
Data Table on Germany - Market size and forecast 2025-2030 ($ million)
Chart on Germany - Year-over-year growth 2025-2030 (%)
Data Table on Germany - Year-over-year growth 2025-2030 (%)

12.4.2 UK - Market size and forecast 2025-2030

Chart on UK - Market size and forecast 2025-2030 ($ million)
Data Table on UK - Market size and forecast 2025-2030 ($ million)
Chart on UK - Year-over-year growth 2025-2030 (%)
Data Table on UK - Year-over-year growth 2025-2030 (%)

12.4.3 France - Market size and forecast 2025-2030

Chart on France - Market size and forecast 2025-2030 ($ million)
Data Table on France - Market size and forecast 2025-2030 ($ million)
Chart on France - Year-over-year growth 2025-2030 (%)
Data Table on France - Year-over-year growth 2025-2030 (%)

12.4.4 Italy - Market size and forecast 2025-2030

Chart on Italy - Market size and forecast 2025-2030 ($ million)
Data Table on Italy - Market size and forecast 2025-2030 ($ million)
Chart on Italy - Year-over-year growth 2025-2030 (%)
Data Table on Italy - Year-over-year growth 2025-2030 (%)

12.4.5 Spain - Market size and forecast 2025-2030

Chart on Spain - Market size and forecast 2025-2030 ($ million)
Data Table on Spain - Market size and forecast 2025-2030 ($ million)
Chart on Spain - Year-over-year growth 2025-2030 (%)
Data Table on Spain - Year-over-year growth 2025-2030 (%)

12.4.6 The Netherlands - Market size and forecast 2025-2030

Chart on The Netherlands - Market size and forecast 2025-2030 ($ million)
Data Table on The Netherlands - Market size and forecast 2025-2030 ($ million)
Chart on The Netherlands - Year-over-year growth 2025-2030 (%)
Data Table on The Netherlands - Year-over-year growth 2025-2030 (%)

12.5 Asia - Market size and forecast 2025-2030

Chart on Asia - Market size and forecast 2025-2030 ($ million)
Data Table on Asia - Market size and forecast 2025-2030 ($ million)
Chart on Asia - Year-over-year growth 2025-2030 (%)
Data Table on Asia - Year-over-year growth 2025-2030 (%)
Chart on Regional Comparison - Asia
Data Table on Regional Comparison - Asia

12.5.1 China - Market size and forecast 2025-2030

Chart on China - Market size and forecast 2025-2030 ($ million)
Data Table on China - Market size and forecast 2025-2030 ($ million)
Chart on China - Year-over-year growth 2025-2030 (%)
Data Table on China - Year-over-year growth 2025-2030 (%)

12.5.2 India - Market size and forecast 2025-2030

Chart on India - Market size and forecast 2025-2030 ($ million)
Data Table on India - Market size and forecast 2025-2030 ($ million)
Chart on India - Year-over-year growth 2025-2030 (%)
Data Table on India - Year-over-year growth 2025-2030 (%)

12.5.3 Japan - Market size and forecast 2025-2030

Chart on Japan - Market size and forecast 2025-2030 ($ million)
Data Table on Japan - Market size and forecast 2025-2030 ($ million)
Chart on Japan - Year-over-year growth 2025-2030 (%)
Data Table on Japan - Year-over-year growth 2025-2030 (%)

12.5.4 South Korea - Market size and forecast 2025-2030

Chart on South Korea - Market size and forecast 2025-2030 ($ million)
Data Table on South Korea - Market size and forecast 2025-2030 ($ million)
Chart on South Korea - Year-over-year growth 2025-2030 (%)
Data Table on South Korea - Year-over-year growth 2025-2030 (%)

12.5.5 Thailand - Market size and forecast 2025-2030

Chart on Thailand - Market size and forecast 2025-2030 ($ million)
Data Table on Thailand - Market size and forecast 2025-2030 ($ million)
Chart on Thailand - Year-over-year growth 2025-2030 (%)
Data Table on Thailand - Year-over-year growth 2025-2030 (%)

12.5.6 Indonesia - Market size and forecast 2025-2030

Chart on Indonesia - Market size and forecast 2025-2030 ($ million)
Data Table on Indonesia - Market size and forecast 2025-2030 ($ million)
Chart on Indonesia - Year-over-year growth 2025-2030 (%)
Data Table on Indonesia - Year-over-year growth 2025-2030 (%)

12.6 Rest of World (ROW) - Market size and forecast 2025-2030

Chart on Rest of World (ROW) - Market size and forecast 2025-2030 ($ million)
Data Table on Rest of World (ROW) - Market size and forecast 2025-2030 ($ million)
Chart on Rest of World (ROW) - Year-over-year growth 2025-2030 (%)
Data Table on Rest of World (ROW) - Year-over-year growth 2025-2030 (%)
Chart on Regional Comparison - Rest of World (ROW)
Data Table on Regional Comparison - Rest of World (ROW)

12.6.1 Brazil - Market size and forecast 2025-2030

Chart on Brazil - Market size and forecast 2025-2030 ($ million)
Data Table on Brazil - Market size and forecast 2025-2030 ($ million)
Chart on Brazil - Year-over-year growth 2025-2030 (%)
Data Table on Brazil - Year-over-year growth 2025-2030 (%)

12.6.2 Saudi Arabia - Market size and forecast 2025-2030

Chart on Saudi Arabia - Market size and forecast 2025-2030 ($ million)
Data Table on Saudi Arabia - Market size and forecast 2025-2030 ($ million)
Chart on Saudi Arabia - Year-over-year growth 2025-2030 (%)
Data Table on Saudi Arabia - Year-over-year growth 2025-2030 (%)

12.6.3 UAE - Market size and forecast 2025-2030

Chart on UAE - Market size and forecast 2025-2030 ($ million)
Data Table on UAE - Market size and forecast 2025-2030 ($ million)
Chart on UAE - Year-over-year growth 2025-2030 (%)
Data Table on UAE - Year-over-year growth 2025-2030 (%)

12.6.4 Turkey - Market size and forecast 2025-2030

Chart on Turkey - Market size and forecast 2025-2030 ($ million)
Data Table on Turkey - Market size and forecast 2025-2030 ($ million)
Chart on Turkey - Year-over-year growth 2025-2030 (%)
Data Table on Turkey - Year-over-year growth 2025-2030 (%)

12.6.5 Argentina - Market size and forecast 2025-2030

Chart on Argentina - Market size and forecast 2025-2030 ($ million)
Data Table on Argentina - Market size and forecast 2025-2030 ($ million)
Chart on Argentina - Year-over-year growth 2025-2030 (%)
Data Table on Argentina - Year-over-year growth 2025-2030 (%)

12.6.6 Colombia - Market size and forecast 2025-2030

Chart on Colombia - Market size and forecast 2025-2030 ($ million)
Data Table on Colombia - Market size and forecast 2025-2030 ($ million)
Chart on Colombia - Year-over-year growth 2025-2030 (%)
Data Table on Colombia - Year-over-year growth 2025-2030 (%)

12.6.7 South Africa - Market size and forecast 2025-2030

Chart on South Africa - Market size and forecast 2025-2030 ($ million)
Data Table on South Africa - Market size and forecast 2025-2030 ($ million)
Chart on South Africa - Year-over-year growth 2025-2030 (%)
Data Table on South Africa - Year-over-year growth 2025-2030 (%)

12.6.8 Israel - Market size and forecast 2025-2030

Chart on Israel - Market size and forecast 2025-2030 ($ million)
Data Table on Israel - Market size and forecast 2025-2030 ($ million)
Chart on Israel - Year-over-year growth 2025-2030 (%)
Data Table on Israel - Year-over-year growth 2025-2030 (%)

12.7 Market opportunity by geography

Market opportunity by geography ($ million)
Data Tables on Market opportunity by geography ($ million)

13. Drivers, Challenges, and Opportunity

13.1 Market drivers

Escalating global obesity prevalence
Breakthroughs in oral therapeutics
Favorable reimbursement and payer support

13.2 Market challenges

Severe supply chain bottlenecks
High costs and affordability
Adverse safety and tolerability

13.3 Impact of drivers and challenges

Impact of drivers and challenges in 2025 and 2030

13.4 Market opportunities

Rise of digital weight management
Focus on muscle mass preservation
Expansion of pediatric treatment indications

14. Competitive Landscape

14.1 Overview

14.2

Overview on criticality of inputs and factors of differentiation

14.3 Landscape disruption

Overview on factors of disruption

14.4 Industry risks

Impact of key risks on business

15. Competitive Analysis

15.1 Companies profiled

Companies covered

15.2 Company ranking index

15.3 Market positioning of companies

Matrix on companies position and classification

15.4 Alvogen Inc

Alvogen Inc - Overview
Alvogen Inc - Product / Service
Alvogen Inc - Key offerings
SWOT

15.5 Dr. Reddys Laboratories Ltd.

Dr. Reddys Laboratories Ltd. - Overview
Dr. Reddys Laboratories Ltd. - Business segments
Dr. Reddys Laboratories Ltd. - Key news
Dr. Reddys Laboratories Ltd. - Key offerings
Dr. Reddys Laboratories Ltd. - Segment focus
SWOT

15.6 Eli Lilly and Co.

Eli Lilly and Co. - Overview
Eli Lilly and Co. - Product / Service
Eli Lilly and Co. - Key news
Eli Lilly and Co. - Key offerings
SWOT

15.7 Hikma Pharmaceuticals Plc

Hikma Pharmaceuticals Plc - Overview
Hikma Pharmaceuticals Plc - Business segments
Hikma Pharmaceuticals Plc - Key news
Hikma Pharmaceuticals Plc - Key offerings
Hikma Pharmaceuticals Plc - Segment focus
SWOT

15.8 Lupin Ltd.

Lupin Ltd. - Overview
Lupin Ltd. - Business segments
Lupin Ltd. - Key news
Lupin Ltd. - Key offerings
Lupin Ltd. - Segment focus
SWOT

15.9 Novo Nordisk AS

Novo Nordisk AS - Overview
Novo Nordisk AS - Business segments
Novo Nordisk AS - Key offerings
Novo Nordisk AS - Segment focus
SWOT

15.10 Pfizer Inc.

Pfizer Inc. - Overview
Pfizer Inc. - Business segments
Pfizer Inc. - Key news
Pfizer Inc. - Key offerings
Pfizer Inc. - Segment focus
SWOT

15.11 Sandoz Group AG

Sandoz Group AG - Overview
Sandoz Group AG - Business segments
Sandoz Group AG - Key news
Sandoz Group AG - Key offerings
Sandoz Group AG - Segment focus
SWOT

15.12 STADA Arzneimittel AG

STADA Arzneimittel AG - Overview
STADA Arzneimittel AG - Product / Service
STADA Arzneimittel AG - Key offerings
SWOT

15.13 Sun Pharmaceutical Industries

Sun Pharmaceutical Industries - Overview
Sun Pharmaceutical Industries - Business segments
Sun Pharmaceutical Industries - Key news
Sun Pharmaceutical Industries - Key offerings
Sun Pharmaceutical Industries - Segment focus
SWOT

15.14 Teva Pharmaceutical Ltd.

Teva Pharmaceutical Ltd. - Overview
Teva Pharmaceutical Ltd. - Business segments
Teva Pharmaceutical Ltd. - Key news
Teva Pharmaceutical Ltd. - Key offerings
Teva Pharmaceutical Ltd. - Segment focus
SWOT

15.15 Towa Pharmaceutical Co. Ltd.

Towa Pharmaceutical Co. Ltd. - Overview
Towa Pharmaceutical Co. Ltd. - Business segments
Towa Pharmaceutical Co. Ltd. - Key offerings
Towa Pharmaceutical Co. Ltd. - Segment focus
SWOT

15.16 Upsher Smith Laboratories LLC

Upsher Smith Laboratories LLC - Overview
Upsher Smith Laboratories LLC - Product / Service
Upsher Smith Laboratories LLC - Key offerings
SWOT

15.17 Viatris Inc.

Viatris Inc. - Overview
Viatris Inc. - Business segments
Viatris Inc. - Key news
Viatris Inc. - Key offerings
Viatris Inc. - Segment focus
SWOT

15.18 Zydus Lifesciences Ltd.

Zydus Lifesciences Ltd. - Overview
Zydus Lifesciences Ltd. - Business segments
Zydus Lifesciences Ltd. - Key news
Zydus Lifesciences Ltd. - Key offerings
Zydus Lifesciences Ltd. - Segment focus
SWOT

16. Appendix

16.1 Scope of the report

Market definition
Objectives
Notes and caveats

16.2 Inclusions and exclusions checklist

Inclusions checklist
Exclusions checklist

16.3 Currency conversion rates for US$

16.4 Research methodology

16.5 Data procurement

Information sources

16.6 Data validation

16.7 Validation techniques employed for market sizing

16.8 Data synthesis

16.9 360 degree market analysis

16.10 List of abbreviations

Research Methodology

Technavio presents a detailed picture of the market by way of study, synthesis, and summation of data from multiple sources. The analysts have presented the various facets of the market with a particular focus on identifying the key industry influencers. The data thus presented is comprehensive, reliable, and the result of extensive research, both primary and secondary.

INFORMATION SOURCES

Primary sources

  • Manufacturers and suppliers
  • Channel partners
  • Industry experts
  • Strategic decision makers

Secondary sources

  • Industry journals and periodicals
  • Government data
  • Financial reports of key industry players
  • Historical data
  • Press releases

DATA ANALYSIS

Data Synthesis

  • Collation of data
  • Estimation of key figures
  • Analysis of derived insights

Data Validation

  • Triangulation with data models
  • Reference against proprietary databases
  • Corroboration with industry experts

REPORT WRITING

Qualitative

  • Market drivers
  • Market challenges
  • Market trends
  • Five forces analysis

Quantitative

  • Market size and forecast
  • Market segmentation
  • Geographical insights
  • Competitive landscape

Interested in this report?

Get your sample now to see our research methodology and insights!

Download Now

Frequently Asked Questions

Anorexiants market growth will increase by USD 1156.9 million during 2026-2030.

The Anorexiants market is expected to grow at a CAGR of 4.7% during 2026-2030.

Anorexiants market is segmented by Distribution channel (Hospital pharmacy, Retail pharmacy, Online pharmacy) Route of administration (Oral, Subcutaneous, Others) End-user (Hospitals, Specialty clinics, Homecare, Others)

Alvogen Inc, Currax Pharmaceuticals LLC, Dr. Reddys Laboratories Ltd., Eli Lilly and Co., Hikma Pharmaceuticals Plc, KVK Tech Inc., Lupin Ltd., Novo Nordisk AS, Pfizer Inc., Rhythm Pharmaceuticals Inc., Sandoz Group AG, STADA Arzneimittel AG, Sun Pharmaceutical Industries, Teva Pharmaceutical Ltd., Towa Pharmaceutical Co. Ltd., Upsher Smith Laboratories LLC, Viatris Inc., VIVUS LLC, Zentiva Group, Zydus Lifesciences Ltd. are a few of the key vendors in the Anorexiants market.

North America will register the highest growth rate of 47.2% among the other regions. Therefore, the Anorexiants market in North America is expected to garner significant business opportunities for the vendors during the forecast period.

US, Canada, Mexico, Germany, UK, France, Italy, Spain, The Netherlands, China, India, Japan, South Korea, Thailand, Indonesia, Brazil, Saudi Arabia, UAE, Turkey, Argentina, Colombia, South Africa, Israel

  • Escalating global obesity prevalence is the driving factor this market.

The Anorexiants market vendors should focus on grabbing business opportunities from the Distribution channel segment as it accounted for the largest market share in the base year.
RIA - Research AI Assistant
Ask RIA