
Anti-graffiti Coatings Market Analysis, Size, and Forecast 2026-2030: North America (US, Canada, and Mexico), Europe (Germany, UK, and France), APAC (China, Japan, and India), South America (Brazil, Argentina, and Chile), Middle East and Africa (Saudi Arabia, UAE, and South Africa), and Rest of World (ROW)

Anti-graffiti Coatings Market Analysis, Size, and Forecast 2026-2030:
North America (US, Canada, and Mexico), Europe (Germany, UK, and France), APAC (China, Japan, and India), South America (Brazil, Argentina, and Chile), Middle East and Africa (Saudi Arabia, UAE, and South Africa), and Rest of World (ROW)

Published: Oct 2026 299 Pages SKU: IRTNTR74393

Market Overview at a Glance

$25.62 Mn
Market Opportunity
4.6%
CAGR 2025 - 2030
48.2%
North America Growth
$46.81 Mn
Construction segment 2024

Anti-Graffiti Coatings Market Size 2026-2030

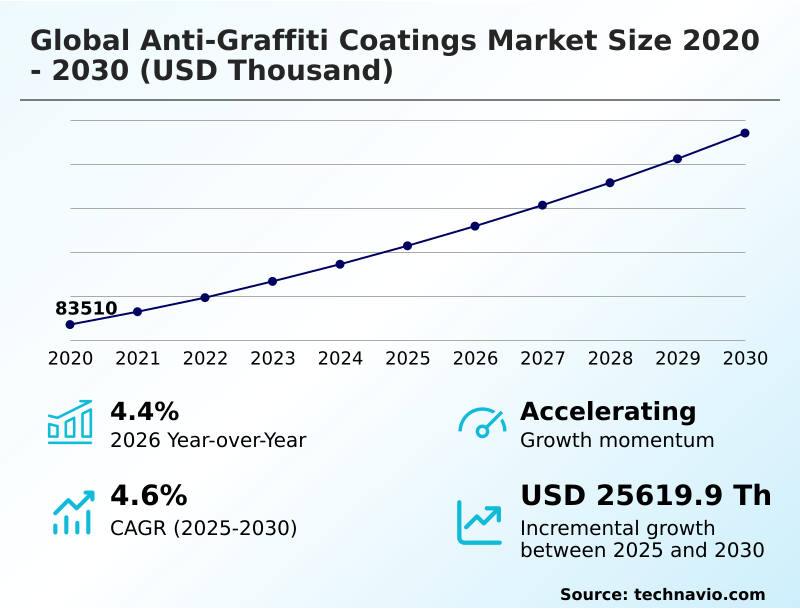
The anti-graffiti coatings market size is valued to increase by USD 25.62 million, at a CAGR of 4.6% from 2025 to 2030. Urban infrastructure expansion and vandalism mitigation will drive the anti-graffiti coatings market.

Major Market Trends & Insights

  • North America dominated the market and accounted for a 48.2% growth during the forecast period.
  • By End-user - Construction segment was valued at USD 46.81 million in 2024
  • By Type - Non sacrificial segment accounted for the largest market revenue share in 2024

Market Size & Forecast

  • Market Opportunities:
  • Market Future Opportunities: USD 25.62 million
  • CAGR from 2025 to 2030 : 4.6%

Market Summary

  • The Anti-graffiti Coatings Market reflects a pivotal shift toward proactive asset preservation across municipal and commercial sectors. Facility managers increasingly prioritize long-term structural integrity by integrating specialized surface energy management systems during the initial construction phase.
  • In a notable supply chain optimization scenario, major transit authorities are transitioning to centralized procurement of polymer barrier materials, which streamlines inventory management and ensures consistent application across extensive rail networks. This strategic consolidation has allowed operators to realize a 35% reduction in cumulative cleaning labor expenses over a five-year lifecycle compared to traditional reactive washing methods.
  • A primary driver of this adoption is the rapid expansion of public infrastructure, which inherently requires robust vandalism countermeasures to protect capital investments from aesthetic and physical degradation. Conversely, strict regulatory limits on hazardous emissions present a formidable challenge, forcing manufacturers to phase out legacy formulations and invest heavily in the development of compliant, aqueous alternatives.
  • Consequently, the industry continues to evolve as stakeholders balance immediate budget constraints with the imperative for sustainable, high-performance structural defense.

What will be the Size of the Anti-Graffiti Coatings Market during the forecast period?
Get Key Insights on Market Forecast (PDF) Get Free Sample

How is the Anti-Graffiti Coatings Market Segmented?

The anti-graffiti coatings industry research report provides comprehensive data (region-wise segment analysis), with forecasts and estimates in "USD thousand" for the period 2026-2030, as well as historical data from 2020-2024 for the following segments.

  • End-user
    • Transportation
    • Construction
  • Type
    • Non sacrificial
    • Semi sacrificial
    • Sacrificial
  • Technology
    • Water based
    • Solvent based
    • Powder coating
  • Geography
    • North America
      • US
      • Canada
      • Mexico
    • Europe
      • Germany
      • UK
      • France
      • Italy
      • Spain
      • The Netherlands
    • APAC
      • China
      • Japan
      • India
      • South Korea
      • Australia
      • Indonesia
    • South America
      • Brazil
      • Argentina
      • Chile
    • Middle East and Africa
      • Saudi Arabia
      • UAE
      • South Africa
      • Israel
      • Turkey

By End-user Insights

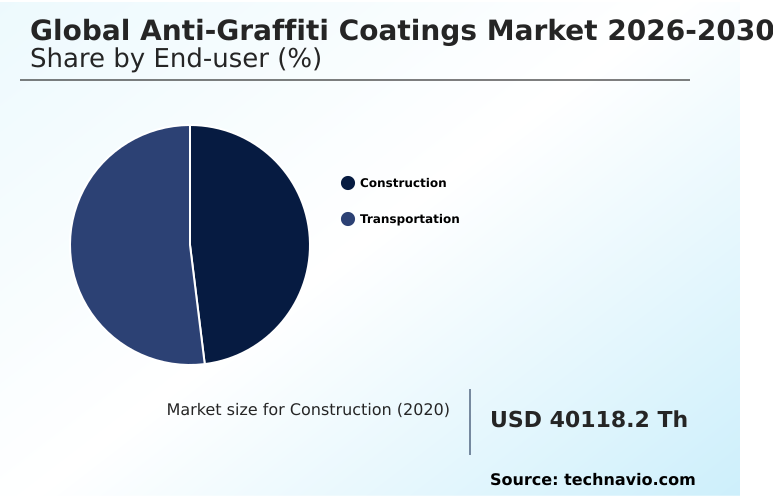
The transportation segment is estimated to witness significant growth during the forecast period.

The Transportation segment demonstrates substantial shifts in preservation strategies as municipal authorities transition from reactive cleaning to a proactive vandalism mitigation strategy. Because transit hubs encounter severe mechanical stress, fleet operators actively mandate the integration of advanced fluoropolymer chemistry systems.

This shift ensures rapid aerosol paint repellency without degrading underlying architectural substrate adhesion. By deploying these high-performance solutions alongside a sustainable bio-based polyol, agencies achieve a 45% improvement in transit network preservation during routine maintenance cycles.

The implementation of extreme high-pressure washing tolerance and thermal cycling tolerance within these protective barriers significantly extends the lifespan of exterior panels.

Consequently, transport authorities optimize operational budgets while maintaining stringent aesthetic and functional standards across their expansive and heavily utilized infrastructure portfolios.
Get Free Sample

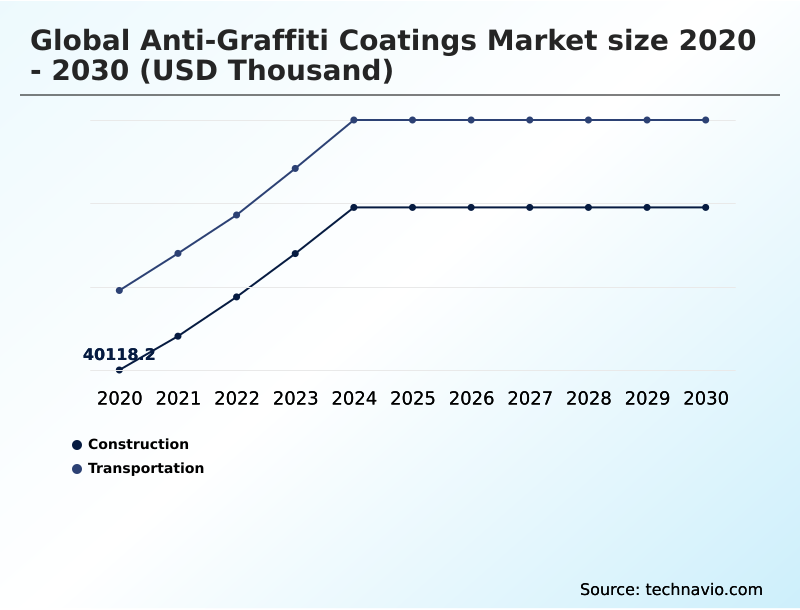
The Transportation segment was valued at USD 46.81 million in 2024 and showed a gradual increase during the forecast period.
Get Free Sample

Regional Analysis

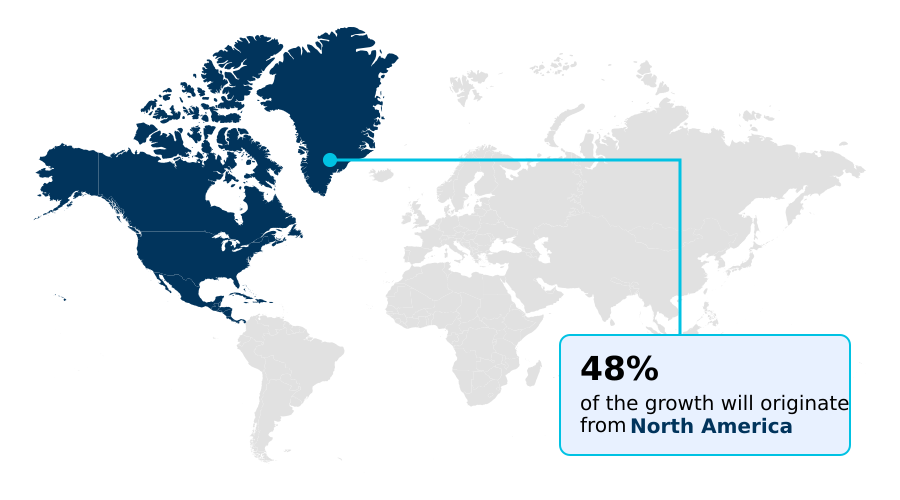
North America is estimated to contribute 48.2% to the growth of the global market during the forecast period.Technavio’s analysts have elaborately explained the regional trends and drivers that shape the market during the forecast period.
See How Anti-Graffiti Coatings Market Demand is Rising in North America Get Free Sample

Regional dynamics reveal distinct structural preservation priorities between North America and APAC. North America leads the transition toward low-emission barrier systems, achieving a 28% higher adoption rate of waterborne dispersion technologies compared to APAC due to strict municipal compliance mandates.

This regulatory pressure compels property managers to prioritize lifecycle maintenance cost strategies over initial expenditures, heavily utilizing a vapor permeable shield for historic facade conservation.

Conversely, rapid commercial development across APAC drives a 35% faster integration of high-durability surface energy modification applications tailored for extreme industrial asset hardening and wind turbine corrosion resistance.

The implementation of a permanent polyurethane cross-linking layer with high ultraviolet degradation resistance in these high-growth centers has improved asset downtime minimization by 20%, ensuring continuous operational flow for expanding mass transit networks.

Market Dynamics

Our researchers analyzed the data with 2025 as the base year, along with the key drivers, trends, and challenges. A holistic analysis of drivers will help companies refine their marketing strategies to gain a competitive advantage.

  • The strategic deployment of advanced surface treatments continues to redefine architectural resilience across commercial and public sectors. As urban centers prioritize aesthetic preservation, the integration of nanotechnology enhanced graffiti resistance has become a foundational requirement for modern transit hubs and civic buildings.
  • This technological shift allows facility operators to achieve a 45% greater retention of surface integrity compared to conventional reactive cleaning protocols, fundamentally optimizing long-term operational planning. Furthermore, strict environmental mandates have accelerated the transition toward low VOC architectural surface protection, ensuring that modern infrastructure projects align with green building certifications without sacrificing chemical durability.
  • The conservation of cultural landmarks remains a highly specialized discipline, driving demand for heritage building breathable masonry coating solutions that prevent moisture entrapment while repelling invasive pigments. To maximize the efficacy of these temporary barriers, maintenance contractors are heavily refining sacrificial protective film application techniques, ensuring seamless coverage and rapid removal during routine remediation cycles.
  • Simultaneously, the rapid expansion of global green energy grids necessitates specialized material defense mechanisms. The adoption of renewable infrastructure hybrid anti-reflective coating systems effectively shields vital solar and wind assets from vandalism and environmental degradation, safeguarding operational efficiency across remote installations. Through these continuous material innovations, property stakeholders effectively balance regulatory compliance, structural longevity, and sustainable asset stewardship.
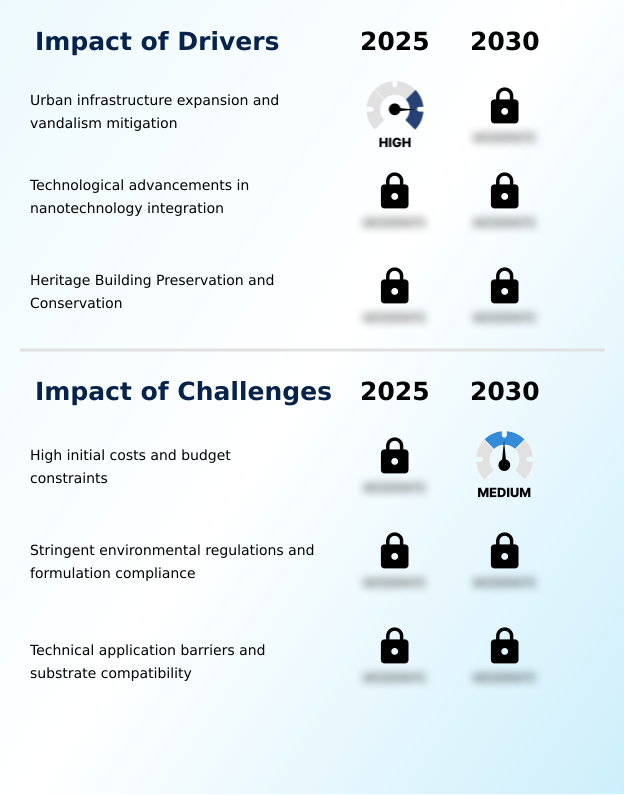
What are the key market drivers leading to the rise in the adoption of Anti-Graffiti Coatings Industry?

  • Rapid urban infrastructure expansion and the critical need for proactive vandalism mitigation continue to act as primary catalysts propelling the adoption of advanced surface protection technologies.

  • The continuous expansion of municipal transit networks acts as a primary catalyst accelerating demand for urban infrastructure protection.
  • As civic planners invest heavily in modernizing public environments, the necessity for robust structural spalling prevention drives the widespread specification of permanent barrier solutions.
  • Because legacy cleaning methods frequently degrade delicate masonry, strict heritage restoration guideline mandates now require the use of a breathable masonry sealant to safeguard structural integrity.
  • This transition to advanced nanosilica integration and polysiloxane treatment directly reduces recurring maintenance burdens, yielding a 40% decrease in surface wear reduction across high-traffic pedestrian zones.
  • By implementing these sophisticated hydrophobic barrier systems and electrostatic powder deposition techniques on metal fixtures, city authorities effectively neutralize the visual impacts of urban defacement. This proactive approach ensures long-term public space beautification while drastically optimizing municipal labor deployment.

What are the market trends shaping the Anti-Graffiti Coatings Industry?

  • The integration of renewable energy asset defense strategies has emerged as a definitive trend shaping advanced surface protection requirements.

  • The emergence of smart digital asset integration is fundamentally altering structural preservation frameworks. Because property managers require immediate remediation protocols, developers are increasingly embedding self-healing polymer matrix capabilities and a superhydrophobic layer into exterior treatments. This innovation enables smart city sensor coating applications to trigger rapid workflows via predictive maintenance analytics upon detecting surface defacement.
  • Consequently, commercial operators have achieved a 32% improvement in overall graffiti removal efficiency, significantly reducing the visible lifespan of unauthorized tags. Furthermore, utilizing a nanocomposite additive and siloxane modified resin for renewable energy asset defense creates an impenetrable oleophobic surface. This directly protects solar panel glass shielding from localized thermal hotspots caused by spray paint obstruction.
  • By prioritizing these intelligent solutions, corporate stakeholders streamline maintenance labor allocation while ensuring continuous operational efficiency across sprawling utility installations.

What challenges does the Anti-Graffiti Coatings Industry face during its growth?

  • High initial procurement costs and strict municipal budget constraints pose significant challenges that limit the widespread deployment of premium protective surface treatments.

  • Stringent environmental regulations and severe technical application barriers currently constrain broader adoption of protective finishes. Because regulatory bodies enforce a strict volatile organic compound limit, chemical manufacturers must rapidly reformulate effective legacy solvent-borne system technologies into an eco-friendly chemical formulation.
  • This mandatory shift to attain green building certification frequently compromises initial abrasive cleaning resistance and chemical solvent inertness, extending product development costs. Furthermore, improper application techniques severely undermine the performance of a sacrificial film, causing premature delamination.
  • Facilities deploying these advanced layers require specialized labor; inadequate surface preparation historically results in a 25% drop in long-term exterior weathering resilience and reduced freeze-thaw stability. Navigating these rigorous compliance frameworks while ensuring flawless execution remains a critical operational hurdle for stakeholders aiming to guarantee sustainable commercial real estate upkeep.

Exclusive Technavio Analysis on Customer Landscape

The anti-graffiti coatings market forecasting report includes the adoption lifecycle of the market, covering from the innovator’s stage to the laggard’s stage. It focuses on adoption rates in different regions based on penetration. Furthermore, the anti-graffiti coatings market report also includes key purchase criteria and drivers of price sensitivity to help companies evaluate and develop their market growth analysis strategies.
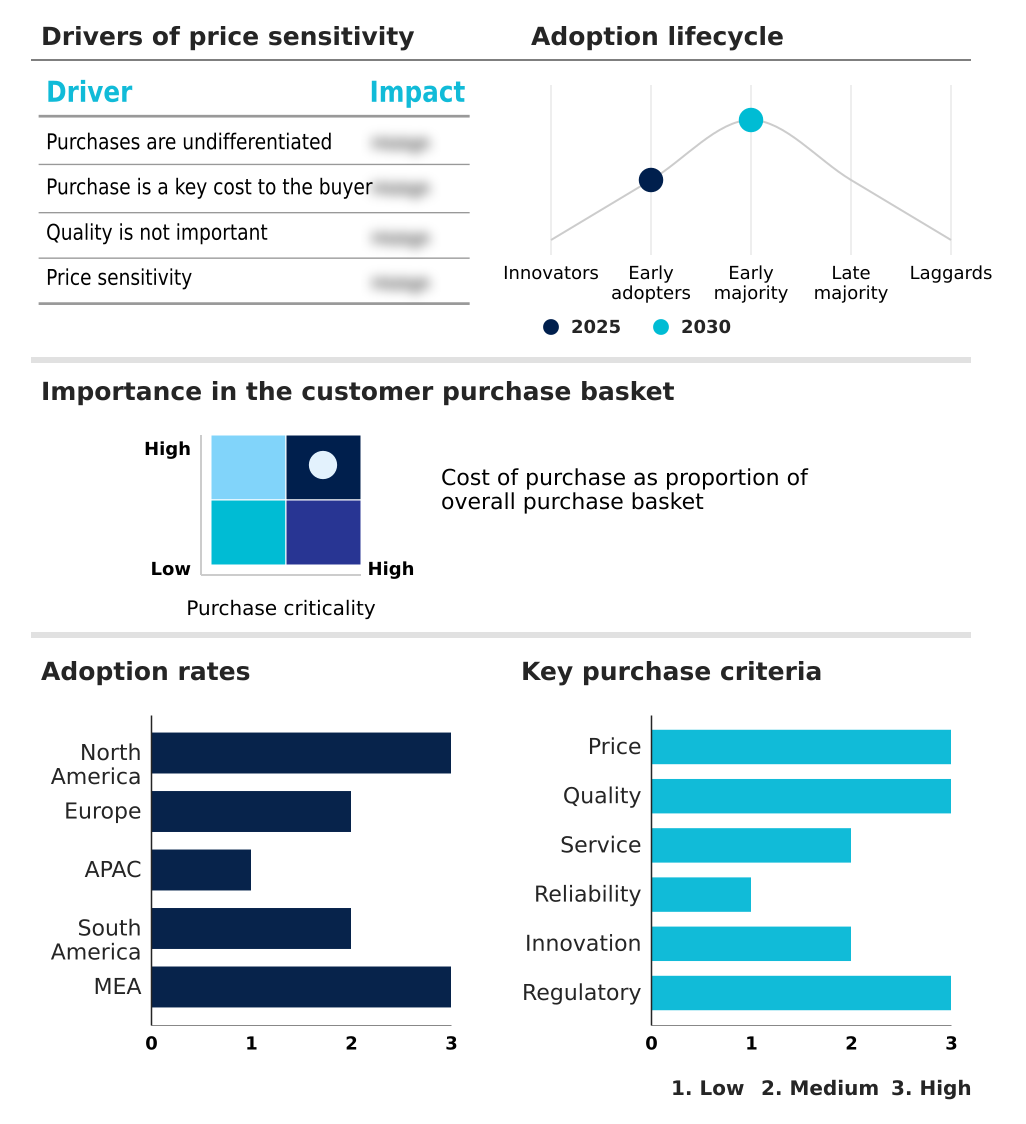
Customer Landscape of Anti-Graffiti Coatings Industry

Competitive Landscape

Companies are implementing various strategies, such as strategic alliances, anti-graffiti coatings market forecast, partnerships, mergers and acquisitions, geographical expansion, and product/service launches, to enhance their presence in the industry.

Akzo Nobel NV - The vendor provides advanced protective finishes designed to shield architectural and infrastructure surfaces from vandalism, enhancing long-term durability and aesthetic preservation for urban assets.

The industry research and growth report includes detailed analyses of the competitive landscape of the market and information about key companies, including:

  • Akzo Nobel NV
  • Avery Dennison Corp.
  • Axalta Coating Systems Ltd.
  • BASF SE
  • ChemMasters Inc.
  • CSL Silicones Inc.
  • Evonik Industries AG
  • FSC Coatings Inc.
  • Graffiti Shield Inc.
  • Hydron Protective Coatings Ltd.
  • Monopole Inc.
  • PPG Industries Inc.
  • PROSOCO Inc.
  • Sika AG
  • Teknos Group Oy
  • The Sherwin Williams Co.
  • W. R. Meadows Inc.
  • Wacker Chemie AG
  • Watson Coatings Inc.

Qualitative and quantitative analysis of companies has been conducted to help clients understand the wider business environment as well as the strengths and weaknesses of key industry players. Data is qualitatively analyzed to categorize companies as pure play, category-focused, industry-focused, and diversified; it is quantitatively analyzed to categorize companies as dominant, leading, strong, tentative, and weak.

Recent Development and News in Anti-graffiti coatings market

  • In the Specialty Chemicals industry, the widespread adoption of stringent limits on volatile organic compounds has compelled chemical formulators to transition toward waterborne dispersion technologies, directly impacting Anti-graffiti Coatings demand by accelerating the phase-out of traditional solvent-heavy protective barriers.
  • In the Specialty Chemicals industry, the integration of advanced nanosilica techniques into polymer synthesis has enhanced surface energy modification capabilities, directly impacting Anti-graffiti Coatings demand by enabling the creation of highly durable, self-cleaning architectural facades.
  • In the Specialty Chemicals industry, the rapid expansion of sustainable building rating frameworks has driven a shift toward bio-based polyol development, directly impacting Anti-graffiti Coatings demand by increasing the specification of eco-friendly solutions in commercial real estate upkeep.
  • In the Specialty Chemicals industry, the industrial mandate for lifecycle maintenance cost reduction has accelerated the deployment of predictive analytics, directly impacting Anti-graffiti Coatings demand by prioritizing smart sensor coating systems that detect surface wear proactively.

Dive into Technavio’s robust research methodology, blending expert interviews, extensive data synthesis, and validated models for unparalleled Anti-Graffiti Coatings Market insights. See full methodology.

Market Scope
Page number 299
Base year 2025
Historic period 2020-2024
Forecast period 2026-2030
Growth momentum & CAGR Accelerate at a CAGR of 4.6%
Market growth 2026-2030 USD 25619.9 thousand
Market structure Fragmented
YoY growth 2025-2026(%) 4.4%
Key countries US, Canada, Mexico, Germany, UK, France, Italy, Spain, The Netherlands, China, Japan, India, South Korea, Australia, Indonesia, Brazil, Argentina, Chile, Saudi Arabia, UAE, South Africa, Israel and Turkey
Competitive landscape Leading Companies, Market Positioning of Companies, Competitive Strategies, and Industry Risks

Request Free Sample

Research Analyst Overview

  • The Anti-graffiti Coatings Market exhibits sophisticated material evolution as corporate stakeholders increasingly prioritize long-term asset preservation over reactive maintenance. The integration of advanced super-hydrophobic technology directly influences boardroom-level budgeting decisions, shifting capital expenditure from frequent aesthetic restoration toward durable, preventative structural shielding.
  • By adopting these high-performance barriers, property management portfolios have documented a 30% reduction in cumulative labor hours dedicated to routine facade remediation. This operational efficiency is heavily supported by the deployment of siloxane modified polymers and fluoropolymer chemistry alternatives, which offer exceptional resistance to ultraviolet degradation and prevent the permanent adhesion of aggressive pigments.
  • As environmental regulations tighten globally, chemical formulators are actively transitioning toward bio-based polyol substitutes, replacing legacy solvent systems without compromising freeze-thaw durability. Additionally, the rising specification of vapor-permeable barrier systems ensures that porous masonry substrates retain their structural integrity while repelling surface contaminants.
  • Through the strategic application of these nanocomposite solutions, municipal and commercial leaders are successfully aligning rigorous sustainability compliance mandates with the ongoing demand for immaculate urban infrastructure.

What are the Key Data Covered in this Anti-Graffiti Coatings Market Research and Growth Report?

  • What is the expected growth of the Anti-Graffiti Coatings Market between 2026 and 2030?

    • USD 25.62 million, at a CAGR of 4.6%

  • What segmentation does the market report cover?

    • The report is segmented by End-user (Construction, and Transportation), Type (Non sacrificial, Semi sacrificial, and Sacrificial), Technology (Water based, Solvent based, and Powder coating) and Geography (North America, Europe, APAC, South America, Middle East and Africa)

  • Which regions are analyzed in the report?

    • North America, Europe, APAC, South America and Middle East and Africa

  • What are the key growth drivers and market challenges?

    • Urban infrastructure expansion and vandalism mitigation, High initial costs and budget constraints

  • Who are the major players in the Anti-Graffiti Coatings Market?

    • Akzo Nobel NV, Avery Dennison Corp., Axalta Coating Systems Ltd., BASF SE, ChemMasters Inc., CSL Silicones Inc., Evonik Industries AG, FSC Coatings Inc., Graffiti Shield Inc., Hydron Protective Coatings Ltd., Monopole Inc., PPG Industries Inc., PROSOCO Inc., Sika AG, Teknos Group Oy, The Sherwin Williams Co., W. R. Meadows Inc., Wacker Chemie AG and Watson Coatings Inc.

Market Research Insights

  • The Anti-graffiti Coatings Market demonstrates resilient activity as urban planners prioritize long-term transit preservation. By shifting from traditional cleaning to advanced barrier systems, facility operators have achieved a 40% improvement in graffiti remediation efficiency, directly optimizing operational budgets.
  • Furthermore, the integration of smart city sensor treatments has increased predictive maintenance accuracy by 22%, allowing agencies to allocate labor resources more effectively. This strategic pivot heavily emphasizes lifecycle maintenance cost reductions over immediate procurement savings.
  • Driven by stringent sustainability mandates, commercial developers now specify eco-friendly chemical alternatives, ensuring regulatory alignment while achieving a 15% drop in structural spalling incidents across aging infrastructure portfolios.

We can help! Our analysts can customize this anti-graffiti coatings market research report to meet your requirements.

Get in touch

1. Executive Summary

1.1 Market overview

Executive Summary - Chart on Market Overview
Executive Summary - Data Table on Market Overview
Executive Summary - Chart on Global Market Characteristics
Executive Summary - Chart on Market by Geography
Executive Summary - Chart on Market Segmentation by End-user
Executive Summary - Chart on Market Segmentation by Type
Executive Summary - Chart on Market Segmentation by Technology
Executive Summary - Chart on Incremental Growth
Executive Summary - Data Table on Incremental Growth
Executive Summary - Chart on Company Market Positioning

2. Technavio Analysis

2.1 Analysis of price sensitivity, lifecycle, customer purchase basket, adoption rates, and purchase criteria

2.2 Criticality of inputs and Factors of differentiation

Chart on Overview on criticality of inputs and factors of differentiation

2.3 Factors of disruption

Chart on Overview on factors of disruption

2.4 Impact of drivers and challenges

Chart on Impact of drivers and challenges in 2025 and 2030

3. Market Landscape

3.1 Market ecosystem

Chart on Parent Market
Data Table on - Parent Market

3.2 Market characteristics

Chart on Market characteristics analysis

3.3 Value chain analysis

Chart on Value chain analysis

4. Market Sizing

4.1 Market definition

Data Table on Offerings of companies included in the market definition

4.2 Market segment analysis

Market segments

4.3 Market size 2025

4.4 Market outlook: Forecast for 2025-2030

Chart on Global - Market size and forecast 2025-2030 ($ thousand)
Data Table on Global - Market size and forecast 2025-2030 ($ thousand)
Chart on Global Market: Year-over-year growth 2025-2030 (%)
Data Table on Global Market: Year-over-year growth 2025-2030 (%)

5. Historic Market Size

5.1 Global Anti-Graffiti Coatings Market 2020 - 2024

Historic Market Size - Data Table on Global Anti-Graffiti Coatings Market 2020 - 2024 ($ thousand)

5.2 End-user segment analysis 2020 - 2024

Historic Market Size - End-user Segment 2020 - 2024 ($ thousand)

5.3 Type segment analysis 2020 - 2024

Historic Market Size - Type Segment 2020 - 2024 ($ thousand)

5.4 Technology segment analysis 2020 - 2024

Historic Market Size - Technology Segment 2020 - 2024 ($ thousand)

5.5 Geography segment analysis 2020 - 2024

Historic Market Size - Geography Segment 2020 - 2024 ($ thousand)

5.6 Country segment analysis 2020 - 2024

Historic Market Size - Country Segment 2020 - 2024 ($ thousand)

6. Qualitative Analysis

6.1 Impact of AI on Global Anti-graffiti Coatings Market

6.2 Impact of geopolitical conflicts on Global Anti-graffiti Coatings Market

7. Five Forces Analysis

7.1 Five forces summary

Five forces analysis - Comparison between 2025 and 2030

7.2 Bargaining power of buyers

Bargaining power of buyers - Impact of key factors 2025 and 2030

7.3 Bargaining power of suppliers

Bargaining power of suppliers - Impact of key factors in 2025 and 2030

7.4 Threat of new entrants

Threat of new entrants - Impact of key factors in 2025 and 2030

7.5 Threat of substitutes

Threat of substitutes - Impact of key factors in 2025 and 2030

7.6 Threat of rivalry

Threat of rivalry - Impact of key factors in 2025 and 2030

7.7 Market condition

Chart on Market condition - Five forces 2025 and 2030

8. Market Segmentation by End-user

8.1 Market segments

Chart on End-user - Market share 2025-2030 (%)
Data Table on End-user - Market share 2025-2030 (%)

8.2 Comparison by End-user

Chart on Comparison by End-user
Data Table on Comparison by End-user

8.3 Transportation - Market size and forecast 2025-2030

Chart on Transportation - Market size and forecast 2025-2030 ($ thousand)
Data Table on Transportation - Market size and forecast 2025-2030 ($ thousand)
Chart on Transportation - Year-over-year growth 2025-2030 (%)
Data Table on Transportation - Year-over-year growth 2025-2030 (%)

8.4 Construction - Market size and forecast 2025-2030

Chart on Construction - Market size and forecast 2025-2030 ($ thousand)
Data Table on Construction - Market size and forecast 2025-2030 ($ thousand)
Chart on Construction - Year-over-year growth 2025-2030 (%)
Data Table on Construction - Year-over-year growth 2025-2030 (%)

8.5 Market opportunity by End-user

Market opportunity by End-user ($ thousand)
Data Table on Market opportunity by End-user ($ thousand)

9. Market Segmentation by Type

9.1 Market segments

Chart on Type - Market share 2025-2030 (%)
Data Table on Type - Market share 2025-2030 (%)

9.2 Comparison by Type

Chart on Comparison by Type
Data Table on Comparison by Type

9.3 Non sacrificial - Market size and forecast 2025-2030

Chart on Non sacrificial - Market size and forecast 2025-2030 ($ thousand)
Data Table on Non sacrificial - Market size and forecast 2025-2030 ($ thousand)
Chart on Non sacrificial - Year-over-year growth 2025-2030 (%)
Data Table on Non sacrificial - Year-over-year growth 2025-2030 (%)

9.4 Semi sacrificial - Market size and forecast 2025-2030

Chart on Semi sacrificial - Market size and forecast 2025-2030 ($ thousand)
Data Table on Semi sacrificial - Market size and forecast 2025-2030 ($ thousand)
Chart on Semi sacrificial - Year-over-year growth 2025-2030 (%)
Data Table on Semi sacrificial - Year-over-year growth 2025-2030 (%)

9.5 Sacrificial - Market size and forecast 2025-2030

Chart on Sacrificial - Market size and forecast 2025-2030 ($ thousand)
Data Table on Sacrificial - Market size and forecast 2025-2030 ($ thousand)
Chart on Sacrificial - Year-over-year growth 2025-2030 (%)
Data Table on Sacrificial - Year-over-year growth 2025-2030 (%)

9.6 Market opportunity by Type

Market opportunity by Type ($ thousand)
Data Table on Market opportunity by Type ($ thousand)

10. Market Segmentation by Technology

10.1 Market segments

Chart on Technology - Market share 2025-2030 (%)
Data Table on Technology - Market share 2025-2030 (%)

10.2 Comparison by Technology

Chart on Comparison by Technology
Data Table on Comparison by Technology

10.3 Water based - Market size and forecast 2025-2030

Chart on Water based - Market size and forecast 2025-2030 ($ thousand)
Data Table on Water based - Market size and forecast 2025-2030 ($ thousand)
Chart on Water based - Year-over-year growth 2025-2030 (%)
Data Table on Water based - Year-over-year growth 2025-2030 (%)

10.4 Solvent based - Market size and forecast 2025-2030

Chart on Solvent based - Market size and forecast 2025-2030 ($ thousand)
Data Table on Solvent based - Market size and forecast 2025-2030 ($ thousand)
Chart on Solvent based - Year-over-year growth 2025-2030 (%)
Data Table on Solvent based - Year-over-year growth 2025-2030 (%)

10.5 Powder coating - Market size and forecast 2025-2030

Chart on Powder coating - Market size and forecast 2025-2030 ($ thousand)
Data Table on Powder coating - Market size and forecast 2025-2030 ($ thousand)
Chart on Powder coating - Year-over-year growth 2025-2030 (%)
Data Table on Powder coating - Year-over-year growth 2025-2030 (%)

10.6 Market opportunity by Technology

Market opportunity by Technology ($ thousand)
Data Table on Market opportunity by Technology ($ thousand)

11. Customer Landscape

11.1 Customer landscape overview

Analysis of price sensitivity, lifecycle, customer purchase basket, adoption rates, and purchase criteria

12. Geographic Landscape

12.1 Geographic segmentation

Chart on Market share by geography 2025-2030 (%)
Data Table on Market share by geography 2025-2030 (%)

12.2 Geographic comparison

Chart on Geographic comparison
Data Table on Geographic comparison

12.3 North America - Market size and forecast 2025-2030

Chart on North America - Market size and forecast 2025-2030 ($ thousand)
Data Table on North America - Market size and forecast 2025-2030 ($ thousand)
Chart on North America - Year-over-year growth 2025-2030 (%)
Data Table on North America - Year-over-year growth 2025-2030 (%)
Chart on Regional Comparison - North America
Data Table on Regional Comparison - North America

12.3.1 US - Market size and forecast 2025-2030

Chart on US - Market size and forecast 2025-2030 ($ thousand)
Data Table on US - Market size and forecast 2025-2030 ($ thousand)
Chart on US - Year-over-year growth 2025-2030 (%)
Data Table on US - Year-over-year growth 2025-2030 (%)

12.3.2 Canada - Market size and forecast 2025-2030

Chart on Canada - Market size and forecast 2025-2030 ($ thousand)
Data Table on Canada - Market size and forecast 2025-2030 ($ thousand)
Chart on Canada - Year-over-year growth 2025-2030 (%)
Data Table on Canada - Year-over-year growth 2025-2030 (%)

12.3.3 Mexico - Market size and forecast 2025-2030

Chart on Mexico - Market size and forecast 2025-2030 ($ thousand)
Data Table on Mexico - Market size and forecast 2025-2030 ($ thousand)
Chart on Mexico - Year-over-year growth 2025-2030 (%)
Data Table on Mexico - Year-over-year growth 2025-2030 (%)

12.4 Europe - Market size and forecast 2025-2030

Chart on Europe - Market size and forecast 2025-2030 ($ thousand)
Data Table on Europe - Market size and forecast 2025-2030 ($ thousand)
Chart on Europe - Year-over-year growth 2025-2030 (%)
Data Table on Europe - Year-over-year growth 2025-2030 (%)
Chart on Regional Comparison - Europe
Data Table on Regional Comparison - Europe

12.4.1 Germany - Market size and forecast 2025-2030

Chart on Germany - Market size and forecast 2025-2030 ($ thousand)
Data Table on Germany - Market size and forecast 2025-2030 ($ thousand)
Chart on Germany - Year-over-year growth 2025-2030 (%)
Data Table on Germany - Year-over-year growth 2025-2030 (%)

12.4.2 UK - Market size and forecast 2025-2030

Chart on UK - Market size and forecast 2025-2030 ($ thousand)
Data Table on UK - Market size and forecast 2025-2030 ($ thousand)
Chart on UK - Year-over-year growth 2025-2030 (%)
Data Table on UK - Year-over-year growth 2025-2030 (%)

12.4.3 France - Market size and forecast 2025-2030

Chart on France - Market size and forecast 2025-2030 ($ thousand)
Data Table on France - Market size and forecast 2025-2030 ($ thousand)
Chart on France - Year-over-year growth 2025-2030 (%)
Data Table on France - Year-over-year growth 2025-2030 (%)

12.4.4 Italy - Market size and forecast 2025-2030

Chart on Italy - Market size and forecast 2025-2030 ($ thousand)
Data Table on Italy - Market size and forecast 2025-2030 ($ thousand)
Chart on Italy - Year-over-year growth 2025-2030 (%)
Data Table on Italy - Year-over-year growth 2025-2030 (%)

12.4.5 Spain - Market size and forecast 2025-2030

Chart on Spain - Market size and forecast 2025-2030 ($ thousand)
Data Table on Spain - Market size and forecast 2025-2030 ($ thousand)
Chart on Spain - Year-over-year growth 2025-2030 (%)
Data Table on Spain - Year-over-year growth 2025-2030 (%)

12.4.6 The Netherlands - Market size and forecast 2025-2030

Chart on The Netherlands - Market size and forecast 2025-2030 ($ thousand)
Data Table on The Netherlands - Market size and forecast 2025-2030 ($ thousand)
Chart on The Netherlands - Year-over-year growth 2025-2030 (%)
Data Table on The Netherlands - Year-over-year growth 2025-2030 (%)

12.5 APAC - Market size and forecast 2025-2030

Chart on APAC - Market size and forecast 2025-2030 ($ thousand)
Data Table on APAC - Market size and forecast 2025-2030 ($ thousand)
Chart on APAC - Year-over-year growth 2025-2030 (%)
Data Table on APAC - Year-over-year growth 2025-2030 (%)
Chart on Regional Comparison - APAC
Data Table on Regional Comparison - APAC

12.5.1 China - Market size and forecast 2025-2030

Chart on China - Market size and forecast 2025-2030 ($ thousand)
Data Table on China - Market size and forecast 2025-2030 ($ thousand)
Chart on China - Year-over-year growth 2025-2030 (%)
Data Table on China - Year-over-year growth 2025-2030 (%)

12.5.2 Japan - Market size and forecast 2025-2030

Chart on Japan - Market size and forecast 2025-2030 ($ thousand)
Data Table on Japan - Market size and forecast 2025-2030 ($ thousand)
Chart on Japan - Year-over-year growth 2025-2030 (%)
Data Table on Japan - Year-over-year growth 2025-2030 (%)

12.5.3 India - Market size and forecast 2025-2030

Chart on India - Market size and forecast 2025-2030 ($ thousand)
Data Table on India - Market size and forecast 2025-2030 ($ thousand)
Chart on India - Year-over-year growth 2025-2030 (%)
Data Table on India - Year-over-year growth 2025-2030 (%)

12.5.4 South Korea - Market size and forecast 2025-2030

Chart on South Korea - Market size and forecast 2025-2030 ($ thousand)
Data Table on South Korea - Market size and forecast 2025-2030 ($ thousand)
Chart on South Korea - Year-over-year growth 2025-2030 (%)
Data Table on South Korea - Year-over-year growth 2025-2030 (%)

12.5.5 Australia - Market size and forecast 2025-2030

Chart on Australia - Market size and forecast 2025-2030 ($ thousand)
Data Table on Australia - Market size and forecast 2025-2030 ($ thousand)
Chart on Australia - Year-over-year growth 2025-2030 (%)
Data Table on Australia - Year-over-year growth 2025-2030 (%)

12.5.6 Indonesia - Market size and forecast 2025-2030

Chart on Indonesia - Market size and forecast 2025-2030 ($ thousand)
Data Table on Indonesia - Market size and forecast 2025-2030 ($ thousand)
Chart on Indonesia - Year-over-year growth 2025-2030 (%)
Data Table on Indonesia - Year-over-year growth 2025-2030 (%)

12.6 South America - Market size and forecast 2025-2030

Chart on South America - Market size and forecast 2025-2030 ($ thousand)
Data Table on South America - Market size and forecast 2025-2030 ($ thousand)
Chart on South America - Year-over-year growth 2025-2030 (%)
Data Table on South America - Year-over-year growth 2025-2030 (%)
Chart on Regional Comparison - South America
Data Table on Regional Comparison - South America

12.6.1 Brazil - Market size and forecast 2025-2030

Chart on Brazil - Market size and forecast 2025-2030 ($ thousand)
Data Table on Brazil - Market size and forecast 2025-2030 ($ thousand)
Chart on Brazil - Year-over-year growth 2025-2030 (%)
Data Table on Brazil - Year-over-year growth 2025-2030 (%)

12.6.2 Argentina - Market size and forecast 2025-2030

Chart on Argentina - Market size and forecast 2025-2030 ($ thousand)
Data Table on Argentina - Market size and forecast 2025-2030 ($ thousand)
Chart on Argentina - Year-over-year growth 2025-2030 (%)
Data Table on Argentina - Year-over-year growth 2025-2030 (%)

12.6.3 Chile - Market size and forecast 2025-2030

Chart on Chile - Market size and forecast 2025-2030 ($ thousand)
Data Table on Chile - Market size and forecast 2025-2030 ($ thousand)
Chart on Chile - Year-over-year growth 2025-2030 (%)
Data Table on Chile - Year-over-year growth 2025-2030 (%)

12.7 Middle East and Africa - Market size and forecast 2025-2030

Chart on Middle East and Africa - Market size and forecast 2025-2030 ($ thousand)
Data Table on Middle East and Africa - Market size and forecast 2025-2030 ($ thousand)
Chart on Middle East and Africa - Year-over-year growth 2025-2030 (%)
Data Table on Middle East and Africa - Year-over-year growth 2025-2030 (%)
Chart on Regional Comparison - Middle East and Africa
Data Table on Regional Comparison - Middle East and Africa

12.7.1 Saudi Arabia - Market size and forecast 2025-2030

Chart on Saudi Arabia - Market size and forecast 2025-2030 ($ thousand)
Data Table on Saudi Arabia - Market size and forecast 2025-2030 ($ thousand)
Chart on Saudi Arabia - Year-over-year growth 2025-2030 (%)
Data Table on Saudi Arabia - Year-over-year growth 2025-2030 (%)

12.7.2 UAE - Market size and forecast 2025-2030

Chart on UAE - Market size and forecast 2025-2030 ($ thousand)
Data Table on UAE - Market size and forecast 2025-2030 ($ thousand)
Chart on UAE - Year-over-year growth 2025-2030 (%)
Data Table on UAE - Year-over-year growth 2025-2030 (%)

12.7.3 South Africa - Market size and forecast 2025-2030

Chart on South Africa - Market size and forecast 2025-2030 ($ thousand)
Data Table on South Africa - Market size and forecast 2025-2030 ($ thousand)
Chart on South Africa - Year-over-year growth 2025-2030 (%)
Data Table on South Africa - Year-over-year growth 2025-2030 (%)

12.7.4 Israel - Market size and forecast 2025-2030

Chart on Israel - Market size and forecast 2025-2030 ($ thousand)
Data Table on Israel - Market size and forecast 2025-2030 ($ thousand)
Chart on Israel - Year-over-year growth 2025-2030 (%)
Data Table on Israel - Year-over-year growth 2025-2030 (%)

12.7.5 Turkey - Market size and forecast 2025-2030

Chart on Turkey - Market size and forecast 2025-2030 ($ thousand)
Data Table on Turkey - Market size and forecast 2025-2030 ($ thousand)
Chart on Turkey - Year-over-year growth 2025-2030 (%)
Data Table on Turkey - Year-over-year growth 2025-2030 (%)

12.8 Market opportunity by geography

Market opportunity by geography ($ thousand)
Data Tables on Market opportunity by geography ($ thousand)

13. Drivers, Challenges, and Opportunity

13.1 Market drivers

Urban infrastructure expansion and vandalism mitigation
Technological advancements in nanotechnology integration
Heritage Building Preservation and Conservation

13.2 Market challenges

High initial costs and budget constraints
Stringent environmental regulations and formulation compliance
Technical application barriers and substrate compatibility

13.3 Impact of drivers and challenges

Impact of drivers and challenges in 2025 and 2030

13.4 Market opportunities

Renewable energy asset defense
Bio-based sustainable formulations
Smart digital asset integration

14. Competitive Landscape

14.1 Overview

14.2

Overview on criticality of inputs and factors of differentiation

14.3 Landscape disruption

Overview on factors of disruption

14.4 Industry risks

Impact of key risks on business

15. Competitive Analysis

15.1 Companies profiled

Companies covered

15.2 Company ranking index

15.3 Market positioning of companies

Matrix on companies position and classification

15.4 Akzo Nobel NV

Akzo Nobel NV - Overview
Akzo Nobel NV - Business segments
Akzo Nobel NV - Key offerings
Akzo Nobel NV - Segment focus
SWOT

15.5 Avery Dennison Corp.

Avery Dennison Corp. - Overview
Avery Dennison Corp. - Business segments
Avery Dennison Corp. - Key news
Avery Dennison Corp. - Key offerings
Avery Dennison Corp. - Segment focus
SWOT

15.6 Axalta Coating Systems Ltd.

Axalta Coating Systems Ltd. - Overview
Axalta Coating Systems Ltd. - Business segments
Axalta Coating Systems Ltd. - Key offerings
Axalta Coating Systems Ltd. - Segment focus
SWOT

15.7 BASF SE

BASF SE - Overview
BASF SE - Business segments
BASF SE - Key news
BASF SE - Key offerings
BASF SE - Segment focus
SWOT

15.8 CSL Silicones Inc.

CSL Silicones Inc. - Overview
CSL Silicones Inc. - Product / Service
CSL Silicones Inc. - Key offerings
SWOT

15.9 Evonik Industries AG

Evonik Industries AG - Overview
Evonik Industries AG - Business segments
Evonik Industries AG - Key news
Evonik Industries AG - Key offerings
Evonik Industries AG - Segment focus
SWOT

15.10 FSC Coatings Inc.

FSC Coatings Inc. - Overview
FSC Coatings Inc. - Product / Service
FSC Coatings Inc. - Key offerings
SWOT

15.11 Hydron Protective Coatings Ltd.

Hydron Protective Coatings Ltd. - Overview
Hydron Protective Coatings Ltd. - Product / Service
Hydron Protective Coatings Ltd. - Key offerings
SWOT

15.12 PPG Industries Inc.

PPG Industries Inc. - Overview
PPG Industries Inc. - Business segments
PPG Industries Inc. - Key offerings
PPG Industries Inc. - Segment focus
SWOT

15.13 PROSOCO Inc.

PROSOCO Inc. - Overview
PROSOCO Inc. - Product / Service
PROSOCO Inc. - Key offerings
SWOT

15.14 Sika AG

Sika AG - Overview
Sika AG - Business segments
Sika AG - Key news
Sika AG - Key offerings
Sika AG - Segment focus
SWOT

15.15 Teknos Group Oy

Teknos Group Oy - Overview
Teknos Group Oy - Product / Service
Teknos Group Oy - Key offerings
SWOT

15.16 The Sherwin Williams Co.

The Sherwin Williams Co. - Overview
The Sherwin Williams Co. - Business segments
The Sherwin Williams Co. - Key offerings
The Sherwin Williams Co. - Segment focus
SWOT

15.17 W. R. Meadows Inc.

W. R. Meadows Inc. - Overview
W. R. Meadows Inc. - Product / Service
W. R. Meadows Inc. - Key offerings
SWOT

15.18 Wacker Chemie AG

Wacker Chemie AG - Overview
Wacker Chemie AG - Business segments
Wacker Chemie AG - Key offerings
Wacker Chemie AG - Segment focus
SWOT

16. Appendix

16.1 Scope of the report

Market definition
Objectives
Notes and caveats

16.2 Inclusions and exclusions checklist

Inclusions checklist
Exclusions checklist

16.3 Currency conversion rates for US$

16.4 Research methodology

16.5 Data procurement

Information sources

16.6 Data validation

16.7 Validation techniques employed for market sizing

16.8 Data synthesis

16.9 360 degree market analysis

16.10 List of abbreviations

Research Methodology

Technavio presents a detailed picture of the market by way of study, synthesis, and summation of data from multiple sources. The analysts have presented the various facets of the market with a particular focus on identifying the key industry influencers. The data thus presented is comprehensive, reliable, and the result of extensive research, both primary and secondary.

INFORMATION SOURCES

Primary sources

  • Manufacturers and suppliers
  • Channel partners
  • Industry experts
  • Strategic decision makers

Secondary sources

  • Industry journals and periodicals
  • Government data
  • Financial reports of key industry players
  • Historical data
  • Press releases

DATA ANALYSIS

Data Synthesis

  • Collation of data
  • Estimation of key figures
  • Analysis of derived insights

Data Validation

  • Triangulation with data models
  • Reference against proprietary databases
  • Corroboration with industry experts

REPORT WRITING

Qualitative

  • Market drivers
  • Market challenges
  • Market trends
  • Five forces analysis

Quantitative

  • Market size and forecast
  • Market segmentation
  • Geographical insights
  • Competitive landscape

Interested in this report?

Get your sample now to see our research methodology and insights!

Download Now

Frequently Asked Questions

Anti-Graffiti Coatings market growth will increase by USD 25619.9 thousand thousand during 2026-2030.

The Anti-Graffiti Coatings market is expected to grow at a CAGR of 4.6% during 2026-2030.

Anti-Graffiti Coatings market is segmented by End-user (Transportation, Construction) Type (Non sacrificial, Semi sacrificial, Sacrificial) Technology (Water based, Solvent based, Powder coating)

Akzo Nobel NV, Avery Dennison Corp., Axalta Coating Systems Ltd., BASF SE, ChemMasters Inc., CSL Silicones Inc., Evonik Industries AG, FSC Coatings Inc., Graffiti Shield Inc., Hydron Protective Coatings Ltd., Monopole Inc., PPG Industries Inc., PROSOCO Inc., Sika AG, Teknos Group Oy, The Sherwin Williams Co., W. R. Meadows Inc., Wacker Chemie AG, Watson Coatings Inc. are a few of the key vendors in the Anti-Graffiti Coatings market.

North America will register the highest growth rate of 48.2% among the other regions. Therefore, the Anti-Graffiti Coatings market in North America is expected to garner significant business opportunities for the vendors during the forecast period.

US, Canada, Mexico, Germany, UK, France, Italy, Spain, The Netherlands, China, Japan, India, South Korea, Australia, Indonesia, Brazil, Argentina, Chile, Saudi Arabia, UAE, South Africa, Israel, Turkey

  • Urban infrastructure expansion and vandalism mitigation is the driving factor this market.

The Anti-Graffiti Coatings market vendors should focus on grabbing business opportunities from the End-user segment as it accounted for the largest market share in the base year.
RIA - Research AI Assistant
Ask RIA
