
India Antivirus Market Size 2025-2029
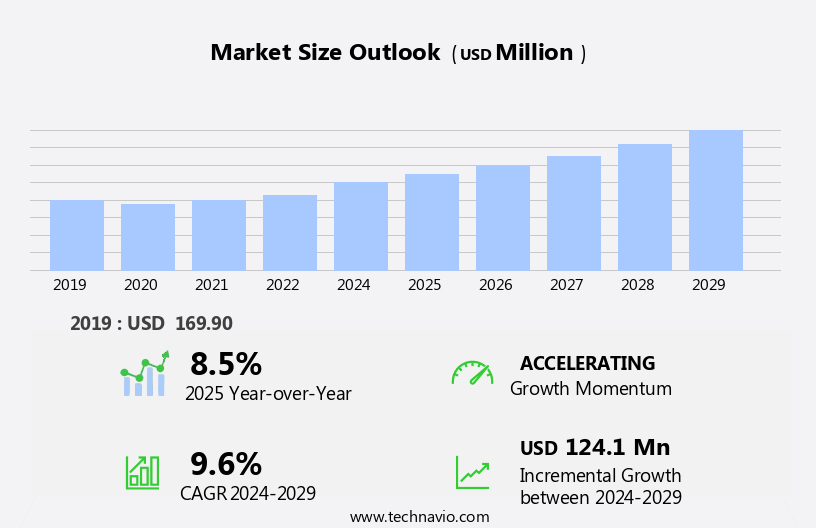
The India antivirus market size is forecast to increase by USD 124.1 million, at a CAGR of 9.6% between 2024 and 2029.
- The market is experiencing significant growth, driven by the increasing use of mobile devices and the adoption of cloud-based antivirus software. With the proliferation of smartphones and tablets, the need to secure these devices against malware and viruses has become paramount. Simultaneously, cloud-based antivirus solutions have gained popularity due to their ability to provide real-time protection and ease of use. Another trend is the advent of cloud-based antivirus software, which offers advantages such as real-time protection and easy deployment. However, the market faces challenges. Complex IT infrastructure in organizations can make antivirus implementation and management a complex process. Regulatory hurdles, such as data privacy laws, also impact adoption. Furthermore, supply chain inconsistencies can lead to challenges in ensuring the availability and reliability of antivirus solutions.
- Companies seeking to capitalize on market opportunities must focus on addressing these challenges by providing user-friendly, cost-effective, and efficient antivirus solutions tailored to the Indian market. Additionally, staying abreast of regulatory requirements and maintaining strong partnerships with IT infrastructure providers can help navigate these challenges effectively. Additionally, the use of artificial intelligence and machine learning technologies in antivirus solutions is a significant trend, enabling better threat detection and response.
What will be the size of the India Antivirus Market during the forecast period?
- In the dynamic Indian antivirus market, cybersecurity threats continue to evolve, necessitating robust solutions for businesses. Phishing attacks and malicious websites pose significant risks, leading companies to invest in cybersecurity insurance and compliance management. Cybersecurity frameworks, such as PCI DSS, provide guidelines for data privacy and security assessments. Ransomware attacks and zero-day threats demand advanced threat detection and malware analysis using heuristic analysis and signature-based detection. Access control, secure development practices, and multi-factor authentication are crucial for preventing unauthorized access. Cloud security, security analytics, and security orchestration are essential for managing and mitigating threats in the digital age. Automated vulnerability scans and spam filters further bolster protection against various threat vectors, including pop-ups and phishing emails.
- Mobile malware and SQL injection attacks targeting businesses necessitate security awareness training and security incident response. Advanced persistent threats, social engineering, and denial-of-service attacks require a proactive approach to risk management. Firewall management, security intelligence, and disaster recovery planning are vital components of a comprehensive cybersecurity strategy. Security automation and managed security services streamline operations, while threat detection and security analytics provide real-time insights. Single sign-on and security incident response ensure business continuity. Wireless security and secure development practices are essential for mitigating risks in today's interconnected world. The market is witnessing significant growth due to several factors. The increasing use of PCs, laptops, smartphones, and social networking sites has led to a wave in cybersecurity threats.
How is this market segmented?
The market research report provides comprehensive data (region-wise segment analysis), with forecasts and estimates in "USD million" for the period 2025-2029, as well as historical data from 2019-2023 for the following segments.
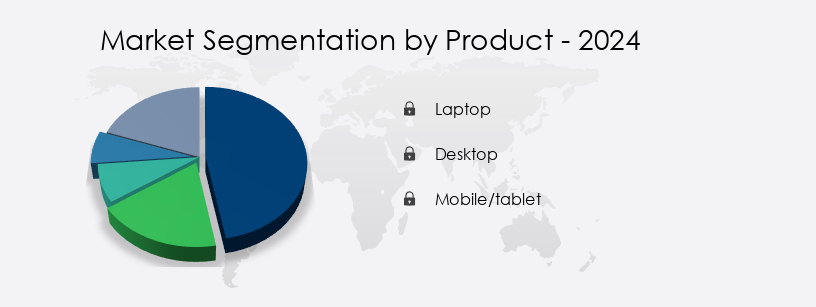
- Product
- Laptop
- Desktop
- Mobile/tablet
- End-user
- Enterprise
- Individual
- Government
- Product Type
- Standalone antivirus software
- Integrated security suites
- Cloud-based antivirus
- Geography
- APAC
- India
- APAC
By Product Insights
The laptop segment is estimated to witness significant growth during the forecast period. The market is witnessing significant growth, driven by the increasing adoption of digital security solutions in various sectors. Large enterprises are prioritizing data loss prevention, security analytics, and vulnerability scanning to safeguard their sensitive information. Real-time protection, security policies, and behavioral analysis are essential components of modern security management. Virus detection and malware protection remain critical in the face of evolving threat landscape, while cloud-based security and disaster recovery are becoming increasingly popular. The education sector is also investing in digital security, focusing on multi-factor authentication and data backup to protect student information. Financial institutions are implementing machine learning and artificial intelligence to enhance security posture and monitor threats in real-time.
Healthcare organizations are prioritizing network security and implementing security best practices to protect patient data. The laptop segment continues to dominate the market due to its widespread use in businesses and homes. With the rise of remote work and bring-your-own-device policies, laptops are becoming increasingly vulnerable to security risks. Intrusion prevention systems, security monitoring, and incident response are essential to mitigate these risks. Ransomware protection and security automation are becoming essential features for antivirus software, as cybercriminals continue to exploit vulnerabilities. Security services, security certifications, and business continuity plans are also crucial components of a robust security strategy.
The mobile security market is also growing rapidly, with the increasing use of smartphones and tablets for business and personal use. Mobile security solutions offer secure browsing, endpoint security, and password management to protect against threats. The market is evolving to meet the changing security needs of businesses and individuals. Antivirus software is no longer just about virus detection; it is about comprehensive security solutions that address the entire threat landscape. Security awareness training, security orchestration, and threat intelligence are essential components of a holistic security strategy. With the proliferation of social media and smart connected devices, network security has become a top priority for both individuals and organizations.
Get a glance at the market share of various segments Request Free Sample
The Laptop segment was valued at USD 88.80 million in 2019 and showed a gradual increase during the forecast period.
Market Dynamics
Our researchers analyzed the data with 2024 as the base year, along with the key drivers, trends, and challenges. A holistic analysis of drivers will help companies refine their marketing strategies to gain a competitive advantage.
What are the key market drivers leading to the rise in the adoption of Antivirus in India Industry?
- The prevalent trend of heightened mobile device utilization serves as the primary catalyst for market growth. The market is witnessing significant growth due to the increasing use of mobile devices and the subsequent rise in security risks. With more individuals and businesses relying on mobile phones, laptops, and tablets for personal and professional purposes, the need for robust security solutions is escalating. The proliferation of Internet access through these devices amplifies the threat landscape, increasing the likelihood of data breaches and cyberattacks. Technological advancements have led to the acceptance of mobile devices for various transactions, such as m-commerce, bill payments, and GPS services. This increased usage exposes sensitive information to potential threats, necessitating advanced security measures.
- Security monitoring, machine learning, artificial intelligence, intrusion detection systems, and disaster recovery are essential components of a comprehensive security posture. Security awareness and best practices are crucial for both home users and organizations, including healthcare organizations and government agencies, to mitigate risks and protect their digital assets. Network security is another critical aspect, as the interconnectedness of devices and systems increases the attack surface. Security operations centers play a pivotal role in identifying, analyzing, and responding to security incidents. Implementing security solutions that employ machine learning and artificial intelligence can help organizations stay ahead of emerging threats and maintain a strong security posture.
What are the market trends shaping the Antivirus in India Industry?
- The emerging trend in the market is the adoption of cloud-based antivirus software. This modern approach to cybersecurity offers numerous benefits, including real-time threat detection and automatic updates. In today's digital landscape, cloud-based endpoint security solutions have become essential for businesses to safeguard their data from evolving security threats. With the rise of remote work and the increasing adoption of cloud-based services for business functions such as CRM, payroll, and enterprise communication, the need to secure data in the cloud has become paramount. Endpoint security in the cloud includes security incidents prevention, security hardening, password management, security compliance, security orchestration, security awareness training, security services, security certifications, business continuity, penetration testing, threat intelligence, and network segmentation. Cloud-based antivirus software services are adopted for various purposes, including authentication, video management systems, and storing biometric information.
- The flexibility and scalability of these solutions cater to the varying needs of consumers, making them an attractive option for businesses. Moreover, cloud-based security solutions are cost-effective and do not require an infrastructure for their implementation, making them an ideal choice for Small and Medium-sized Enterprises (SMEs). The increasing employee mobility has further fueled the demand for cloud-based security solutions. These solutions enable remote access to data, ensuring business continuity and productivity. Zero trust and security operations are emerging trends in the market, reflecting the evolving nature of cyber threats and the importance of network signals in detecting and mitigating attacks.
What challenges does the Antivirus in India Industry face during its growth?
- The intricacy of IT infrastructure poses a significant challenge to the industry's growth. With the increasing complexity of technology systems, businesses must invest heavily in maintaining and upgrading their infrastructure to remain competitive. This challenge is further compounded by the need for seamless integration of new technologies and the requirement for robust security measures to protect sensitive data. Effective management of IT infrastructure is crucial for driving industry growth and ensuring business continuity. In today's interconnected business landscape, the increasing adoption of Internet of Things (IoT) devices and cloud computing has led to a complex IT infrastructure.
- Security policies and security management systems are essential for implementing robust security controls. Intrusion prevention systems and vulnerability scanning help identify and address potential threats before they can cause damage. Moreover, security analytics and data loss prevention are critical for monitoring network traffic and safeguarding sensitive information. Secure browsing and online security are also essential components of a comprehensive digital security strategy. Threat landscape is constantly evolving, and businesses must stay updated on the latest security trends and best practices to ensure their networks remain protected. In this advanced connected network, antivirus software plays a vital role in securing businesses against various cyber threats. Small-Medium Enterprises (SMEs), educational hubs, and other businesses are recognizing the importance of cyber security and turning to solution companies for antivirus software applications to safeguard their digital assets and prevent financial losses.
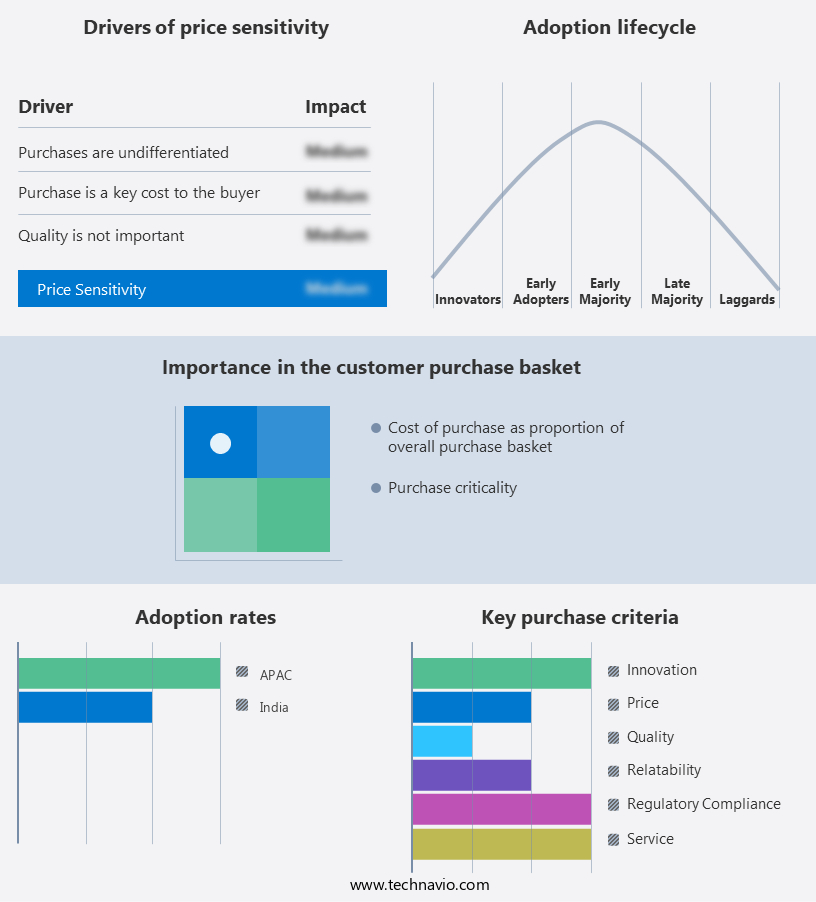
Exclusive Customer Landscape
The antivirus market in India forecasting report includes the adoption lifecycle of the market, covering from the innovator’s stage to the laggard’s stage. It focuses on adoption rates in different regions based on penetration. Furthermore, the antivirus market in India report also includes key purchase criteria and drivers of price sensitivity to help companies evaluate and develop their market growth analysis strategies.
Customer Landscape
Key Companies & Market Insights
Companies are implementing various strategies, such as strategic alliances, antivirus market in India forecast, partnerships, mergers and acquisitions, geographical expansion, and product/service launches, to enhance their presence in the industry.
ALLIT Service LLC - The company provides comprehensive digital security solutions, including KasperskyTotalSecurity.
The industry research and growth report includes detailed analyses of the competitive landscape of the market and information about key companies, including:
- ALLIT Service LLC
- AO Kaspersky Lab
- Avast Software sro
- BD Software Distribution Pvt Ltd.
- Biz Secure Labs Pvt. Ltd.
- ESET North America
- F Secure Corp.
- Gen Digital Inc.
- K7 Computing Pvt Ltd.
- Max Secure Software
- McAfee LLC
- MicroWorld Technologies Inc.
- Norton Enterprises Inc
- Quick Heal Technologies Ltd.
- Sophos Ltd.
- Trend Micro Inc.
- Webroot
Qualitative and quantitative analysis of companies has been conducted to help clients understand the wider business environment as well as the strengths and weaknesses of key industry players. Data is qualitatively analyzed to categorize companies as pure play, category-focused, industry-focused, and diversified; it is quantitatively analyzed to categorize companies as dominant, leading, strong, tentative, and weak.
Recent Development and News in Antivirus Market In India
- In January 2023, leading antivirus provider, McAfee, announced the launch of McAfee Endpoint Security for Managed Service Providers (MSPs) in India. This new solution aims to help MSPs protect their clients from advanced cyber threats more effectively (McAfee Press Release, 2023).
- In March 2024, Symantec, another major antivirus company, formed a strategic partnership with Tata Communications, a leading digital infrastructure provider in India. The collaboration aims to offer enhanced cybersecurity solutions to businesses in India, leveraging Tata Communications' extensive network and Symantec's advanced threat intelligence (Symantec Press Release, 2024).
- In August 2024, Kaspersky, a global cybersecurity company, secured significant funding of USD100 million from its investors to expand its operations in India. The investment will be used to strengthen its presence in the Indian market and develop advanced cybersecurity solutions tailored to local needs (Kaspersky Press Release, 2024).
Research Analyst Overview
The market continues to evolve, with dynamic market dynamics shaping the landscape. Endpoint security remains a priority, as organizations across various sectors grapple with the ongoing threat of security incidents. Security hardening, password management, and security compliance are essential components of robust security strategies. The importance of real-time protection against viruses and malware is paramount, with online and internet security being a significant concern. Intrusion prevention systems and security management are crucial for safeguarding against potential threats. Behavioral analysis and digital security are integral to maintaining a strong security posture. Secure browsing and security controls are essential for home users and financial institutions alike.
The Antivirus Market in India is evolving rapidly, integrating multidevice protection and parental control to enhance security. With rising concerns over fraud prevention and identity theft protection, solutions now include password managers for safer digital interactions. Businesses are investing in cybersecurity awareness and security training to strengthen defenses, alongside advanced threat modeling and security posture management. The role of security operations centers and cloud security posture management is expanding, ensuring proactive risk mitigation. Adopting a secure development lifecycle is crucial, supported by security consulting, security research, and adherence to security standards.
The threat landscape is ever-evolving, with ransomware protection and cloud-based security becoming increasingly important. Education institutions and healthcare organizations are not immune to security risks, making data backup and disaster recovery essential. Multi-factor authentication and data encryption are critical security solutions for financial institutions. Large enterprises require incident response plans and security audits to mitigate potential risks. Penetration testing and threat intelligence are vital for identifying and addressing security vulnerabilities. Network segmentation and security orchestration enable effective security monitoring and response. Security services and certifications ensure compliance with industry standards. The ongoing unfolding of market activities reveals a continuous need for security solutions that adapt to the evolving threat landscape.
Business continuity planning and machine learning are becoming increasingly important in the face of sophisticated cyber attacks. Mobile security and security policies are essential for organizations with remote workforces. The security landscape is ever-changing, with new threats emerging constantly. Security awareness training is crucial for all employees to stay informed and vigilant against potential threats. StartFragment
The Antivirus Market in India is witnessing significant expansion, driven by continuous market research and growth initiatives. Companies are leveraging market growth and forecasting techniques to anticipate industry trends and develop robust security solutions. With precise market forecasting, businesses can align their strategies to address emerging cyber threats effectively. Regular market reports provide insights into technological advancements and evolving consumer needs. The market forecast indicates sustained demand for antivirus solutions due to increasing cyber risks and digital transformation.
EndFragment Government agencies and security operations centers play a vital role in ensuring the security of critical infrastructure. In this continuously evolving market, antivirus software remains a crucial component of any comprehensive security strategy. System optimization and security automation are essential for maintaining optimal performance and efficiency.StartFragment
The Antivirus Market in India is experiencing rapid growth as small and medium businesses and enterprises prioritize endpoint protection and data security. With increasing data breaches, zeroday exploits, and data leakage, businesses seek robust malware detection and virus removal solutions. Security vendors are leveraging deep learning to enhance threat detection, while cloud services are reshaping security policy implementations. Regular vulnerability assessment and security patching are critical to mitigating risks.
EndFragment
The integration of artificial intelligence and security best practices ensures that organizations remain one step ahead of potential threats.
Dive into Technavio’s robust research methodology, blending expert interviews, extensive data synthesis, and validated models for unparalleled Antivirus Market in India insights. See full methodology.
|
Market Scope |
|
|
Report Coverage |
Details |
|
Page number |
157 |
|
Base year |
2024 |
|
Historic period |
2019-2023 |
|
Forecast period |
2025-2029 |
|
Growth momentum & CAGR |
Accelerate at a CAGR of 9.6% |
|
Market growth 2025-2029 |
USD 124.1 million |
|
Market structure |
Fragmented |
|
YoY growth 2024-2025(%) |
8.5 |
|
Key countries |
India |
|
Competitive landscape |
Leading Companies, Market Positioning of Companies, Competitive Strategies, and Industry Risks |
What are the Key Data Covered in this Antivirus Market in India Research and Growth Report?
- CAGR of the Antivirus in India industry during the forecast period
- Detailed information on factors that will drive the growth and forecasting between 2025 and 2029
- Precise estimation of the size of the market and its contribution of the industry in focus to the parent market
- Accurate predictions about upcoming growth and trends and changes in consumer behaviour
- Growth of the market across India
- Thorough analysis of the market’s competitive landscape and detailed information about companies
- Comprehensive analysis of factors that will challenge the antivirus market in India growth of industry companies
We can help! Our analysts can customize this antivirus market in India research report to meet your requirements.
 RIA -
RIA - 
