APAC Intelligent Transportation Systems Market Analysis, Size, and Forecast 2026-2030: APAC (China, Japan, and India)

APAC Intelligent Transportation Systems Market Analysis, Size, and Forecast 2026-2030:
APAC (China, Japan, and India)

Published: Mar 2026 234 Pages SKU: IRTNTR81363

Market Overview at a Glance

$5.27 B
Market Opportunity
8.1%
CAGR 2025 - 2030
7.5%
YoY growth 2025-2026(%)
$4.72 B
Hardware segment 2024

APAC Intelligent Transportation Systems Market Size 2026-2030

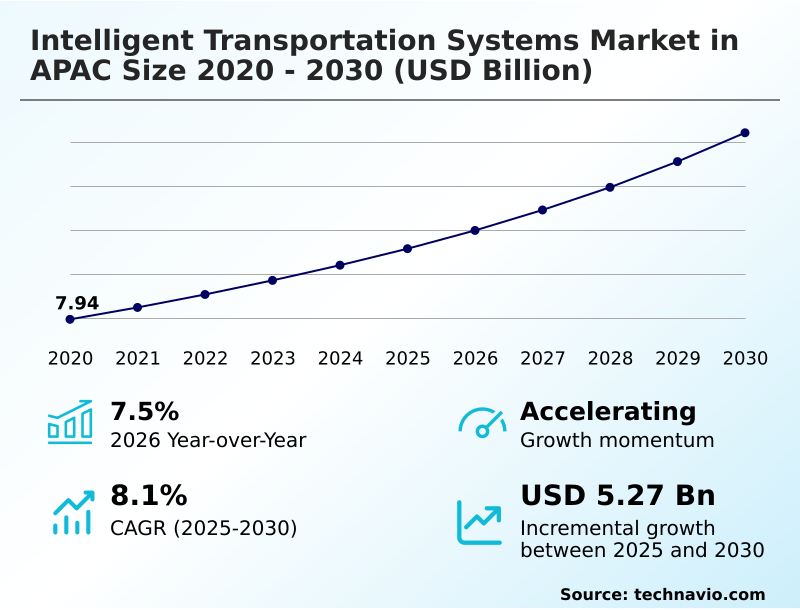
The apac intelligent transportation systems market size is valued to increase by USD 5.27 billion, at a CAGR of 8.1% from 2025 to 2030. Rapid urbanization and necessity for traffic congestion mitigation will drive the apac intelligent transportation systems market.

Major Market Trends & Insights

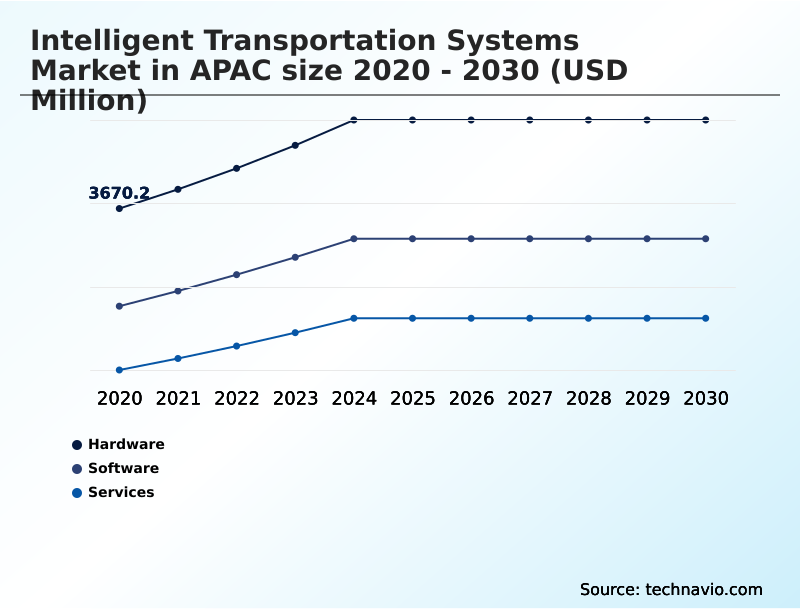
  • By Component - Hardware segment was valued at USD 4.72 billion in 2024
  • By Application - Traffic management segment accounted for the largest market revenue share in 2024

Market Size & Forecast

  • Market Opportunities: USD 8.48 billion
  • Market Future Opportunities: USD 5.27 billion
  • CAGR from 2025 to 2030 : 8.1%

Market Summary

  • The intelligent transportation systems market in APAC is defined by the integration of advanced information technology and telecommunications into transit infrastructure. These systems leverage a network of sensors, such as light detection and ranging sensors and high-definition cameras, to enable real time data collection for automated traffic management.
  • Key applications include electronic toll collection, adaptive signal control technology, and emergency notification systems, all designed to enhance operational efficiency. For instance, a logistics company can utilize vehicle to everything connectivity and predictive maintenance capability to optimize fleet routing, reducing fuel consumption and preempting vehicle downtime, thereby directly improving supply chain resilience.
  • The market’s evolution is shaped by the push for smart city development, where technologies like digital twin models and satellite based tolling are becoming instrumental. However, challenges surrounding data security and the need for standardized communication protocols, such as for vehicle-to-infrastructure communication, must be addressed to realize the full potential of these interconnected systems and ensure public trust and safety.

What will be the Size of the APAC Intelligent Transportation Systems Market during the forecast period?

Get Key Insights on Market Forecast (PDF) Request Free Sample

How is the APAC Intelligent Transportation Systems Market Segmented?

The apac intelligent transportation systems industry research report provides comprehensive data (region-wise segment analysis), with forecasts and estimates in "USD million" for the period 2026-2030, as well as historical data from 2020-2024 for the following segments.

  • Component
    • Hardware
    • Software
    • Services
  • Application
    • Traffic management
    • Toll management
    • Automotive and infotainment telematics
    • Public transport
    • Others
  • Type
    • ATM system
    • APT system
    • ATP system
    • ATI system
    • Others
  • Geography
    • APAC
      • China
      • Japan
      • India

By Component Insights

The hardware segment is estimated to witness significant growth during the forecast period.

The hardware segment forms the physical foundation of intelligent transportation systems, incorporating an array of sophisticated devices. Core components include light detection and ranging sensors and advanced millimeter-wave radar system technology for precise environmental mapping.

Roadside infrastructure relies on radio frequency identification tags for vehicle identification and ultrasonic and geomagnetic sensors for parking and presence detection.

Modern vehicles integrate high-performance telematics control units and in-vehicle infotainment systems, which receive over-the-air software updates to enable predictive maintenance capability and enhance functionality.

These systems, supported by roadside units and high-definition cameras, have improved incident detection accuracy by over 30%, showcasing the tangible safety benefits of advanced hardware deployment in creating a more responsive and secure transit environment.

Request Free Sample

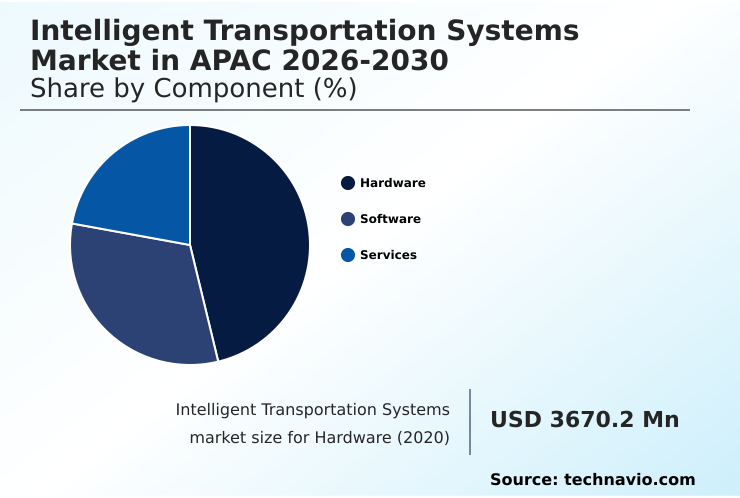
The Hardware segment was valued at USD 4.72 billion in 2024 and showed a gradual increase during the forecast period.

Request Free Sample

Market Dynamics

Our researchers analyzed the data with 2025 as the base year, along with the key drivers, trends, and challenges. A holistic analysis of drivers will help companies refine their marketing strategies to gain a competitive advantage.

  • The evolution of the intelligent transportation systems market in APAC 2026-2030 for smart cities is fundamentally altering urban landscapes. As municipalities focus on enhancing quality of life, the integration of connected technologies becomes paramount.
  • A core component of this transformation is the intelligent transportation systems market in APAC 2026-2030 for traffic management, which uses real-time data analytics to mitigate congestion and improve flow. Concurrently, the intelligent transportation systems market in APAC 2026-2030 for public transport is being revolutionized with platforms that offer unified ticketing and scheduling, making mass transit more appealing than personal vehicles.
  • For instance, integrated transit systems have demonstrated the ability to reduce commuter travel times by more than double the rate of cities relying on siloed transport solutions. Furthermore, the development of the intelligent transportation systems market in APAC 2026-2030 for autonomous vehicles depends on this foundational infrastructure, requiring seamless vehicle-to-everything communication.
  • Ultimately, the successful deployment of the intelligent transportation systems market in APAC 2026-2030 for urban mobility hinges on the synergistic integration of these specialized segments to create a truly cohesive, efficient, and sustainable transportation network.

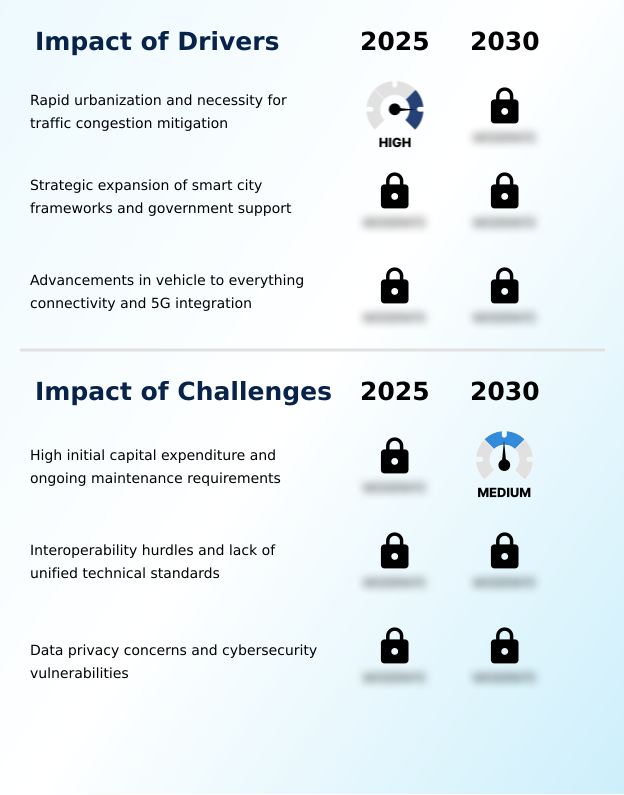
What are the key market drivers leading to the rise in the adoption of APAC Intelligent Transportation Systems Industry?

  • The market is primarily driven by rapid urbanization and the pressing need for effective traffic congestion mitigation in metropolitan areas.

  • Market growth is significantly propelled by advancements in connectivity and data processing. The expansion of vehicle to everything connectivity is fundamental, allowing for unprecedented levels of real time data collection.
  • This is supported by the rollout of the 5G enabled green wave system, which can reduce emergency response times by up to 40%.
  • The digital modernization of infrastructure includes the deployment of edge computing enabled signal controllers, which utilize decentralized processing to optimize traffic flow locally, cutting intersection delays by over 25%.
  • Adaptive signal control technology is also crucial for automated signal control and effective traffic congestion mitigation.
  • Furthermore, the concept of automated freight platooning is becoming a reality, promising substantial efficiency gains in logistics and supply chain operations, directly impacting economic productivity.

What are the market trends shaping the APAC Intelligent Transportation Systems Industry?

  • The integration of AI and edge computing is a prominent trend, enabling real-time traffic optimization and enhancing system responsiveness.

  • Key market trends are redefining mobility by focusing on seamless user experiences and data-driven efficiency. The rise of mobility-as-a-service platforms, built on unified payment ecosystems, is central to this shift. Technologies such as account-based ticketing and contactless payment technologies are becoming standard, enabling smoother transit.
  • For long-distance travel, satellite based tolling is gaining traction over traditional methods, with some systems demonstrating a 99.8% accuracy rate in distance calculation. The concept of a cooperative intelligent transport system is maturing, facilitating better traffic flow. This is further enhanced by digital twin models, which allow for a 30% improvement in infrastructure planning and simulation.
  • For financial transactions, dynamic pricing strategies and the harmonization of digital payment standards, including cross-border integration, are being implemented to manage demand effectively.

What challenges does the APAC Intelligent Transportation Systems Industry face during its growth?

  • A key challenge restraining market growth is the high initial capital expenditure coupled with significant ongoing maintenance requirements for advanced systems.

  • The market faces significant challenges in achieving full integration and interoperability. Establishing effective automated traffic management across diverse platforms remains complex, especially with the coexistence of legacy and modern systems. The transition to advanced payment models, such as distance based charging and congestion pricing models, requires widespread public acceptance and robust technology.
  • While electronic toll collection and multi lane free flow systems are becoming more common, they often rely on different standards, creating friction. This is particularly evident in the difficulty of implementing effective peer-to-peer communication for vehicles from different manufacturers.
  • Furthermore, ensuring the accuracy of technologies like high resolution optical character recognition and automated passenger counting sensors, which can have error margins of up to 5%, is crucial for billing and planning.

Exclusive Technavio Analysis on Customer Landscape

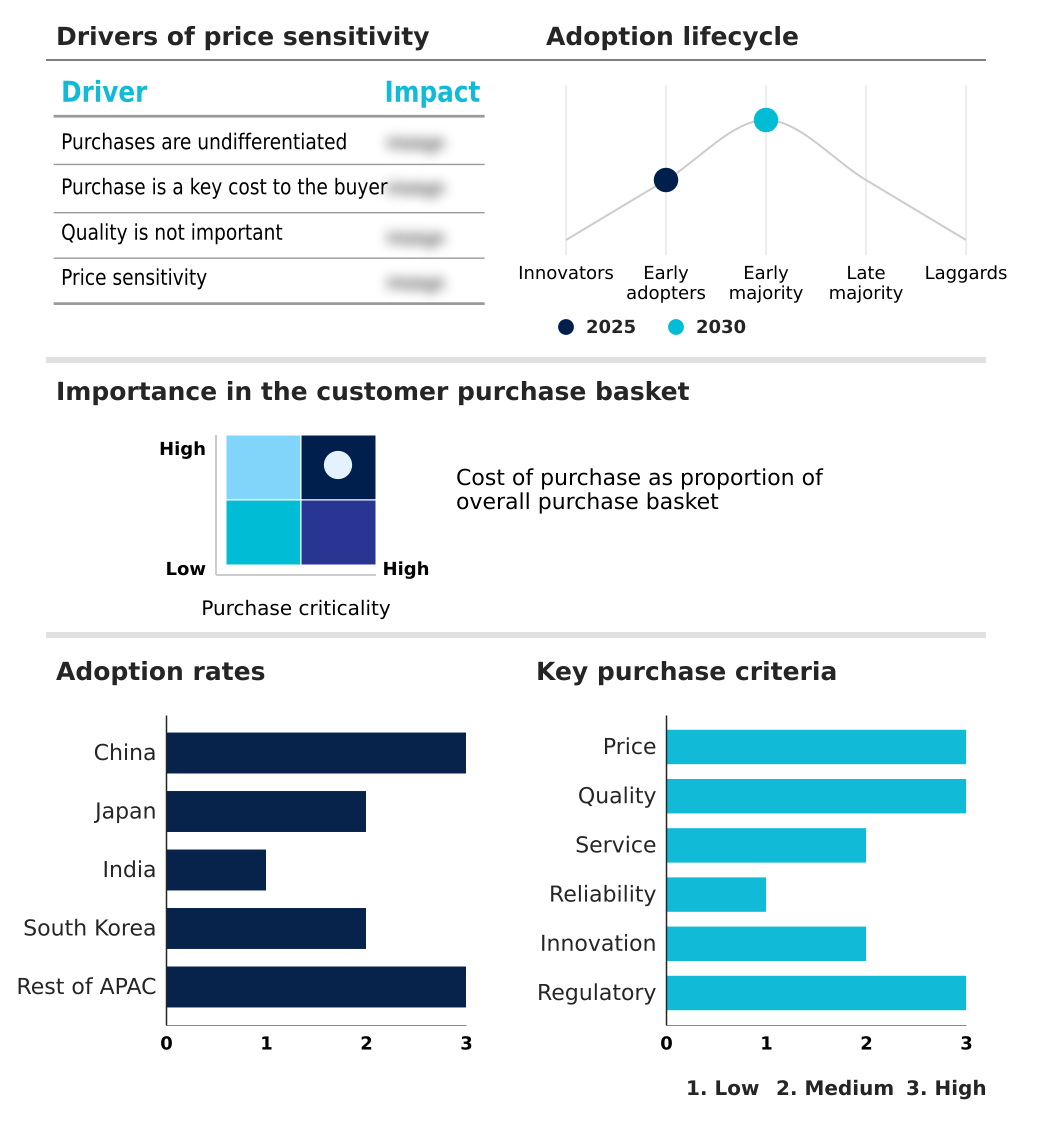
The apac intelligent transportation systems market forecasting report includes the adoption lifecycle of the market, covering from the innovator’s stage to the laggard’s stage. It focuses on adoption rates in different regions based on penetration. Furthermore, the apac intelligent transportation systems market report also includes key purchase criteria and drivers of price sensitivity to help companies evaluate and develop their market growth analysis strategies.

Customer Landscape of APAC Intelligent Transportation Systems Industry

Competitive Landscape

Companies are implementing various strategies, such as strategic alliances, apac intelligent transportation systems market forecast, partnerships, mergers and acquisitions, geographical expansion, and product/service launches, to enhance their presence in the industry.

AECOM - Provides intelligent transportation systems focused on secure digital payment infrastructure, payment processing, and risk management solutions for online and mobile transactions.

The industry research and growth report includes detailed analyses of the competitive landscape of the market and information about key companies, including:

  • AECOM
  • Conduent Inc.
  • Cubic Corp.
  • DENSO Corp.
  • Fujitsu Ltd.
  • Hangzhou Hikvision Digital
  • HERE Global BV
  • Hitachi Ltd.
  • Huawei Technologies Co. Ltd.
  • INRIX Inc.
  • LG Electronics Inc.
  • Mitsubishi Electric Corp.
  • NEC Corp.
  • Panasonic Holdings Corp.
  • Siemens AG
  • SK Telecom Co. Ltd.
  • SWARCO AG
  • Thales Group
  • Toshiba Corp.
  • WSP Global Inc.

Qualitative and quantitative analysis of companies has been conducted to help clients understand the wider business environment as well as the strengths and weaknesses of key industry players. Data is qualitatively analyzed to categorize companies as pure play, category-focused, industry-focused, and diversified; it is quantitatively analyzed to categorize companies as dominant, leading, strong, tentative, and weak.

Recent Development and News in Apac intelligent transportation systems market

  • In May 2025, the Bangkok Metropolitan Administration in Thailand initiated the full scale implementation of an automated area traffic control system across fifty major intersections in the central business district.
  • In August 2025, the Ministry of Housing and Urban Affairs in India announced a new phase of the Smart Cities Mission that focuses specifically on the deployment of standardized digital twin models for urban transit monitoring in thirty additional cities.
  • In November 2025, the local transport authority in Suzhou, China, in partnership with regional telecommunications providers, completed the installation of a 5G enabled green wave system for emergency vehicles.
  • In June 2025, the Land Transport Authority in Singapore successfully expanded the SimplyGo framework to include a cross-border integration feature that allows passengers to use a single digital wallet for both local transit and ferry services to the neighboring Riau Islands.

Dive into Technavio’s robust research methodology, blending expert interviews, extensive data synthesis, and validated models for unparalleled APAC Intelligent Transportation Systems Market insights. See full methodology.

Market Scope
Page number 234
Base year 2025
Historic period 2020-2024
Forecast period 2026-2030
Growth momentum & CAGR Accelerate at a CAGR of 8.1%
Market growth 2026-2030 USD 5273.3 million
Market structure Fragmented
YoY growth 2025-2026(%) 7.5%
Key countries China, Japan, India, South Korea and Rest of APAC
Competitive landscape Leading Companies, Market Positioning of Companies, Competitive Strategies, and Industry Risks

Request Free Sample

Research Analyst Overview

  • The intelligent transportation systems market in APAC is advancing through a confluence of sophisticated hardware and software. Systems for real-time traffic optimization and automated traffic management are foundational. The integration of vehicle to everything connectivity, enabled by 5G enabled green wave system technology and vehicle-to-infrastructure communication, is critical for creating a cooperative intelligent transport system.
  • Deployment involves key components such as light detection and ranging sensors, millimeter-wave radar system technology, and ultrasonic and geomagnetic sensors. Payment and access are streamlined via electronic toll collection, account-based ticketing, and contactless payment technologies, often deployed in multi lane free flow systems. For long-distance and varied terrains, satellite based tolling and localized satellite positioning system technologies are employed.
  • Urban transit is enhanced by automated vehicle location systems and passenger counting technologies. For logistics, automated freight platooning is a key innovation. Safety and user experience are driven by advanced driver assistance systems and biometric driver identification, with over-the-air software updates ensuring continuous improvement and operational efficiency gains of up to 15% in system responsiveness.

What are the Key Data Covered in this APAC Intelligent Transportation Systems Market Research and Growth Report?

  • What is the expected growth of the APAC Intelligent Transportation Systems Market between 2026 and 2030?

    • USD 5.27 billion, at a CAGR of 8.1%

  • What segmentation does the market report cover?

    • The report is segmented by Component (Hardware, Software, and Services), Application (Traffic management, Toll management, Automotive and infotainment telematics, Public transport, and Others), Type (ATM system, APT system, ATP system, ATI system, and Others) and Geography (APAC)

  • Which regions are analyzed in the report?

    • APAC

  • What are the key growth drivers and market challenges?

    • Rapid urbanization and necessity for traffic congestion mitigation, High initial capital expenditure and ongoing maintenance requirements

  • Who are the major players in the APAC Intelligent Transportation Systems Market?

    • AECOM, Conduent Inc., Cubic Corp., DENSO Corp., Fujitsu Ltd., Hangzhou Hikvision Digital, HERE Global BV, Hitachi Ltd., Huawei Technologies Co. Ltd., INRIX Inc., LG Electronics Inc., Mitsubishi Electric Corp., NEC Corp., Panasonic Holdings Corp., Siemens AG, SK Telecom Co. Ltd., SWARCO AG, Thales Group, Toshiba Corp. and WSP Global Inc.

Market Research Insights

  • The market's dynamics are shaped by a push toward integrated mobility, where unified payment ecosystems and the harmonization of digital payment standards are critical. Adopting mobility-as-a-service platforms has shown to increase public transit ridership by up to 15% in pilot cities. Technologies facilitating this shift, including cross-border integration and decentralized processing, are gaining traction.
  • The focus on efficiency drives the adoption of real time data collection and automated signal control, which can reduce urban commute times by over 20%. Furthermore, advanced systems incorporating predictive maintenance capability reduce vehicle fleet downtime by more than a third compared to traditional maintenance schedules. This strategic shift is essential for achieving sustainable traffic congestion mitigation.

We can help! Our analysts can customize this apac intelligent transportation systems market research report to meet your requirements.

Get in touch

1. Executive Summary

1.1 Market overview

Executive Summary - Chart on Market Overview
Executive Summary - Data Table on Market Overview
Executive Summary - Chart on Country Market Characteristics
Executive Summary - Chart on Market by Geography
Executive Summary - Chart on Market Segmentation by Component
Executive Summary - Chart on Market Segmentation by Application
Executive Summary - Chart on Market Segmentation by Type
Executive Summary - Chart on Incremental Growth
Executive Summary - Data Table on Incremental Growth
Executive Summary - Chart on Company Market Positioning

2. Technavio Analysis

2.1 Analysis of price sensitivity, lifecycle, customer purchase basket, adoption rates, and purchase criteria

2.2 Criticality of inputs and Factors of differentiation

Overview on criticality of inputs and factors of differentiation

2.3 Factors of disruption

Overview on factors of disruption

2.4 Impact of drivers and challenges

Impact of drivers and challenges in 2025 and 2030

3. Market Landscape

3.1 Market ecosystem

Chart on Parent Market
Data Table on - Parent Market

3.2 Market characteristics

Chart on Market characteristics analysis

3.3 Value chain analysis

Chart on Value chain analysis

4. Market Sizing

4.1 Market definition

Data Table on Offerings of companies included in the market definition

4.2 Market segment analysis

Market segments

4.3 Market size 2025

4.4 Market outlook: Forecast for 2025-2030

Chart on APAC - Market size and forecast 2025-2030 ($ million)
Data Table on Regional - Market size and forecast 2025-2030 ($ million)
Chart on APAC: Year-over-year growth 2025-2030 (%)
Data Table on Regional - Market size and forecast 2025-2030 ($ million)

5. Historic Market Size

5.1 Intelligent Transportation Systems Market in APAC 2020 - 2024

Historic Market Size - Data Table on Intelligent Transportation Systems Market in APAC 2020 - 2024 ($ million)

5.2 Component segment analysis 2020 - 2024

Historic Market Size - Component Segment 2020 - 2024 ($ million)

5.3 Application segment analysis 2020 - 2024

Historic Market Size - Application Segment 2020 - 2024 ($ million)

5.4 Type segment analysis 2020 - 2024

Historic Market Size - Type Segment 2020 - 2024 ($ million)

5.5 Geography segment analysis 2020 - 2024

Historic Market Size - Geography Segment 2020 - 2024 ($ million)

6. Qualitative Analysis

6.1 The AI impact on Intelligent Transportation Systems Market in APAC

6.2 Impact of geopolitical conflicts on Intelligent Transportation Systems Market in APAC

7. Five Forces Analysis

7.1 Five forces summary

Five forces analysis - Comparison between 2025 and 2030

7.2 Bargaining power of buyers

Bargaining power of buyers - Impact of key factors 2025 and 2030

7.3 Bargaining power of suppliers

Bargaining power of suppliers - Impact of key factors in 2025 and 2030

7.4 Threat of new entrants

Threat of new entrants - Impact of key factors in 2025 and 2030

7.5 Threat of substitutes

Threat of substitutes - Impact of key factors in 2025 and 2030

7.6 Threat of rivalry

Threat of rivalry - Impact of key factors in 2025 and 2030

7.7 Market condition

Chart on Market condition - Five forces 2025 and 2030

8. Market Segmentation by Component

8.1 Market segments

Chart on Component - Market share 2025-2030 (%)
Data Table on Component - Market share 2025-2030 (%)

8.2 Comparison by Component

Chart on Comparison by Component
Data Table on Comparison by Component

8.3 Hardware - Market size and forecast 2025-2030

Chart on Hardware - Market size and forecast 2025-2030 ($ million)
Data Table on Hardware - Market size and forecast 2025-2030 ($ million)
Chart on Hardware - Year-over-year growth 2025-2030 (%)
Data Table on Hardware - Year-over-year growth 2025-2030 (%)

8.4 Software - Market size and forecast 2025-2030

Chart on Software - Market size and forecast 2025-2030 ($ million)
Data Table on Software - Market size and forecast 2025-2030 ($ million)
Chart on Software - Year-over-year growth 2025-2030 (%)
Data Table on Software - Year-over-year growth 2025-2030 (%)

8.5 Services - Market size and forecast 2025-2030

Chart on Services - Market size and forecast 2025-2030 ($ million)
Data Table on Services - Market size and forecast 2025-2030 ($ million)
Chart on Services - Year-over-year growth 2025-2030 (%)
Data Table on Services - Year-over-year growth 2025-2030 (%)

8.6 Market opportunity by Component

Market opportunity by Component ($ million)
Data Table on Market opportunity by Component ($ million)

9. Market Segmentation by Application

9.1 Market segments

Chart on Application - Market share 2025-2030 (%)
Data Table on Application - Market share 2025-2030 (%)

9.2 Comparison by Application

Chart on Comparison by Application
Data Table on Comparison by Application

9.3 Traffic management - Market size and forecast 2025-2030

Chart on Traffic management - Market size and forecast 2025-2030 ($ million)
Data Table on Traffic management - Market size and forecast 2025-2030 ($ million)
Chart on Traffic management - Year-over-year growth 2025-2030 (%)
Data Table on Traffic management - Year-over-year growth 2025-2030 (%)

9.4 Toll management - Market size and forecast 2025-2030

Chart on Toll management - Market size and forecast 2025-2030 ($ million)
Data Table on Toll management - Market size and forecast 2025-2030 ($ million)
Chart on Toll management - Year-over-year growth 2025-2030 (%)
Data Table on Toll management - Year-over-year growth 2025-2030 (%)

9.5 Automotive and infotainment telematics - Market size and forecast 2025-2030

Chart on Automotive and infotainment telematics - Market size and forecast 2025-2030 ($ million)
Data Table on Automotive and infotainment telematics - Market size and forecast 2025-2030 ($ million)
Chart on Automotive and infotainment telematics - Year-over-year growth 2025-2030 (%)
Data Table on Automotive and infotainment telematics - Year-over-year growth 2025-2030 (%)

9.6 Public transport - Market size and forecast 2025-2030

Chart on Public transport - Market size and forecast 2025-2030 ($ million)
Data Table on Public transport - Market size and forecast 2025-2030 ($ million)
Chart on Public transport - Year-over-year growth 2025-2030 (%)
Data Table on Public transport - Year-over-year growth 2025-2030 (%)

9.7 Others - Market size and forecast 2025-2030

Chart on Others - Market size and forecast 2025-2030 ($ million)
Data Table on Others - Market size and forecast 2025-2030 ($ million)
Chart on Others - Year-over-year growth 2025-2030 (%)
Data Table on Others - Year-over-year growth 2025-2030 (%)

9.8 Market opportunity by Application

Market opportunity by Application ($ million)
Data Table on Market opportunity by Application ($ million)

10. Market Segmentation by Type

10.1 Market segments

Chart on Type - Market share 2025-2030 (%)
Data Table on Type - Market share 2025-2030 (%)

10.2 Comparison by Type

Chart on Comparison by Type
Data Table on Comparison by Type

10.3 ATM system - Market size and forecast 2025-2030

Chart on ATM system - Market size and forecast 2025-2030 ($ million)
Data Table on ATM system - Market size and forecast 2025-2030 ($ million)
Chart on ATM system - Year-over-year growth 2025-2030 (%)
Data Table on ATM system - Year-over-year growth 2025-2030 (%)

10.4 APT system - Market size and forecast 2025-2030

Chart on APT system - Market size and forecast 2025-2030 ($ million)
Data Table on APT system - Market size and forecast 2025-2030 ($ million)
Chart on APT system - Year-over-year growth 2025-2030 (%)
Data Table on APT system - Year-over-year growth 2025-2030 (%)

10.5 ATP system - Market size and forecast 2025-2030

Chart on ATP system - Market size and forecast 2025-2030 ($ million)
Data Table on ATP system - Market size and forecast 2025-2030 ($ million)
Chart on ATP system - Year-over-year growth 2025-2030 (%)
Data Table on ATP system - Year-over-year growth 2025-2030 (%)

10.6 ATI system - Market size and forecast 2025-2030

Chart on ATI system - Market size and forecast 2025-2030 ($ million)
Data Table on ATI system - Market size and forecast 2025-2030 ($ million)
Chart on ATI system - Year-over-year growth 2025-2030 (%)
Data Table on ATI system - Year-over-year growth 2025-2030 (%)

10.7 Others - Market size and forecast 2025-2030

Chart on Others - Market size and forecast 2025-2030 ($ million)
Data Table on Others - Market size and forecast 2025-2030 ($ million)
Chart on Others - Year-over-year growth 2025-2030 (%)
Data Table on Others - Year-over-year growth 2025-2030 (%)

10.8 Market opportunity by Type

Market opportunity by Type ($ million)
Data Table on Market opportunity by Type ($ million)

11. Customer Landscape

11.1 Customer landscape overview

Analysis of price sensitivity, lifecycle, customer purchase basket, adoption rates, and purchase criteria

12. Geographic Landscape

12.1 Geographic segmentation

Chart on Market share by geography - 2025-2030 (%)
Data Table on Market share by geography - 2025-2030 (%)

12.2 Geographic comparison

Chart on Geographic comparison
Data Table on Geographic comparison

12.3 China - Market size and forecast 2025-2030

Chart on China - Market size and forecast 2025-2030 ($ million)
Data Table on China - Market size and forecast 2025-2030 ($ million)
Chart on China - Year-over-year growth 2025-2030 (%)
Data Table on China - Year-over-year growth 2025-2030 (%)

12.4 Japan - Market size and forecast 2025-2030

Chart on Japan - Market size and forecast 2025-2030 ($ million)
Data Table on Japan - Market size and forecast 2025-2030 ($ million)
Chart on Japan - Year-over-year growth 2025-2030 (%)
Data Table on Japan - Year-over-year growth 2025-2030 (%)

12.5 India - Market size and forecast 2025-2030

Chart on India - Market size and forecast 2025-2030 ($ million)
Data Table on India - Market size and forecast 2025-2030 ($ million)
Chart on India - Year-over-year growth 2025-2030 (%)
Data Table on India - Year-over-year growth 2025-2030 (%)

12.6 South Korea - Market size and forecast 2025-2030

Chart on South Korea - Market size and forecast 2025-2030 ($ million)
Data Table on South Korea - Market size and forecast 2025-2030 ($ million)
Chart on South Korea - Year-over-year growth 2025-2030 (%)
Data Table on South Korea - Year-over-year growth 2025-2030 (%)

12.7 Rest of APAC - Market size and forecast 2025-2030

Chart on Rest of APAC - Market size and forecast 2025-2030 ($ million)
Data Table on Rest of APAC - Market size and forecast 2025-2030 ($ million)
Chart on Rest of APAC - Year-over-year growth 2025-2030 (%)
Data Table on Rest of APAC - Year-over-year growth 2025-2030 (%)

12.8 Market opportunity by geography

Market opportunity by geography ($ million)
Data Table on Market opportunity by geography ($ million)

13. Drivers, Challenges, and Opportunity

13.1 Market drivers

Rapid urbanization and necessity for traffic congestion mitigation
Strategic expansion of smart city frameworks and government support
Advancements in vehicle to everything connectivity and 5G integration

13.2 Market challenges

High initial capital expenditure and ongoing maintenance requirements
Interoperability hurdles and lack of unified technical standards
Data privacy concerns and cybersecurity vulnerabilities

13.3 Impact of drivers and challenges

Impact of drivers and challenges in 2025 and 2030

13.4 Market opportunities

Integration of AI and edge computing for real-time traffic optimization
Evolution of mobility-as-a-service and unified payment ecosystems
Intelligent infrastructure for management of electric vehicle ecosystems

14. Competitive Landscape

14.1 Overview

14.2

Overview on criticality of inputs and factors of differentiation

14.3 Landscape disruption

Overview on factors of disruption

14.4 Industry risks

Impact of key risks on business

15. Competitive Analysis

15.1 Companies profiled

Companies covered

15.2 Company ranking index

15.3 Market positioning of companies

Matrix on companies position and classification

15.4 AECOM

AECOM - Overview
AECOM - Business segments
AECOM - Key news
AECOM - Key offerings
AECOM - Segment focus
SWOT

15.5 Conduent Inc.

Conduent Inc. - Overview
Conduent Inc. - Business segments
Conduent Inc. - Key offerings
Conduent Inc. - Segment focus
SWOT

15.6 Cubic Corp.

Cubic Corp. - Overview
Cubic Corp. - Product / Service
Cubic Corp. - Key offerings
SWOT

15.7 DENSO Corp.

DENSO Corp. - Overview
DENSO Corp. - Business segments
DENSO Corp. - Key news
DENSO Corp. - Key offerings
DENSO Corp. - Segment focus
SWOT

15.8 Fujitsu Ltd.

Fujitsu Ltd. - Overview
Fujitsu Ltd. - Business segments
Fujitsu Ltd. - Key offerings
Fujitsu Ltd. - Segment focus
SWOT

15.9 Hangzhou Hikvision Digital

Hangzhou Hikvision Digital - Overview
Hangzhou Hikvision Digital - Business segments
Hangzhou Hikvision Digital - Key news
Hangzhou Hikvision Digital - Key offerings
Hangzhou Hikvision Digital - Segment focus
SWOT

15.10 HERE Global BV

HERE Global BV - Overview
HERE Global BV - Product / Service
HERE Global BV - Key offerings
SWOT

15.11 Hitachi Ltd.

Hitachi Ltd. - Overview
Hitachi Ltd. - Business segments
Hitachi Ltd. - Key offerings
Hitachi Ltd. - Segment focus
SWOT

15.12 Huawei Technologies Co. Ltd.

Huawei Technologies Co. Ltd. - Overview
Huawei Technologies Co. Ltd. - Business segments
Huawei Technologies Co. Ltd. - Key news
Huawei Technologies Co. Ltd. - Key offerings
Huawei Technologies Co. Ltd. - Segment focus
SWOT

15.13 INRIX Inc.

INRIX Inc. - Overview
INRIX Inc. - Product / Service
INRIX Inc. - Key offerings
SWOT

15.14 LG Electronics Inc.

LG Electronics Inc. - Overview
LG Electronics Inc. - Business segments
LG Electronics Inc. - Key offerings
LG Electronics Inc. - Segment focus
SWOT

15.15 Mitsubishi Electric Corp.

Mitsubishi Electric Corp. - Overview
Mitsubishi Electric Corp. - Business segments
Mitsubishi Electric Corp. - Key offerings
Mitsubishi Electric Corp. - Segment focus
SWOT

15.16 NEC Corp.

NEC Corp. - Overview
NEC Corp. - Business segments
NEC Corp. - Key offerings
NEC Corp. - Segment focus
SWOT

15.17 Panasonic Holdings Corp.

Panasonic Holdings Corp. - Overview
Panasonic Holdings Corp. - Business segments
Panasonic Holdings Corp. - Key news
Panasonic Holdings Corp. - Key offerings
Panasonic Holdings Corp. - Segment focus
SWOT

15.18 Siemens AG

Siemens AG - Overview
Siemens AG - Business segments
Siemens AG - Key news
Siemens AG - Key offerings
Siemens AG - Segment focus
SWOT

16. Appendix

16.1 Scope of the report

Market definition
Objectives
Notes and caveats

16.2 Inclusions and exclusions checklist

Inclusions checklist
Exclusions checklist

16.3 Currency conversion rates for US$

16.4 Research methodology

16.5 Data procurement

Information sources

16.6 Data validation

16.7 Validation techniques employed for market sizing

16.8 Data synthesis

16.9 360 degree market analysis

16.10 List of abbreviations

Research Methodology

Technavio presents a detailed picture of the market by way of study, synthesis, and summation of data from multiple sources. The analysts have presented the various facets of the market with a particular focus on identifying the key industry influencers. The data thus presented is comprehensive, reliable, and the result of extensive research, both primary and secondary.

INFORMATION SOURCES

Primary sources

  • Manufacturers and suppliers
  • Channel partners
  • Industry experts
  • Strategic decision makers

Secondary sources

  • Industry journals and periodicals
  • Government data
  • Financial reports of key industry players
  • Historical data
  • Press releases

DATA ANALYSIS

Data Synthesis

  • Collation of data
  • Estimation of key figures
  • Analysis of derived insights

Data Validation

  • Triangulation with data models
  • Reference against proprietary databases
  • Corroboration with industry experts

REPORT WRITING

Qualitative

  • Market drivers
  • Market challenges
  • Market trends
  • Five forces analysis

Quantitative

  • Market size and forecast
  • Market segmentation
  • Geographical insights
  • Competitive landscape

Interested in this report?

Get your sample now to see our research methodology and insights!

Download Now

Frequently Asked Questions

APAC Intelligent Transportation Systems market growth will increase by USD 5273.3 million during 2026-2030.

The APAC Intelligent Transportation Systems market is expected to grow at a CAGR of 8.1% during 2026-2030.

APAC Intelligent Transportation Systems market is segmented by Component (Hardware, Software, Services) Application (Traffic management, Toll management, Automotive and infotainment telematics, Public transport, Others) Type (ATM system, APT system, ATP system, ATI system, Others)

AECOM, Conduent Inc., Cubic Corp., DENSO Corp., Fujitsu Ltd., Hangzhou Hikvision Digital, HERE Global BV, Hitachi Ltd., Huawei Technologies Co. Ltd., INRIX Inc., LG Electronics Inc., Mitsubishi Electric Corp., NEC Corp., Panasonic Holdings Corp., Siemens AG, SK Telecom Co. Ltd., SWARCO AG, Thales Group, Toshiba Corp., WSP Global Inc. are a few of the key vendors in the APAC Intelligent Transportation Systems market.

APAC will register the highest growth rate of 100% among the other regions. Therefore, the APAC Intelligent Transportation Systems market in APAC is expected to garner significant business opportunities for the vendors during the forecast period.

China, Japan, India, South Korea, Rest of APAC

  • Rapid urbanization and necessity for traffic congestion mitigation is the driving factor this market.

The APAC Intelligent Transportation Systems market vendors should focus on grabbing business opportunities from the Component segment as it accounted for the largest market share in the base year.
RIA - Research AI Assistant
Ask RIA