Applied AI In Retail And E-Commerce Market Size 2025-2029
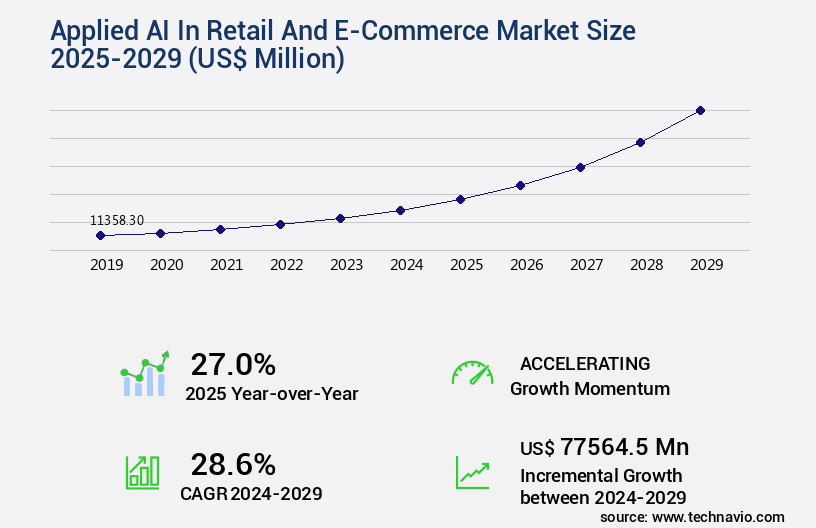
The applied AI in retail and e-commerce market size is valued to increase by USD 77.56 billion, at a CAGR of 28.6% from 2024 to 2029. Surging demand for hyper-personalization and enhanced customer experience will drive the applied ai in retail and e-commerce market.
Major Market Trends & Insights
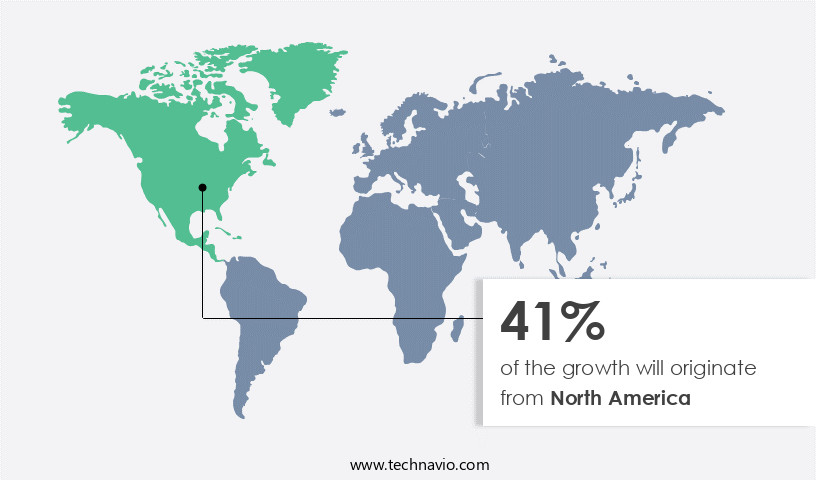
- North America dominated the market and accounted for a 41% growth during the forecast period.
- By Component - Solutions segment was valued at USD 7.62 billion in 2023
- By Deployment - Cloud segment accounted for the largest market revenue share in 2023
Market Size & Forecast
- Market Opportunities: USD 853.61 million
- Market Future Opportunities: USD 77564.50 million
- CAGR from 2024 to 2029 : 28.6%
Market Summary
- In the dynamic realm of retail and e-commerce, Applied Artificial Intelligence (AI) has emerged as a game-changer, driving innovation and transformation. The market's growth is underscored by the increasing demand for hyper-personalized experiences and enhanced customer engagement. In-store analytics AI, supply chain AI, and smart shelf technology optimize operations, while conversational AI and augmented reality shopping create immersive customer experiences. According to recent studies, the global retail AI market is expected to reach a value of USD7.35 billion by 2025, reflecting a significant surge in adoption. AI's role extends beyond automation and optimization. It now powers generative technologies, enabling the creation of personalized content and recommendations. This evolution is crucial in an era where consumers expect tailored experiences, driving businesses to adapt or risk losing market share.
- However, the integration of AI in retail and e-commerce isn't without challenges. Data privacy and security concerns loom large, with ethical considerations adding complexity. Balancing the benefits of AI with the need for transparency and user control is essential. Despite these challenges, the future of retail and e-commerce remains bright, with AI poised to redefine the industry landscape.
What will be the Size of the Applied AI In Retail And E-Commerce Market during the forecast period?
Get Key Insights on Market Forecast (PDF) Request Free Sample
How is the Applied AI In Retail And E-Commerce Market Segmented ?
The applied AI in retail and e-commerce industry research report provides comprehensive data (region-wise segment analysis), with forecasts and estimates in "USD million" for the period 2025-2029, as well as historical data from 2019-2023 for the following segments.
- Component
- Solutions
- Services
- Deployment
- Cloud
- On premises
- End-user
- Fashion and apparel
- Electronics and appliances
- Grocery and FMCG
- Beauty and personal care
- Others
- Geography
- North America
- US
- Canada
- Europe
- France
- Germany
- UK
- APAC
- Australia
- China
- India
- Japan
- South America
- Brazil
- Rest of World (ROW)
- North America
By Component Insights
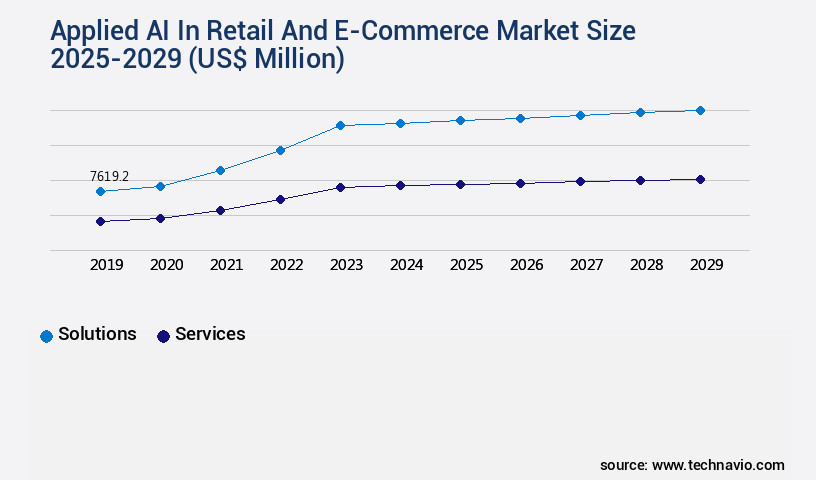
The solutions segment is estimated to witness significant growth during the forecast period.
The market continues to evolve, with businesses increasingly adopting advanced technologies to automate processes, generate insights, and enhance customer experiences. A key area of innovation is the integration of generative AI into enterprise platforms, as demonstrated by Google Cloud's January 2024 launch of conversational commerce tools, customer service modernization solutions, and automated catalog enrichment. These technologies enable retailers to build nuanced chatbots, modernize operations, and transform in-store technology deployments. For instance, dynamic pricing models utilize predictive analytics retail and machine learning personalization to offer personalized offers AI and optimize inventory in real-time. Image recognition retail and visual search technology provide a personalized shopping experience, while chatbot customer service and sentiment analysis e-commerce improve customer engagement.
Moreover, AI-driven marketing automation, demand prediction algorithms, and fraud detection AI help retailers anticipate trends and mitigate risks. These advancements represent a significant shift in the retail landscape, with AI-powered solutions becoming essential tools for businesses to stay competitive. According to a recent report, the global retail AI market is projected to reach USD25.2 billion by 2027, underscoring the market's growing importance.
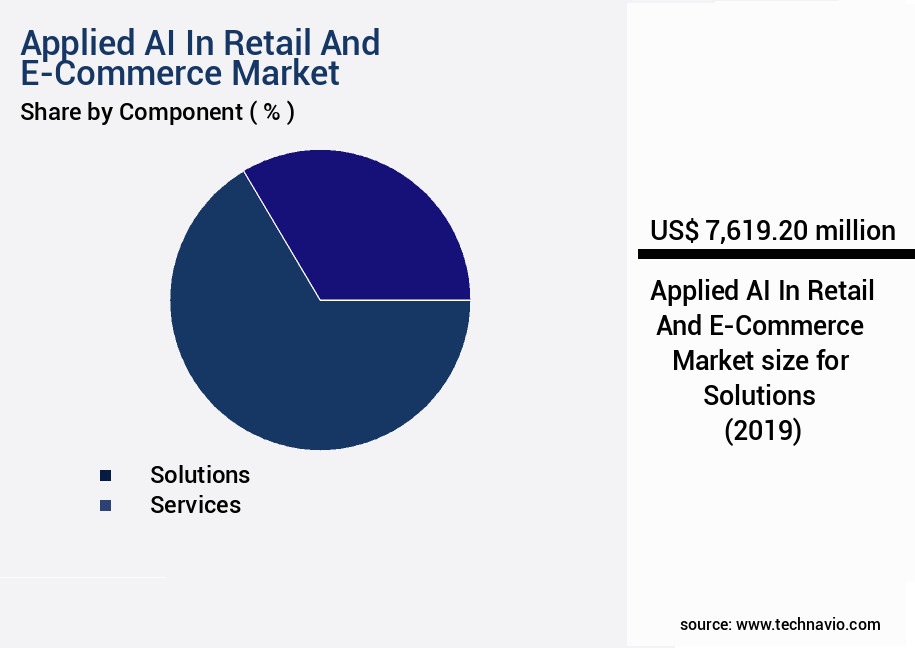
The Solutions segment was valued at USD 7.62 billion in 2019 and showed a gradual increase during the forecast period.
Regional Analysis
North America is estimated to contribute 41% to the growth of the global market during the forecast period.Technavio's analysts have elaborately explained the regional trends and drivers that shape the market during the forecast period.
See How Applied AI In Retail And E-Commerce Market Demand is Rising in North America Request Free Sample
The market is witnessing significant growth, with North America leading the charge. This region, home to tech giants like Google, Microsoft, Amazon, NVIDIA, Salesforce, and Oracle, boasts a highly competitive retail landscape and sophisticated consumer expectations. The primary market driver is the unyielding quest for a seamless, hyper-personalized, and frictionless customer experience across all channels. Retailers are increasingly adopting advanced AI solutions to gain a competitive edge. One notable application is Generative AI, which has seen rapid adoption due to its ability to create personalized product recommendations and optimize pricing strategies.
Market Dynamics
Our researchers analyzed the data with 2024 as the base year, along with the key drivers, trends, and challenges. A holistic analysis of drivers will help companies refine their marketing strategies to gain a competitive advantage.
In the dynamic world of retail and e-commerce, Applied Artificial Intelligence (AI) is revolutionizing business operations and customer engagement. AI-driven personalized product recommendations use machine learning models to analyze customer behavior and preferences, enhancing the shopping experience and increasing sales. Computer vision technology is employed in-store to understand customer behavior, enabling retailers to optimize store layouts and product placement. Natural Language Processing (NLP) is utilized for chatbot development, providing instant customer support and improving customer satisfaction. Predictive analytics and machine learning models are used for sales forecasting, ensuring inventory levels meet demand and reducing stockouts. AI-powered dynamic pricing strategies adjust prices in real-time based on market trends and customer behavior, maximizing revenue.
Real-time data analytics for retail operations provide valuable insights into customer behavior, enabling proactive decision-making. Implementation of AI for supply chain optimization uses predictive analytics and machine learning algorithms to streamline logistics and reduce costs. Customer segmentation using machine learning algorithms identifies key customer groups, enabling targeted marketing campaigns. AI-driven fraud detection systems in e-commerce use machine learning models to detect and prevent fraudulent transactions, safeguarding revenue and customer trust. AI is also used for loss prevention in retail stores, reducing shrinkage and improving operational efficiency. The application of AI for omnichannel customer experience ensures seamless interaction across all touchpoints, enhancing customer engagement and loyalty. AI-powered solutions for enhancing customer service provide personalized support, improving customer retention. Deployment of AI for targeted advertising campaigns uses predictive analytics to identify potential customers, increasing campaign effectiveness. AI algorithms for website traffic optimization improve user experience and drive conversions. Effective email marketing automation using AI-based promotional campaign effectiveness measurement ensures timely and relevant communications. Building AI-powered loyalty programs for customer retention uses machine learning algorithms to identify and reward loyal customers, increasing repeat business. Sales uplift modeling and prediction using AI ensure accurate forecasting and effective resource allocation.

What are the key market drivers leading to the rise in the adoption of Applied AI In Retail And E-Commerce Industry?
- The surge in demand for hyper-personalization and an enhanced customer experience is the primary factor fueling market growth.
- The retail and e-commerce sector is experiencing a significant transformation driven by the modern consumer's growing preference for personalized experiences. This shift towards individualized interactions is putting immense pressure on retailers to move beyond one-size-fits-all marketing strategies. Applied AI is the key technology facilitating this transition from mass marketing to mass personalization at scale. By analyzing extensive datasets encompassing a customer's past purchase history, browsing behavior, demographic information, and real-time contextual cues like location and time of day, AI algorithms create tailored shopping journeys. According to recent studies, AI in retail and e-commerce is projected to reach a market value of over USD30 billion by 2026, representing a substantial growth in the sector.
- Another report suggests that AI-driven personalized product recommendations alone could increase sales by up to 15%, highlighting the significant potential of this technology.
What are the market trends shaping the Applied AI In Retail And E-Commerce Industry?
- The proliferation of generative AI is becoming a significant market trend, with applications in hyper-personalization and content creation.
- The retail sector's evolution is marked by the increasing adoption of generative AI, surpassing the predictive capabilities of traditional machine learning. This advanced technology is revolutionizing communication between retailers and customers. Conversational AI is a prominent application, with retailers implementing sophisticated virtual assistants and chatbots to enhance online shopping experiences. They guide customers through their journey, answer intricate product queries, and offer personalized recommendations.
- Generative AI's impact extends to internal content workflows, fostering a level of hyper-personalization previously unattainable. This technology's integration is transforming the retail landscape, making it more engaging and efficient.
What challenges does the Applied AI In Retail And E-Commerce Industry face during its growth?
- Data privacy and security, along with ethical concerns, pose significant challenges to the growth of industries, necessitating rigorous adherence to regulations and best practices to protect sensitive information and maintain public trust.
- The market faces a significant challenge in navigating the intricate data privacy landscape. AI systems, particularly those employed for personalization, demand extensive access to sensitive consumer data, including purchase histories and behavioral patterns. This data dependency exposes retailers to the rigorous regulatory scrutiny of an evolving global framework. For instance, the European Union's AI Act, approved by the European Parliament in March 2024, sets stringent data protection regulations with substantial penalties for non-compliance. Retailers must balance the benefits of AI applications with the increasing importance of data privacy and ethical considerations.
Exclusive Technavio Analysis on Customer Landscape
The applied ai in retail and e-commerce market forecasting report includes the adoption lifecycle of the market, covering from the innovator's stage to the laggard's stage. It focuses on adoption rates in different regions based on penetration. Furthermore, the applied ai in retail and e-commerce market report also includes key purchase criteria and drivers of price sensitivity to help companies evaluate and develop their market growth analysis strategies.

Customer Landscape of Applied AI In Retail And E-Commerce Industry
Competitive Landscape
Companies are implementing various strategies, such as strategic alliances, applied ai in retail and e-commerce market forecast, partnerships, mergers and acquisitions, geographical expansion, and product/service launches, to enhance their presence in the industry.
Advanced Micro Devices Inc. - This company specializes in artificial intelligence (AI) applications for retail and e-commerce industries. Their innovative solutions include Versal AI Edge, enabling real-time analytics for personalized in-store and online experiences. By leveraging AI, they enhance customer engagement and optimize business operations.
The industry research and growth report includes detailed analyses of the competitive landscape of the market and information about key companies, including:
- Advanced Micro Devices Inc.
- Alibaba Cloud
- Amazon.com Inc.
- BloomReach Inc.
- C3.ai Inc.
- Capgemini Service SAS
- Fujitsu Ltd.
- Google LLC
- Infosys Ltd.
- Intel Corp.
- International Business Machines Corp.
- Microsoft Corp.
- NVIDIA Corp.
- Oracle Corp.
- Salesforce Inc.
- SAP SE
- ServiceNow Inc.
- Symphony Innovation LLC
- Talkdesk Inc.
- Tata Consultancy Services Ltd.
Qualitative and quantitative analysis of companies has been conducted to help clients understand the wider business environment as well as the strengths and weaknesses of key industry players. Data is qualitatively analyzed to categorize companies as pure play, category-focused, industry-focused, and diversified; it is quantitatively analyzed to categorize companies as dominant, leading, strong, tentative, and weak.
Recent Development and News in Applied AI In Retail And E-Commerce Market
- In January 2024, Amazon Web Services (AWS) announced the launch of Amazon SageMaker X-Ray, an AI-driven service that automatically explains machine learning model predictions, integrating with retailers' and e-commerce platforms to enhance transparency and improve customer experience (Amazon Web Services Press Release).
- In March 2024, Walmart and Microsoft entered into a strategic partnership to accelerate the retail giant's digital transformation, integrating Microsoft's Azure AI and cloud services into Walmart's operations, enabling more personalized shopping experiences and optimizing supply chain management (Microsoft News Center).
- In May 2024, H&M announced a USD100 million investment in AI and digital technologies, including computer vision and machine learning, to enhance its online shopping experience, personalize recommendations, and optimize inventory management (H&M Press Release).
- In April 2025, Alibaba Group, the Chinese e-commerce giant, acquired a leading AI and computer vision startup, SenseTime, for approximately USD4.5 billion, expanding its AI capabilities to enhance its retail offerings, including facial recognition technology for personalized shopping experiences and supply chain optimization (Reuters).
Dive into Technavio's robust research methodology, blending expert interviews, extensive data synthesis, and validated models for unparalleled Applied AI In Retail And E-Commerce Market insights. See full methodology.
|
Market Scope |
|
|
Report Coverage |
Details |
|
Page number |
243 |
|
Base year |
2024 |
|
Historic period |
2019-2023 |
|
Forecast period |
2025-2029 |
|
Growth momentum & CAGR |
Accelerate at a CAGR of 28.6% |
|
Market growth 2025-2029 |
USD 77564.5 million |
|
Market structure |
Fragmented |
|
YoY growth 2024-2025(%) |
27.0 |
|
Key countries |
US, China, Germany, India, Canada, UK, Japan, France, Australia, and Brazil |
|
Competitive landscape |
Leading Companies, Market Positioning of Companies, Competitive Strategies, and Industry Risks |
Research Analyst Overview
- The retail and e-commerce market continues to evolve, with artificial intelligence (AI) playing an increasingly significant role in shaping consumer experiences and optimizing business operations. Dynamic pricing models, fueled by AI, adapt to real-time market conditions and customer behavior, ensuring competitive pricing and increased sales. For instance, a major retailer reported a 10% sales increase by implementing such a system. Chatbot customer service, powered by conversational AI, offers round-the-clock assistance, improving customer engagement and satisfaction. Image recognition technology and virtual try-on features enable personalized shopping experiences, while predictive analytics retail helps anticipate consumer needs and preferences. Retail process automation, real-time data analytics, and automated customer support streamline operations, reducing costs and enhancing efficiency.
- Loss prevention AI and fraud detection systems safeguard against financial losses, while customer behavior modeling and demand prediction algorithms inform strategic decision-making. AI-driven marketing automation and AI-powered recommendation engines personalize interactions, increasing customer loyalty. In-store analytics AI and supply chain AI optimize inventory management and logistics, ensuring stock availability and reducing waste. Sentiment analysis in e-commerce and customer journey mapping provide valuable insights into consumer preferences and trends. Machine learning personalization and computer vision retail offer tailored shopping experiences, while AI-driven inventory optimization and smart shelf technology maintain optimal stock levels. Augmented reality shopping and visual search technology create immersive, interactive experiences, enhancing the overall shopping journey.
- The retail and e-commerce market is expected to grow by over 15% annually, as businesses continue to leverage AI to deliver personalized, efficient, and engaging customer experiences.
What are the Key Data Covered in this Applied AI In Retail And E-Commerce Market Research and Growth Report?
-
What is the expected growth of the Applied AI In Retail And E-Commerce Market between 2025 and 2029?
-
USD 77.56 billion, at a CAGR of 28.6%
-
-
What segmentation does the market report cover?
-
The report is segmented by Component (Solutions and Services), Deployment (Cloud and On premises), End-user (Fashion and apparel, Electronics and appliances, Grocery and FMCG, Beauty and personal care, and Others), and Geography (North America, APAC, Europe, South America, and Middle East and Africa)
-
-
Which regions are analyzed in the report?
-
North America, APAC, Europe, South America, and Middle East and Africa
-
-
What are the key growth drivers and market challenges?
-
Surging demand for hyper-personalization and enhanced customer experience, Data privacy security and ethical concerns
-
-
Who are the major players in the Applied AI In Retail And E-Commerce Market?
-
Advanced Micro Devices Inc., Alibaba Cloud, Amazon.com Inc., BloomReach Inc., C3.ai Inc., Capgemini Service SAS, Fujitsu Ltd., Google LLC, Infosys Ltd., Intel Corp., International Business Machines Corp., Microsoft Corp., NVIDIA Corp., Oracle Corp., Salesforce Inc., SAP SE, ServiceNow Inc., Symphony Innovation LLC, Talkdesk Inc., and Tata Consultancy Services Ltd.
-
Market Research Insights
- The market for AI applications in retail and e-commerce continues to expand, with two notable trends shaping its growth. First, AI technologies such as upselling AI, customer lifetime value prediction, and product recommendation systems are increasingly being adopted to enhance the shopping experience and drive sales. For instance, a major retailer reported a 10% increase in sales due to the implementation of a product recommendation system. Second, the industry anticipates significant growth, with estimates suggesting a 20% compound annual growth rate in AI spending over the next five years.
- This expansion is fueled by the integration of AI in various retail applications, including stock level prediction, customer churn prediction, and targeted advertising. For example, an IoT-enabled retailer achieved a 15% improvement in retention rates through the use of customer churn prediction AI. These advancements underscore the transformative potential of AI in retail and e-commerce.
We can help! Our analysts can customize this applied ai in retail and e-commerce market research report to meet your requirements.
 RIA -
RIA - 
