Arachidonic Acid Market Analysis North America - Size and Forecast 2024-2028

Arachidonic Acid Market Analysis North America - Size and Forecast 2024-2028

Published: Oct 2023 146 Pages SKU: IRTNTR72655

Market Overview at a Glance

$37.41 Mn
Market Opportunity
8.15%
CAGR
7.72
YoY growth 2023-2024(%)

North America Arachidonic Acid Market Size 2024-2028 

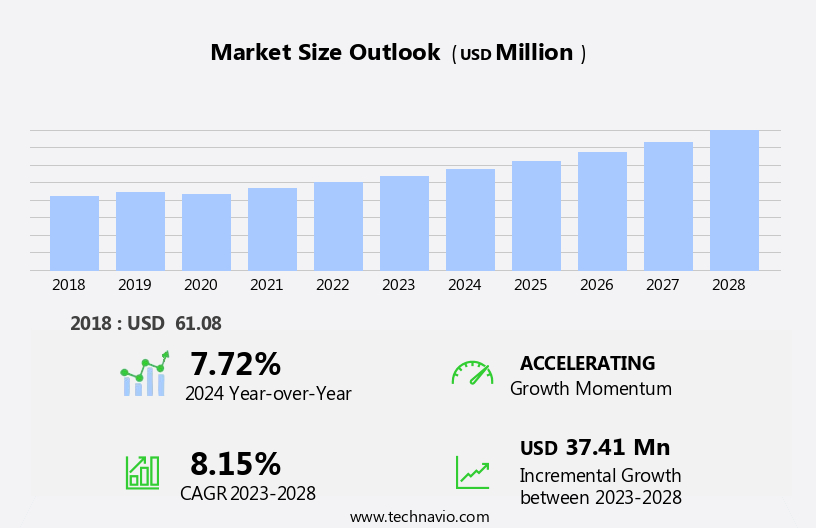
The North America arachidonic acid market size is forecast to increase by USD 37.41 million at a CAGR of 8.15% between 2023 and 2028. The market is witnessing significant growth due to the increasing demand for nutritional supplements, particularly those containing Docosahexaenoic acid (DHA) and other polyunsaturated fatty acids. Arachidonic acid plays a crucial role in brain cell development and muscle function in mammals, making it an essential nutrient for infants and athletes. The availability of various sources, such as fish, poultry meat, and phospholipids, has expanded the market's reach. Moreover, the esterified form of arachidonic acid in glycerol is gaining popularity due to its improved bioavailability. Additionally, the gallbladder membrane and proteins containing arachidonic acid are used in various applications, including pharmaceuticals and cosmetics.

Furthermore, the e-commerce channels' growing popularity and the availability of several alternatives, such as linoleic acid and eicosapentaenoic acid, pose challenges to the market's growth. Nonetheless, the market's potential for innovation and the rising awareness of the health benefits of arachidonic acid are expected to drive its growth in the coming years.

Arachidonic Acid Market in North America Size

 Request Free Sample

Arachidonic acid, an omega-6 fatty acid, plays a crucial role in the production of eicosanoids, which are essential signaling molecules with anti-inflammatory properties. In North America, arachidonic acid is widely used in various applications, including infant nutrition products. It is available in different forms such as solid form, powder form, crystalline form, and liquid form. Arachidonic acid is vital for brain development and visual acuity in infants. It is a key component of phospholipids in cell membranes, including those in brain cells and the gallbladder membrane. The omega-6 group, which includes arachidonic acid, is essential for cell survival and maintenance of cellular functions.

Furthermore, Mortierella alpine, a microorganism, is used for the commercial production of arachidonic acid. Arachidonic acid is found naturally in various food sources such as poultry, meat, fish, and eggs proteins. It is also used as a dietary supplement in the form of phosphate or calcium levels to enhance its bioavailability. Arachidonic acid is also used in the production of docosahexaenoic acid (DHA) for various applications.

Market Segmentation

The market research report provides comprehensive data (region-wise segment analysis), with forecasts and estimates in "USD million" for the period 2024-2028, as well as historical data from 2018-2022 for the following segments.

  • Application
    • Infant formula
    • Others
  • Source
    • Plant source
    • Animal source
  • Geography
    • North America
      • Canada
      • Mexico
      • US

By Application Insights

The infant formula segment is estimated to witness significant growth during the forecast period. Arachidonic acid, a vital fatty acid belonging to the Omega-6 group, holds significant importance in various end-use industries, particularly in North America. This essential fatty acid plays a crucial role in brain development and visual acuity, making it an integral component of numerous nutritional products. It is a key constituent of phospholipids in cell membranes and is essential for neuron growth and cell survival. Mortierella alpine, a unicellular organism, is a primary source for commercial production of arachidonic acid. The solvent segment dominates the production process due to its high efficiency and cost-effectiveness. In the health and nutrition sector, arachidonic acid finds extensive applications in sports supplements and infant food.

Furthermore, in 2023, infant food was the leading application segment, driven by the growing use in infant formula products and the increasing demand for these products. Arachidonic acid is essential for infant growth and development, as it is an integral part of human milk and cannot be produced by the human body. Thus, infant formula manufacturers incorporate arachidonic acid to meet the metabolic requirements of infants. Additionally, calcium levels in the brain are regulated by arachidonic acid, making it a vital nutrient for brain health.

Arachidonic Acid Market in North America Size

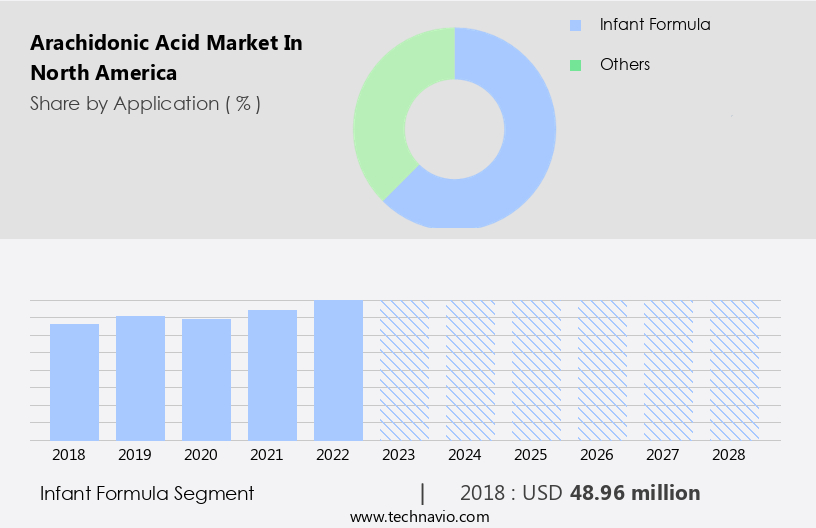
Get a glance at the market share of various segments Request Free Sample

The infant formula segment accounted for USD 48.96 million in 2018 and showed a gradual increase during the forecast period.

Our market researchers analyzed the data with 2023 as the base year, along with the key drivers, trends, and challenges. A holistic analysis of drivers will help companies refine their marketing strategies to gain a competitive advantage.

Market Driver

Rising demand for sports supplements is the key driver of the market. Arachidonic acid, an Omega-6 fatty acid, is a crucial component of eicosanoids, which possess anti-inflammatory properties. The rising awareness regarding health and wellness among individuals aged 20-40 years, particularly those engaged in fitness training, bodybuilding, and sports specialization, is fueling the demand for arachidonic acid in North America.

Furthermore, this essential fatty acid is utilized in the production of infant formula and various infant nutrition products, available in solid form, powder form, crystalline form, liquid form, and oil-based solutions. The sources of arachidonic acid include plant-based sources like algae and fungi, as well as animal-derived products. The increasing preference for plant-based diets and the growing interest in natural health supplements are expected to boost the demand for arachidonic acid derived from plant sources during the forecast period.

Market Trends

E-commerce channels gaining popularity is the upcoming trend in the market. Arachidonic acid, an omega-6 fatty acid, is a crucial component of eicosanoids, which are essential for inflammatory and immune responses. Arachidonic acid is available in various forms, including solid form (powder), crystalline form, liquid form (oil-based solutions), and plant-based sources such as algae and fungi, as well as animal-derived products. In North America, arachidonic acid is extensively used in infant formula and nutrition products due to its anti-inflammatory properties. The market for arachidonic acid in North America is growing due to increasing consumer awareness of its health benefits and the expanding application base in various industries, including food and beverages, pharmaceuticals, and cosmetics.

Furthermore, online platforms have become a popular channel for selling arachidonic acid-containing products due to their convenience and the ability to reach a large consumer base directly. Consumers can purchase arachidonic acid in various forms, including powder, crystalline, oil-based solutions, and liquid form, from reputable companies online. The market is expected to witness steady growth in the coming years, driven by increasing demand for functional foods and beverages and the expanding application base in various industries.

Market Challenge

Availability of several alternatives for arachidonic acid is a key challenge affecting the market growth. Arachidonic acid is a significant Omega-6 polyunsaturated fatty acid with essential roles in various physiological functions, primarily due to its role in the production of eicosanoids, which exhibit anti-inflammatory properties. Arachidonic acid is found in both animal-derived and plant-based sources, including fish, eggs, and meat, as well as in some plant sources like algae and fungi. In the food industry, arachidonic acid is available in various forms, such as solid form, powder form, crystalline form, liquid form, and oil-based solutions, for use in infant formula and other infant nutrition products. However, arachidonic acid faces competition from its substitutes like linoleic acid, alpha-linolenic acid, Y-linolenic acid, leukotriene, and docosapentaenoic acid.

Furthermore, these substitutes, which can be easily sourced from plant-based sources, can replace arachidonic acid in various applications, including food and beverage and pharmaceutical products. Despite this competition, the demand for arachidonic acid remains strong due to its unique properties and applications.

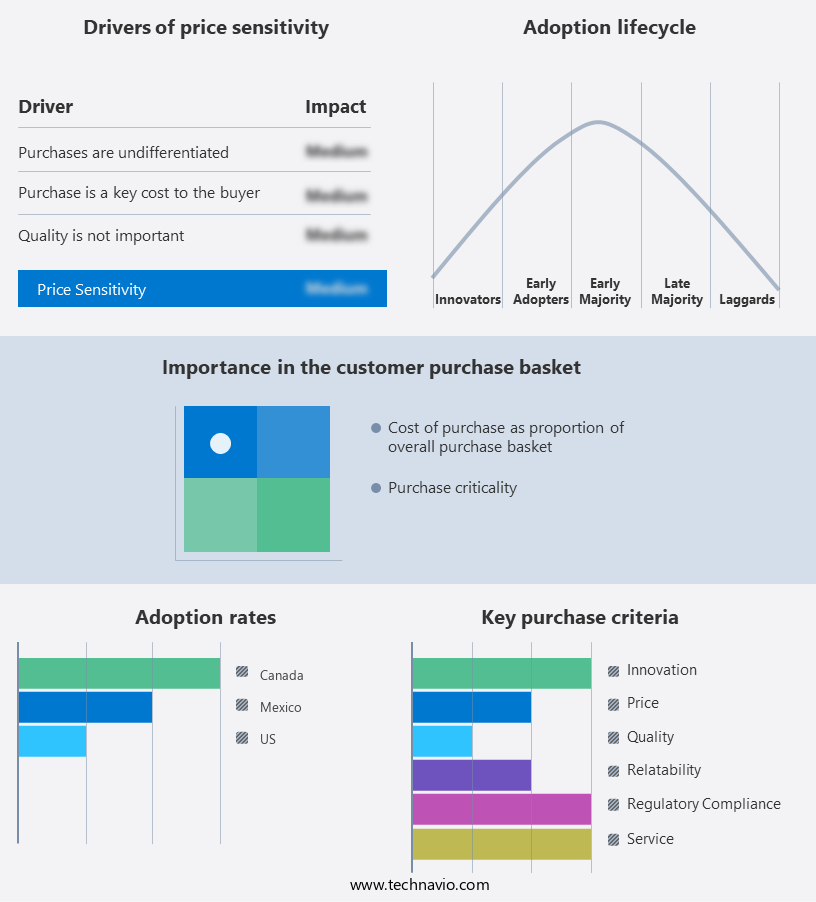
Exclusive Customer Landscape

The market forecasting report includes the adoption lifecycle of the market, covering from the innovator's stage to the laggard's stage. It focuses on adoption rates in different regions based on penetration. Furthermore, the report also includes key purchase criteria and drivers of price sensitivity to help companies evaluate and develop their market growth analysis strategies.

Arachidonic Acid Market in North America Share by Geography

 Customer Landscape

Key Companies & Market Insights

Companies are implementing various strategies, such as strategic alliances, partnerships, mergers and acquisitions, geographical expansion, and product/service launches, to enhance their presence in the market.

Avantor Inc. -  The company offers arachidonic acid with high purity and consistent quality for research purposes.

The market research and growth report includes detailed analyses of the competitive landscape of the market and information about key companies, including:

  • BASF SE
  • Bio Techne Corp.
  • Biosynth Ltd.
  • Cargill Inc.
  • Cayman Chemical
  • Croda International Plc
  • Koninklijke DSM NV
  • LGC Science Group Holdings Ltd.
  • Merck KGaA
  • Parchem Fine and Specialty Chemicals Inc.
  • PerkinElmer Inc.
  • Selleck Chemicals LLC
  • Sisco Research Laboratories Pvt. Ltd.
  • Spectrum Laboratory Products Inc.
  • Thermo Fisher Scientific Inc.
  • Tokyo Chemical Industry Co. Ltd.
  • Wanrun Co. Ltd.
  • Xiamen Jindawei Group Co. Ltd.
  • Zhejiang Tianhecheng Bio technology Shares Co. Ltd.

Qualitative and quantitative analysis of companies has been conducted to help clients understand the wider business environment as well as the strengths and weaknesses of key market players. Data is qualitatively analyzed to categorize companies as pure play, category-focused, industry-focused, and diversified; it is quantitatively analyzed to categorize companies as dominant, leading, strong, tentative, and weak.

Research Analyst Overview

Arachidonic acid is a polyunsaturated omega-6 fatty acid with an essential role in the production of eicosanoids, which are signaling molecules involved in various physiological processes. It is found in cell membranes of mammals, including the brain and eyes, and plays a crucial role in brain development, visual acuity, neuron growth, and cell survival. Arachidonic acid is available in various forms, including solid form (powder), crystalline form, liquid form (oil-based solutions), and oil-based products. Plant-based sources of arachidonic acid include algae, fungi, and certain plant-based oils such as those derived from Mortierella alpine. Animal-derived products, such as poultry, meat, eggs, and seafood, are also rich sources of arachidonic acid.

Furthermore, arachidonic acid is used in infant formula and infant nutrition products for its role in brain and nervous system development. Arachidonic acid is also used in sports supplements and nutritional products for its anti-inflammatory properties, muscle hypertrophy, muscle gain, and muscle inflammation. It is used in bodybuilding supplements, sports drinks, and other health supplements for various health benefits, including memory, eyesight, cognitive function, and immune system support. Arachidonic acid is also used in the treatment of brain diseases, depression, and other health conditions. Arachidonic acid is produced from the metabolism of linoleic acid, an essential fatty acid found in various plant-based sources such as nuts, seeds, legumes, grains, and vegetable oils.

Moreover, it is also found in phospholipids in the gallbladder membrane and proteins in various tissues. The solvent segment is the major market for arachidonic acid, with demand coming from various industries, including sports nutrition, newborn nutrition, baby nutrition, and diabetes treatment.

Market Scope

Report Coverage

Details

Page number

146

Base year

2023

Historic period

2018-2022

Forecast period

2024-2028

Growth momentum & CAGR

Accelerate at a CAGR of 8.15%

Market growth 2024-2028

USD 37.41 million

Market structure

Fragmented

YoY growth 2023-2024(%)

7.72

Key companies profiled

Avantor Inc., BASF SE, Bio Techne Corp., Biosynth Ltd., Cargill Inc., Cayman Chemical, Croda International Plc, Koninklijke DSM NV, LGC Science Group Holdings Ltd., Merck KGaA, Parchem Fine and Specialty Chemicals Inc., PerkinElmer Inc., Selleck Chemicals LLC, Sisco Research Laboratories Pvt. Ltd., Spectrum Laboratory Products Inc., Thermo Fisher Scientific Inc., Tokyo Chemical Industry Co. Ltd., Wanrun Co. Ltd., Xiamen Jindawei Group Co. Ltd., and Zhejiang Tianhecheng Bio technology Shares Co. Ltd.

Market dynamics

Parent market analysis, market forecast, market growth inducers and obstacles,market forecast , fast-growing and slow-growing segment analysis, COVID-19 impact and recovery analysis and future consumer dynamics, market condition analysis for the forecast period

Customization purview

If our market report has not included the data that you are looking for, you can reach out to our analysts and get segments customized.

Competitive landscape

Leading Companies, Market Positioning of Companies, Competitive Strategies, and Industry Risks

Request Free Sample

What are the Key Data Covered in this Market Research Report?

  • CAGR of the market during the forecast period
  • Detailed information on factors that will drive the market growth and forecasting between 2024 and 2028
  • Precise estimation of the size of the market  and its contribution of the market in focus to the parent market
  • Accurate predictions about upcoming market growth and trends and changes in consumer behaviour
  • Growth of the market across North America
  • Thorough analysis of the market's competitive landscape and detailed information about companies
  • Comprehensive analysis of factors that will challenge the growth of market companies

We can help! Our analysts can customize this market research report to meet your requirements Get in touch

1 Executive Summary

  • 1.1 Market overview
    • Exhibit 01: Executive Summary – Chart on Market Overview
    • Exhibit 02: Executive Summary – Data Table on Market Overview
    • Exhibit 03: Executive Summary – Chart on Country Market Characteristics
    • Exhibit 04: Executive Summary – Chart on Market by Geography
    • Exhibit 05: Executive Summary – Chart on Market Segmentation by Application
    • Exhibit 06: Executive Summary – Chart on Market Segmentation by Source
    • Exhibit 07: Executive Summary – Chart on Incremental Growth
    • Exhibit 08: Executive Summary – Data Table on Incremental Growth
    • Exhibit 09: Executive Summary – Chart on Vendor Market Positioning

2 Market Landscape

  • 2.1 Market ecosystem
    • Exhibit 10: Parent market
    • Exhibit 11: Market Characteristics

3 Market Sizing

  • 3.1 Market definition
    • Exhibit 12: Offerings of vendors included in the market definition
  • 3.2 Market segment analysis
    • Exhibit 13: Market segments
  • 3.3 Market size 2023
    • 3.4 Market outlook: Forecast for 2023-2028
      • Exhibit 14: Chart on North America - Market size and forecast 2023-2028 ($ million)
      • Exhibit 15: Data Table on Regional - Market size and forecast 2023-2028 ($ million)
      • Exhibit 16: Chart on North America: Year-over-year growth 2023-2028 (%)
      • Exhibit 17: Data Table on Regional - Market size and forecast 2023-2028 ($ million)

    4 Historic Market Size

    • 4.1 Arachidonic acid market in North America 2018 - 2022
      • Exhibit 18: Historic Market Size – Data Table on arachidonic acid market in north America 2018 - 2022 ($ million)
    • 4.2 Application Segment Analysis 2018 - 2022
      • Exhibit 19: Historic Market Size – Application Segment 2018 - 2022 ($ million)
    • 4.3 Source Segment Analysis 2018 - 2022
      • Exhibit 20: Historic Market Size – Source Segment 2018 - 2022 ($ million)
    • 4.4 Geography Segment Analysis 2018 - 2022
      • Exhibit 21: Historic Market Size – Geography Segment 2018 - 2022 ($ million)

    5 Five Forces Analysis

    • 5.1 Five forces summary
      • Exhibit 22: Five forces analysis - Comparison between 2023 and 2028
    • 5.2 Bargaining power of buyers
      • Exhibit 23: Chart on Bargaining power of buyers – Impact of key factors 2023 and 2028
    • 5.3 Bargaining power of suppliers
      • Exhibit 24: Bargaining power of suppliers – Impact of key factors in 2023 and 2028
    • 5.4 Threat of new entrants
      • Exhibit 25: Threat of new entrants – Impact of key factors in 2023 and 2028
    • 5.5 Threat of substitutes
      • Exhibit 26: Threat of substitutes – Impact of key factors in 2023 and 2028
    • 5.6 Threat of rivalry
      • Exhibit 27: Threat of rivalry – Impact of key factors in 2023 and 2028
    • 5.7 Market condition
      • Exhibit 28: Chart on Market condition - Five forces 2023 and 2028

    6 Market Segmentation by Application

    • 6.1 Market segments
      • Exhibit 29: Chart on Application - Market share 2023-2028 (%)
      • Exhibit 30: Data Table on Application - Market share 2023-2028 (%)
    • 6.2 Comparison by Application
      • Exhibit 31: Chart on Comparison by Application
      • Exhibit 32: Data Table on Comparison by Application
    • 6.3 Infant formula - Market size and forecast 2023-2028
      • Exhibit 33: Chart on Infant formula - Market size and forecast 2023-2028 ($ million)
      • Exhibit 34: Data Table on Infant formula - Market size and forecast 2023-2028 ($ million)
      • Exhibit 35: Chart on Infant formula - Year-over-year growth 2023-2028 (%)
      • Exhibit 36: Data Table on Infant formula - Year-over-year growth 2023-2028 (%)
    • 6.4 Others - Market size and forecast 2023-2028
      • Exhibit 37: Chart on Others - Market size and forecast 2023-2028 ($ million)
      • Exhibit 38: Data Table on Others - Market size and forecast 2023-2028 ($ million)
      • Exhibit 39: Chart on Others - Year-over-year growth 2023-2028 (%)
      • Exhibit 40: Data Table on Others - Year-over-year growth 2023-2028 (%)
    • 6.5 Market opportunity by Application
      • Exhibit 41: Market opportunity by Application ($ million)
      • Exhibit 42: Data Table on Market opportunity by Application ($ million)

    7 Market Segmentation by Source

    • 7.1 Market segments
      • Exhibit 43: Chart on Source - Market share 2023-2028 (%)
      • Exhibit 44: Data Table on Source - Market share 2023-2028 (%)
    • 7.2 Comparison by Source
      • Exhibit 45: Chart on Comparison by Source
      • Exhibit 46: Data Table on Comparison by Source
    • 7.3 Plant source - Market size and forecast 2023-2028
      • Exhibit 47: Chart on Plant source - Market size and forecast 2023-2028 ($ million)
      • Exhibit 48: Data Table on Plant source - Market size and forecast 2023-2028 ($ million)
      • Exhibit 49: Chart on Plant source - Year-over-year growth 2023-2028 (%)
      • Exhibit 50: Data Table on Plant source - Year-over-year growth 2023-2028 (%)
    • 7.4 Animal source - Market size and forecast 2023-2028
      • Exhibit 51: Chart on Animal source - Market size and forecast 2023-2028 ($ million)
      • Exhibit 52: Data Table on Animal source - Market size and forecast 2023-2028 ($ million)
      • Exhibit 53: Chart on Animal source - Year-over-year growth 2023-2028 (%)
      • Exhibit 54: Data Table on Animal source - Year-over-year growth 2023-2028 (%)
    • 7.5 Market opportunity by Source
      • Exhibit 55: Market opportunity by Source ($ million)
      • Exhibit 56: Data Table on Market opportunity by Source ($ million)

    8 Customer Landscape

    • 8.1 Customer landscape overview
      • Exhibit 57: Analysis of price sensitivity, lifecycle, customer purchase basket, adoption rates, and purchase criteria

    9 Geographic Landscape

    • 9.1 Geographic segmentation
      • Exhibit 58: Chart on Market share by geography - 2023-2028 (%)
      • Exhibit 59: Data Table on Market share by geography - 2023-2028 (%)
    • 9.2 Geographic comparison
      • Exhibit 60: Chart on Geographic comparison
      • Exhibit 61: Data Table on Geographic comparison
    • 9.3 US - Market size and forecast 2023-2028
      • Exhibit 62: Chart on US - Market size and forecast 2023-2028 ($ million)
      • Exhibit 63: Data Table on US - Market size and forecast 2023-2028 ($ million)
      • Exhibit 64: Chart on US - Year-over-year growth 2023-2028 (%)
      • Exhibit 65: Data Table on US - Year-over-year growth 2023-2028 (%)
    • 9.4 Canada - Market size and forecast 2023-2028
      • Exhibit 66: Chart on Canada - Market size and forecast 2023-2028 ($ million)
      • Exhibit 67: Data Table on Canada - Market size and forecast 2023-2028 ($ million)
      • Exhibit 68: Chart on Canada - Year-over-year growth 2023-2028 (%)
      • Exhibit 69: Data Table on Canada - Year-over-year growth 2023-2028 (%)
    • 9.5 Mexico - Market size and forecast 2023-2028
      • Exhibit 70: Chart on Mexico - Market size and forecast 2023-2028 ($ million)
      • Exhibit 71: Data Table on Mexico - Market size and forecast 2023-2028 ($ million)
      • Exhibit 72: Chart on Mexico - Year-over-year growth 2023-2028 (%)
      • Exhibit 73: Data Table on Mexico - Year-over-year growth 2023-2028 (%)
    • 9.6 Market opportunity by geography
      • Exhibit 74: Market opportunity by geography ($ million)
      • Exhibit 75: Data Table on Market opportunity by geography ($ million)

    10 Drivers, Challenges, and Trends

    • 10.1 Market drivers
      • 10.2 Market challenges
        • 10.3 Impact of drivers and challenges
          • Exhibit 76: Impact of drivers and challenges in 2023 and 2028
        • 10.4 Market trends

          11 Vendor Landscape

          • 11.1 Overview
            • 11.2 Vendor landscape
              • Exhibit 77: Overview on Criticality of inputs and Factors of differentiation
            • 11.3 Landscape disruption
              • Exhibit 78: Overview on factors of disruption
            • 11.4 Industry risks
              • Exhibit 79: Impact of key risks on business

            12 Vendor Analysis

            • 12.1 Vendors covered
              • Exhibit 80: Vendors covered
            • 12.2 Market positioning of vendors
              • Exhibit 81: Matrix on vendor position and classification
            • 12.3 Avantor Inc.
              • Exhibit 82: Avantor Inc. - Overview
              • Exhibit 83: Avantor Inc. - Business segments
              • Exhibit 84: Avantor Inc. - Key offerings
              • Exhibit 85: Avantor Inc. - Segment focus
            • 12.4 BASF SE
              • Exhibit 86: BASF SE - Overview
              • Exhibit 87: BASF SE - Business segments
              • Exhibit 88: BASF SE - Key news
              • Exhibit 89: BASF SE - Key offerings
              • Exhibit 90: BASF SE - Segment focus
            • 12.5 Biosynth Ltd.
              • Exhibit 91: Biosynth Ltd. - Overview
              • Exhibit 92: Biosynth Ltd. - Product / Service
              • Exhibit 93: Biosynth Ltd. - Key offerings
            • 12.6 Cargill Inc.
              • Exhibit 94: Cargill Inc. - Overview
              • Exhibit 95: Cargill Inc. - Product / Service
              • Exhibit 96: Cargill Inc. - Key news
              • Exhibit 97: Cargill Inc. - Key offerings
            • 12.7 Cayman Chemical
              • Exhibit 98: Cayman Chemical - Overview
              • Exhibit 99: Cayman Chemical - Product / Service
              • Exhibit 100: Cayman Chemical - Key offerings
            • 12.8 Croda International Plc
              • Exhibit 101: Croda International Plc - Overview
              • Exhibit 102: Croda International Plc - Business segments
              • Exhibit 103: Croda International Plc - Key news
              • Exhibit 104: Croda International Plc - Key offerings
              • Exhibit 105: Croda International Plc - Segment focus
            • 12.9 Koninklijke DSM NV
              • Exhibit 106: Koninklijke DSM NV - Overview
              • Exhibit 107: Koninklijke DSM NV - Business segments
              • Exhibit 108: Koninklijke DSM NV - Key news
              • Exhibit 109: Koninklijke DSM NV - Key offerings
              • Exhibit 110: Koninklijke DSM NV - Segment focus
            • 12.10 Merck KGaA
              • Exhibit 111: Merck KGaA - Overview
              • Exhibit 112: Merck KGaA - Business segments
              • Exhibit 113: Merck KGaA - Key news
              • Exhibit 114: Merck KGaA - Key offerings
              • Exhibit 115: Merck KGaA - Segment focus
            • 12.11 Parchem Fine and Specialty Chemicals Inc.
              • Exhibit 116: Parchem Fine and Specialty Chemicals Inc. - Overview
              • Exhibit 117: Parchem Fine and Specialty Chemicals Inc. - Product / Service
              • Exhibit 118: Parchem Fine and Specialty Chemicals Inc. - Key offerings
            • 12.12 PerkinElmer Inc.
              • Exhibit 119: PerkinElmer Inc. - Overview
              • Exhibit 120: PerkinElmer Inc. - Business segments
              • Exhibit 121: PerkinElmer Inc. - Key news
              • Exhibit 122: PerkinElmer Inc. - Key offerings
              • Exhibit 123: PerkinElmer Inc. - Segment focus
            • 12.13 Selleck Chemicals LLC
              • Exhibit 124: Selleck Chemicals LLC - Overview
              • Exhibit 125: Selleck Chemicals LLC - Product / Service
              • Exhibit 126: Selleck Chemicals LLC - Key offerings
            • 12.14 Spectrum Laboratory Products Inc.
              • Exhibit 127: Spectrum Laboratory Products Inc. - Overview
              • Exhibit 128: Spectrum Laboratory Products Inc. - Product / Service
              • Exhibit 129: Spectrum Laboratory Products Inc. - Key offerings
            • 12.15 Thermo Fisher Scientific Inc.
              • Exhibit 130: Thermo Fisher Scientific Inc. - Overview
              • Exhibit 131: Thermo Fisher Scientific Inc. - Business segments
              • Exhibit 132: Thermo Fisher Scientific Inc. - Key news
              • Exhibit 133: Thermo Fisher Scientific Inc. - Key offerings
              • Exhibit 134: Thermo Fisher Scientific Inc. - Segment focus
            • 12.16 Wanrun Co. Ltd.
              • Exhibit 135: Wanrun Co. Ltd. - Overview
              • Exhibit 136: Wanrun Co. Ltd. - Product / Service
              • Exhibit 137: Wanrun Co. Ltd. - Key offerings
            • 12.17 Xiamen Jindawei Group Co. Ltd.
              • Exhibit 138: Xiamen Jindawei Group Co. Ltd. - Overview
              • Exhibit 139: Xiamen Jindawei Group Co. Ltd. - Product / Service
              • Exhibit 140: Xiamen Jindawei Group Co. Ltd. - Key offerings

            13 Appendix

            • 13.1 Scope of the report
              • 13.2 Inclusions and exclusions checklist
                • Exhibit 141: Inclusions checklist
                • Exhibit 142: Exclusions checklist
              • 13.3 Currency conversion rates for US$
                • Exhibit 143: Currency conversion rates for US$
              • 13.4 Research methodology
                • Exhibit 144: Research methodology
                • Exhibit 145: Validation techniques employed for market sizing
                • Exhibit 146: Information sources
              • 13.5 List of abbreviations
                • Exhibit 147: List of abbreviations

              Research Methodology

              Technavio presents a detailed picture of the market by way of study, synthesis, and summation of data from multiple sources. The analysts have presented the various facets of the market with a particular focus on identifying the key industry influencers. The data thus presented is comprehensive, reliable, and the result of extensive research, both primary and secondary.

              INFORMATION SOURCES

              Primary sources

              • Manufacturers and suppliers
              • Channel partners
              • Industry experts
              • Strategic decision makers

              Secondary sources

              • Industry journals and periodicals
              • Government data
              • Financial reports of key industry players
              • Historical data
              • Press releases

              DATA ANALYSIS

              Data Synthesis

              • Collation of data
              • Estimation of key figures
              • Analysis of derived insights

              Data Validation

              • Triangulation with data models
              • Reference against proprietary databases
              • Corroboration with industry experts

              REPORT WRITING

              Qualitative

              • Market drivers
              • Market challenges
              • Market trends
              • Five forces analysis

              Quantitative

              • Market size and forecast
              • Market segmentation
              • Geographical insights
              • Competitive landscape

              Interested in this report?

              Get your sample now to see our research methodology and insights!

              Download Now

              Frequently Asked Questions

              Arachidonic Acidin North America market growth will increase by $ 37.41 mn during 2024-2028.

              The Arachidonic Acidin North America market is expected to grow at a CAGR of 8.15% during 2024-2028.

              Arachidonic Acidin North America market is segmented by Application( Infant formula, Others) Source( Plant source, Animal source, Canada)

              Avantor Inc., BASF SE, Bio Techne Corp., Biosynth Ltd., Cargill Inc., Cayman Chemical, Croda International Plc, Koninklijke DSM NV, LGC Science Group Holdings Ltd., Merck KGaA, Parchem Fine and Specialty Chemicals Inc., PerkinElmer Inc., Selleck Chemicals LLC, Sisco Research Laboratories Pvt. Ltd., Spectrum Laboratory Products Inc., Thermo Fisher Scientific Inc., Tokyo Chemical Industry Co. Ltd., Wanrun Co. Ltd., Xiamen Jindawei Group Co. Ltd., Zhejiang Tianhecheng Bio technology Shares Co. Ltd. are a few of the key vendors in the Arachidonic Acidin North America market.

              North America will register the highest growth rate of 100% among the other regions. Therefore, the Arachidonic Acidin North America market in North America is expected to garner significant business opportunities for the vendors during the forecast period.

              US, Canada, Mexico

              • Rising demand for sports supplementsFitness training is the driving factor this market.
              • bodybuilding is the driving factor this market.
              • and sports specialization are growing in popularity among people aged 20-40 years. Most training regimes require those who participate in them to take vitamins is the driving factor this market.
              • minerals is the driving factor this market.
              • proteins is the driving factor this market.
              • herbs is the driving factor this market.
              • and other botanical supplements is the driving factor this market.
              • as these nutrients are required for building lean muscle is the driving factor this market.
              • losing extra body mass is the driving factor this market.
              • and maintaining cholesterol levels under control. Consumers are increasingly becoming conscious about their diets and are showing greater interest in healthy eating habits. This is propelling the demand for dietary supplements. Healthy diets have spurred the demand for dietary supplements. This is expected to increase the demand for arachidonic acid in North America during the forecast period. Arachidonic acid is an essential fatty acid important in the regular diets consumed by athletes. The acid is considered an essential fatty acid as it provides complete nourishment for the proper functioning of the human body. Fat is an important and essential constituent of an athlete's diet as it provides energy is the driving factor this market.
              • ensures the proper absorption of fat-soluble vitamins into the body is the driving factor this market.
              • and provides essential fatty acids. Arachidonic acid is an essential fatty acid and is widely used in the manufacturing of sports nutrition products. Thus is the driving factor this market.
              • the growing focus on enhancing muscle and bone strength is increasing the demand for sports supplements from both men and women in North America. Sports nutrition products are consumed for benefits such as muscle-building is the driving factor this market.
              • energy and recovery from sports-related injuries is the driving factor this market.
              • weight loss is the driving factor this market.
              • and testosterone support. Everyday foods and drinks do not contain the appropriate amounts of nutrients that are needed by the body to reduce nutritional deficiencies. Dietary supplements are used to make up for the deficiency of certain nutrients in the body without indulging in overeating. The intake of dietary supplements is the driving factor this market.
              • along with a coordinated and nutritious diet is the driving factor this market.
              • can help athletes is the driving factor this market.
              • sportspersons is the driving factor this market.
              • and training enthusiasts achieve superior performance in sports and everyday work-life activities. It can reduce exhaustion and strain on the body. These supplements can also is the driving factor this market.
              • up to some extent is the driving factor this market.
              • mitigate problems arising from a sedentary lifestyle and the consumption of fast food is the driving factor this market.
              • which is very common among today's urban population is the driving factor this market.
              • as they increase the resistance to infections and diseases and strengthen the body's immunity. Owing to the above-mentioned factors is the driving factor this market.
              • the number of people consuming dietary supplements is increasing each year is the driving factor this market.
              • and it will drive the growth of the arachidonic acid market in North America during the forecast period. is the driving factor this market.

              The Arachidonic Acidin North America market vendors should focus on grabbing business opportunities from the Infant formula segment as it accounted for the largest market share in the base year.
              RIA - Research AI Assistant
              Ask RIA