Poultry Meat Market Analysis, Size, and Forecast 2026-2030: APAC (China, India, and Indonesia), North America (US, Canada, and Mexico), Europe (Germany, France, and Italy), South America (Brazil, Argentina, and Colombia), Middle East and Africa (South Africa, Saudi Arabia, and UAE), and Rest of World (ROW)

Poultry Meat Market Analysis, Size, and Forecast 2026-2030:
APAC (China, India, and Indonesia), North America (US, Canada, and Mexico), Europe (Germany, France, and Italy), South America (Brazil, Argentina, and Colombia), Middle East and Africa (South Africa, Saudi Arabia, and UAE), and Rest of World (ROW)

Published: Dec 2025 295 Pages SKU: IRTNTR44756

Market Overview at a Glance

$70.35 B
Market Opportunity
3.1%
CAGR 2025 - 2030
54.4%
APAC Growth
$338.03 B
Chicken meat segment 2024

Poultry Meat Market Size 2026-2030

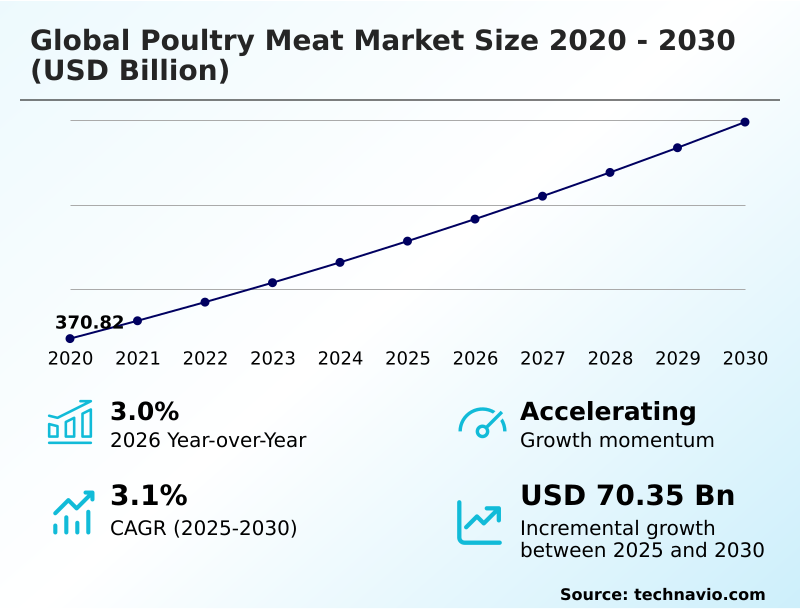
The poultry meat market size is valued to increase by USD 70.35 billion, at a CAGR of 3.1% from 2025 to 2030. Sustained global demand for affordable and healthy protein will drive the poultry meat market.

Major Market Trends & Insights

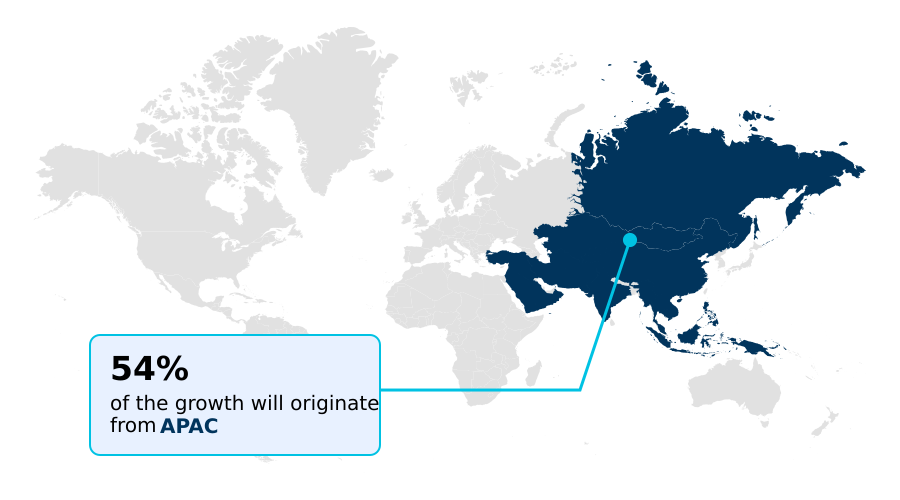
  • APAC dominated the market and accounted for a 54.4% growth during the forecast period.
  • By Type - Chicken meat segment was valued at USD 338.03 billion in 2024
  • By Distribution Channel - Offline segment accounted for the largest market revenue share in 2024

Market Size & Forecast

  • Market Opportunities: USD 127.96 billion
  • Market Future Opportunities: USD 70.35 billion
  • CAGR from 2025 to 2030 : 3.1%

Market Summary

What will be the Size of the Poultry Meat Market during the forecast period?

Get Key Insights on Market Forecast (PDF) Request Free Sample

How is the Poultry Meat Market Segmented?

The poultry meat industry research report provides comprehensive data (region-wise segment analysis), with forecasts and estimates in "USD million" for the period 2026-2030, as well as historical data from 2020-2024 for the following segments.

  • Type
    • Chicken meat
    • Turkey meat
    • Duck meat
    • Others
  • Distribution channel
    • Offline
    • Online
  • Product
    • Frozen poultry meat
    • Fresh poultry meat
    • Processed poultry meat
  • Geography
    • APAC
      • China
      • India
      • Indonesia
    • North America
      • US
      • Canada
      • Mexico
    • Europe
      • Germany
      • France
      • Italy
    • South America
      • Brazil
      • Argentina
      • Colombia
    • Middle East and Africa
      • South Africa
      • Saudi Arabia
      • UAE
    • Rest of World (ROW)

By Type Insights

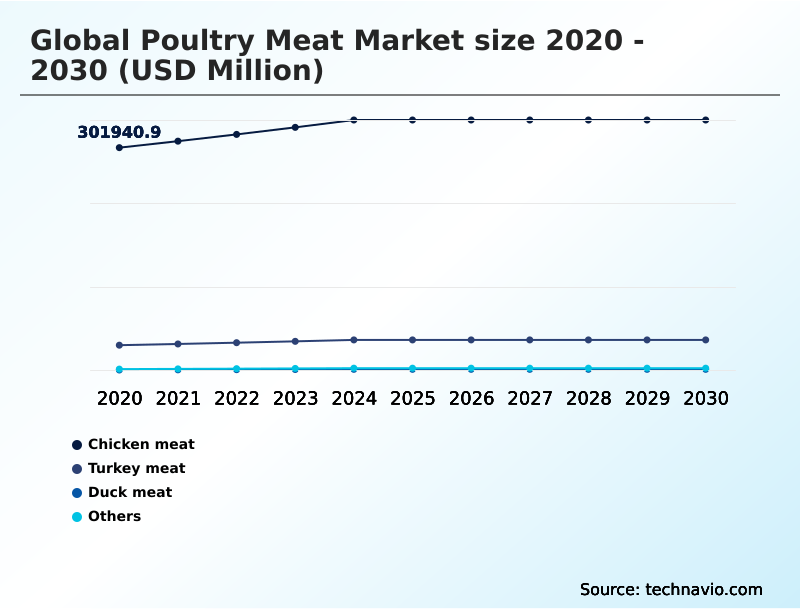
The chicken meat segment is estimated to witness significant growth during the forecast period.

Request Free Sample

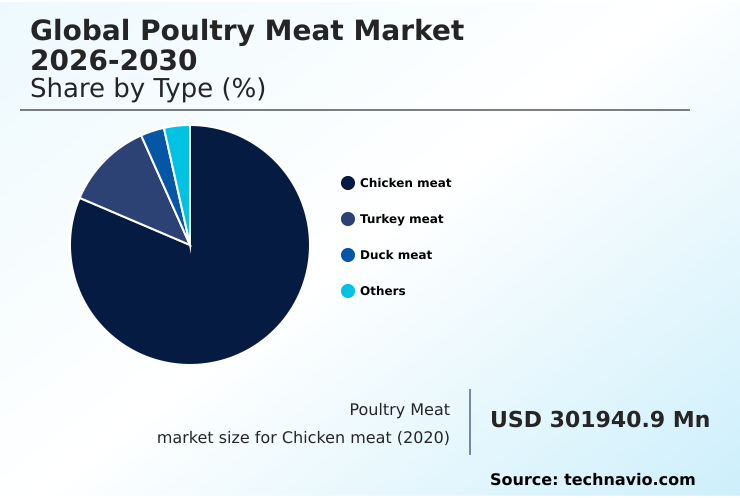
The Chicken meat segment was valued at USD 338.03 billion in 2024 and showed a gradual increase during the forecast period.

Request Free Sample

Regional Analysis

APAC is estimated to contribute 54.4% to the growth of the global market during the forecast period.Technavio’s analysts have elaborately explained the regional trends and drivers that shape the market during the forecast period.

See How Poultry Meat Market Demand is Rising in APAC Request Free Sample

Market Dynamics

Our researchers analyzed the data with 2025 as the base year, along with the key drivers, trends, and challenges. A holistic analysis of drivers will help companies refine their marketing strategies to gain a competitive advantage.

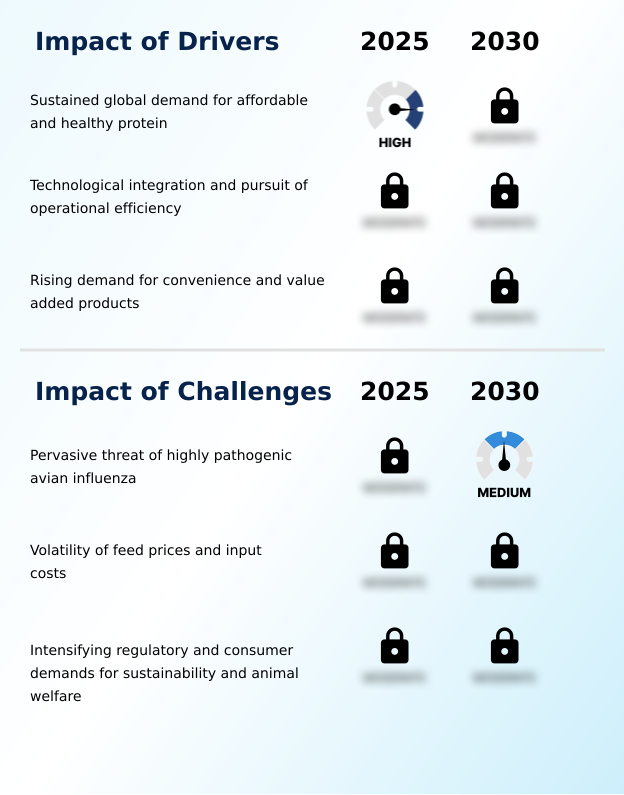
What are the key market drivers leading to the rise in the adoption of Poultry Meat Industry?

What are the market trends shaping the Poultry Meat Industry?

What challenges does the Poultry Meat Industry face during its growth?

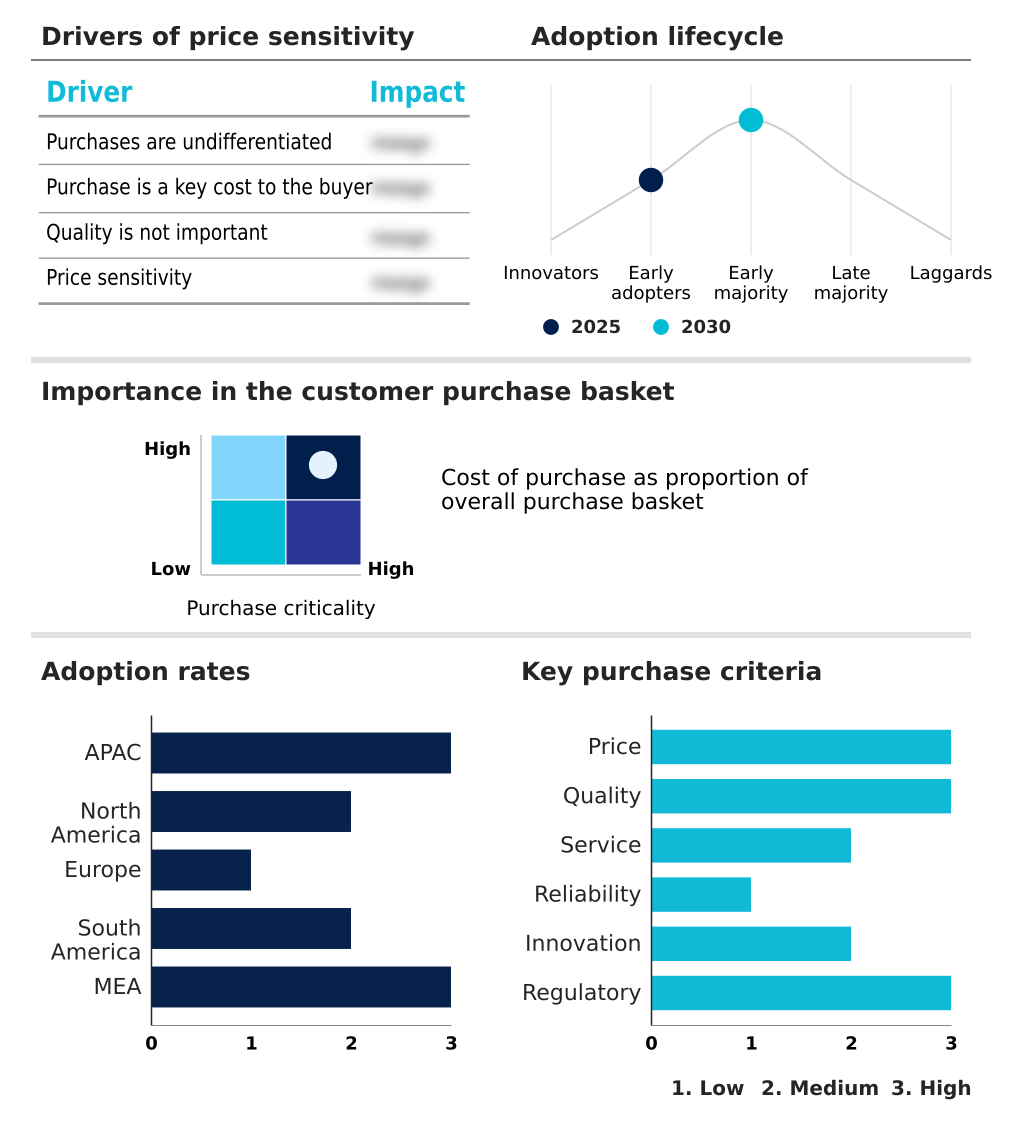
Exclusive Technavio Analysis on Customer Landscape

The poultry meat market forecasting report includes the adoption lifecycle of the market, covering from the innovator’s stage to the laggard’s stage. It focuses on adoption rates in different regions based on penetration. Furthermore, the poultry meat market report also includes key purchase criteria and drivers of price sensitivity to help companies evaluate and develop their market growth analysis strategies.

Customer Landscape of Poultry Meat Industry

Competitive Landscape

Companies are implementing various strategies, such as strategic alliances, poultry meat market forecast, partnerships, mergers and acquisitions, geographical expansion, and product/service launches, to enhance their presence in the industry.

Acolid -

The industry research and growth report includes detailed analyses of the competitive landscape of the market and information about key companies, including:

  • Acolid
  • BRF SA
  • Cargill Inc.
  • Charoen Pokphand Foods
  • Fujian Sunner Development
  • Industrias Bachoco S.A.
  • JAPFA LTD
  • JBS SA
  • KOCH FOODS INC.
  • LDC Group
  • Lihua Foods Group
  • MHP SE
  • New Hope Liuhe Co. Ltd.
  • Perdue Farms
  • Plukon Food Group BV
  • San Miguel Corp.
  • Suguna Foods Pvt. Ltd.
  • Tyson Foods Inc.
  • Wayne Sanderson Farms
  • Wens Foodstuff Group

Qualitative and quantitative analysis of companies has been conducted to help clients understand the wider business environment as well as the strengths and weaknesses of key industry players. Data is qualitatively analyzed to categorize companies as pure play, category-focused, industry-focused, and diversified; it is quantitatively analyzed to categorize companies as dominant, leading, strong, tentative, and weak.

Recent Development and News in Poultry meat market

Dive into Technavio’s robust research methodology, blending expert interviews, extensive data synthesis, and validated models for unparalleled Poultry Meat Market insights. See full methodology.

Market Scope
Page number 295
Base year 2025
Historic period 2020-2024
Forecast period 2026-2030
Growth momentum & CAGR Accelerate at a CAGR of 3.1%
Market growth 2026-2030 USD 70352.9 million
Market structure Fragmented
YoY growth 2025-2026(%) 3.0%
Key countries China, India, Indonesia, Japan, Vietnam, Thailand, US, Canada, Mexico, Germany, Russia, France, Italy, Poland, UK, Brazil, Argentina, Colombia, South Africa, Saudi Arabia, UAE, Turkey and Israel
Competitive landscape Leading Companies, Market Positioning of Companies, Competitive Strategies, and Industry Risks

Request Free Sample

Research Analyst Overview

What are the Key Data Covered in this Poultry Meat Market Research and Growth Report?

  • What is the expected growth of the Poultry Meat Market between 2026 and 2030?

    • USD 70.35 billion, at a CAGR of 3.1%

  • What segmentation does the market report cover?

    • The report is segmented by Type (Chicken meat, Turkey meat, Duck meat, and Others), Distribution Channel (Offline, and Online), Product (Frozen poultry meat, Fresh poultry meat, and Processed poultry meat) and Geography (APAC, North America, Europe, South America, Middle East and Africa)

  • Which regions are analyzed in the report?

    • APAC, North America, Europe, South America and Middle East and Africa

  • What are the key growth drivers and market challenges?

    • Sustained global demand for affordable and healthy protein, Pervasive threat of highly pathogenic avian influenza

  • Who are the major players in the Poultry Meat Market?

    • Acolid, BRF SA, Cargill Inc., Charoen Pokphand Foods, Fujian Sunner Development, Industrias Bachoco S.A., JAPFA LTD, JBS SA, KOCH FOODS INC., LDC Group, Lihua Foods Group, MHP SE, New Hope Liuhe Co. Ltd., Perdue Farms, Plukon Food Group BV, San Miguel Corp., Suguna Foods Pvt. Ltd., Tyson Foods Inc., Wayne Sanderson Farms and Wens Foodstuff Group

Market Research Insights

We can help! Our analysts can customize this poultry meat market research report to meet your requirements.

Get in touch

1. Executive Summary

1.1 Market overview

Executive Summary - Chart on Market Overview
Executive Summary - Data Table on Market Overview
Executive Summary - Chart on Global Market Characteristics
Executive Summary - Chart on Market by Geography
Executive Summary - Chart on Market Segmentation by Type
Executive Summary - Chart on Market Segmentation by Distribution Channel
Executive Summary - Chart on Market Segmentation by Product
Executive Summary - Chart on Incremental Growth
Executive Summary - Data Table on Incremental Growth
Executive Summary - Chart on Company Market Positioning

2. Technavio Analysis

2.1 Analysis of price sensitivity, lifecycle, customer purchase basket, adoption rates, and purchase criteria

2.2 Criticality of inputs and Factors of differentiation

Chart on Overview on criticality of inputs and factors of differentiation

2.3 Factors of disruption

Chart on Overview on factors of disruption

2.4 Impact of drivers and challenges

Chart on Impact of drivers and challenges in 2025 and 2030

3. Market Landscape

3.1 Market ecosystem

Chart on Parent Market
Data Table on - Parent Market

3.2 Market characteristics

Chart on Market characteristics analysis

3.3 Value chain analysis

Chart on Value chain analysis

4. Market Sizing

4.1 Market definition

Data Table on Offerings of companies included in the market definition

4.2 Market segment analysis

Market segments

4.3 Market size 2025

4.4 Market outlook: Forecast for 2025-2030

Chart on Global - Market size and forecast 2025-2030 ($ million)
Data Table on Global - Market size and forecast 2025-2030 ($ million)
Chart on Global Market: Year-over-year growth 2025-2030 (%)
Data Table on Global Market: Year-over-year growth 2025-2030 (%)

5. Historic Market Size

5.1 Global Poultry Meat Market 2020 - 2024

Historic Market Size - Data Table on Global Poultry Meat Market 2020 - 2024 ($ million)

5.2 Type segment analysis 2020 - 2024

Historic Market Size - Type Segment 2020 - 2024 ($ million)

5.3 Distribution Channel segment analysis 2020 - 2024

Historic Market Size - Distribution Channel Segment 2020 - 2024 ($ million)

5.4 Product segment analysis 2020 - 2024

Historic Market Size - Product Segment 2020 - 2024 ($ million)

5.5 Geography segment analysis 2020 - 2024

Historic Market Size - Geography Segment 2020 - 2024 ($ million)

5.6 Country segment analysis 2020 - 2024

Historic Market Size - Country Segment 2020 - 2024 ($ million)

6. Qualitative Analysis

6.1 The AI impact on global poultry meat market

7. Five Forces Analysis

7.1 Five forces summary

Five forces analysis - Comparison between 2025 and 2030

7.2 Bargaining power of buyers

Bargaining power of buyers - Impact of key factors 2025 and 2030

7.3 Bargaining power of suppliers

Bargaining power of suppliers - Impact of key factors in 2025 and 2030

7.4 Threat of new entrants

Threat of new entrants - Impact of key factors in 2025 and 2030

7.5 Threat of substitutes

Threat of substitutes - Impact of key factors in 2025 and 2030

7.6 Threat of rivalry

Threat of rivalry - Impact of key factors in 2025 and 2030

7.7 Market condition

Chart on Market condition - Five forces 2025 and 2030

8. Market Segmentation by Type

8.1 Market segments

Chart on Type - Market share 2025-2030 (%)
Data Table on Type - Market share 2025-2030 (%)

8.2 Comparison by Type

Chart on Comparison by Type
Data Table on Comparison by Type

8.3 Chicken meat - Market size and forecast 2025-2030

Chart on Chicken meat - Market size and forecast 2025-2030 ($ million)
Data Table on Chicken meat - Market size and forecast 2025-2030 ($ million)
Chart on Chicken meat - Year-over-year growth 2025-2030 (%)
Data Table on Chicken meat - Year-over-year growth 2025-2030 (%)

8.4 Turkey meat - Market size and forecast 2025-2030

Chart on Turkey meat - Market size and forecast 2025-2030 ($ million)
Data Table on Turkey meat - Market size and forecast 2025-2030 ($ million)
Chart on Turkey meat - Year-over-year growth 2025-2030 (%)
Data Table on Turkey meat - Year-over-year growth 2025-2030 (%)

8.5 Duck meat - Market size and forecast 2025-2030

Chart on Duck meat - Market size and forecast 2025-2030 ($ million)
Data Table on Duck meat - Market size and forecast 2025-2030 ($ million)
Chart on Duck meat - Year-over-year growth 2025-2030 (%)
Data Table on Duck meat - Year-over-year growth 2025-2030 (%)

8.6 Others - Market size and forecast 2025-2030

Chart on Others - Market size and forecast 2025-2030 ($ million)
Data Table on Others - Market size and forecast 2025-2030 ($ million)
Chart on Others - Year-over-year growth 2025-2030 (%)
Data Table on Others - Year-over-year growth 2025-2030 (%)

8.7 Market opportunity by Type

Market opportunity by Type ($ million)
Data Table on Market opportunity by Type ($ million)

9. Market Segmentation by Distribution Channel

9.1 Market segments

Chart on Distribution Channel - Market share 2025-2030 (%)
Data Table on Distribution Channel - Market share 2025-2030 (%)

9.2 Comparison by Distribution Channel

Chart on Comparison by Distribution Channel
Data Table on Comparison by Distribution Channel

9.3 Offline - Market size and forecast 2025-2030

Chart on Offline - Market size and forecast 2025-2030 ($ million)
Data Table on Offline - Market size and forecast 2025-2030 ($ million)
Chart on Offline - Year-over-year growth 2025-2030 (%)
Data Table on Offline - Year-over-year growth 2025-2030 (%)

9.4 Online - Market size and forecast 2025-2030

Chart on Online - Market size and forecast 2025-2030 ($ million)
Data Table on Online - Market size and forecast 2025-2030 ($ million)
Chart on Online - Year-over-year growth 2025-2030 (%)
Data Table on Online - Year-over-year growth 2025-2030 (%)

9.5 Market opportunity by Distribution Channel

Market opportunity by Distribution Channel ($ million)
Data Table on Market opportunity by Distribution Channel ($ million)

10. Market Segmentation by Product

10.1 Market segments

Chart on Product - Market share 2025-2030 (%)
Data Table on Product - Market share 2025-2030 (%)

10.2 Comparison by Product

Chart on Comparison by Product
Data Table on Comparison by Product

10.3 Frozen poultry meat - Market size and forecast 2025-2030

Chart on Frozen poultry meat - Market size and forecast 2025-2030 ($ million)
Data Table on Frozen poultry meat - Market size and forecast 2025-2030 ($ million)
Chart on Frozen poultry meat - Year-over-year growth 2025-2030 (%)
Data Table on Frozen poultry meat - Year-over-year growth 2025-2030 (%)

10.4 Fresh poultry meat - Market size and forecast 2025-2030

Chart on Fresh poultry meat - Market size and forecast 2025-2030 ($ million)
Data Table on Fresh poultry meat - Market size and forecast 2025-2030 ($ million)
Chart on Fresh poultry meat - Year-over-year growth 2025-2030 (%)
Data Table on Fresh poultry meat - Year-over-year growth 2025-2030 (%)

10.5 Processed poultry meat - Market size and forecast 2025-2030

Chart on Processed poultry meat - Market size and forecast 2025-2030 ($ million)
Data Table on Processed poultry meat - Market size and forecast 2025-2030 ($ million)
Chart on Processed poultry meat - Year-over-year growth 2025-2030 (%)
Data Table on Processed poultry meat - Year-over-year growth 2025-2030 (%)

10.6 Market opportunity by Product

Market opportunity by Product ($ million)
Data Table on Market opportunity by Product ($ million)

11. Customer Landscape

11.1 Customer landscape overview

Analysis of price sensitivity, lifecycle, customer purchase basket, adoption rates, and purchase criteria

12. Geographic Landscape

12.1 Geographic segmentation

Chart on Market share by geography 2025-2030 (%)
Data Table on Market share by geography 2025-2030 (%)

12.2 Geographic comparison

Chart on Geographic comparison
Data Table on Geographic comparison

12.3 APAC - Market size and forecast 2025-2030

Chart on APAC - Market size and forecast 2025-2030 ($ million)
Data Table on APAC - Market size and forecast 2025-2030 ($ million)
Chart on APAC - Year-over-year growth 2025-2030 (%)
Data Table on APAC - Year-over-year growth 2025-2030 (%)
Chart on Regional Comparison - APAC
Data Table on Regional Comparison - APAC

12.3.1 China - Market size and forecast 2025-2030

Chart on China - Market size and forecast 2025-2030 ($ million)
Data Table on China - Market size and forecast 2025-2030 ($ million)
Chart on China - Year-over-year growth 2025-2030 (%)
Data Table on China - Year-over-year growth 2025-2030 (%)

12.3.2 India - Market size and forecast 2025-2030

Chart on India - Market size and forecast 2025-2030 ($ million)
Data Table on India - Market size and forecast 2025-2030 ($ million)
Chart on India - Year-over-year growth 2025-2030 (%)
Data Table on India - Year-over-year growth 2025-2030 (%)

12.3.3 Indonesia - Market size and forecast 2025-2030

Chart on Indonesia - Market size and forecast 2025-2030 ($ million)
Data Table on Indonesia - Market size and forecast 2025-2030 ($ million)
Chart on Indonesia - Year-over-year growth 2025-2030 (%)
Data Table on Indonesia - Year-over-year growth 2025-2030 (%)

12.3.4 Japan - Market size and forecast 2025-2030

Chart on Japan - Market size and forecast 2025-2030 ($ million)
Data Table on Japan - Market size and forecast 2025-2030 ($ million)
Chart on Japan - Year-over-year growth 2025-2030 (%)
Data Table on Japan - Year-over-year growth 2025-2030 (%)

12.3.5 Vietnam - Market size and forecast 2025-2030

Chart on Vietnam - Market size and forecast 2025-2030 ($ million)
Data Table on Vietnam - Market size and forecast 2025-2030 ($ million)
Chart on Vietnam - Year-over-year growth 2025-2030 (%)
Data Table on Vietnam - Year-over-year growth 2025-2030 (%)

12.3.6 Thailand - Market size and forecast 2025-2030

Chart on Thailand - Market size and forecast 2025-2030 ($ million)
Data Table on Thailand - Market size and forecast 2025-2030 ($ million)
Chart on Thailand - Year-over-year growth 2025-2030 (%)
Data Table on Thailand - Year-over-year growth 2025-2030 (%)

12.4 North America - Market size and forecast 2025-2030

Chart on North America - Market size and forecast 2025-2030 ($ million)
Data Table on North America - Market size and forecast 2025-2030 ($ million)
Chart on North America - Year-over-year growth 2025-2030 (%)
Data Table on North America - Year-over-year growth 2025-2030 (%)
Chart on Regional Comparison - North America
Data Table on Regional Comparison - North America

12.4.1 US - Market size and forecast 2025-2030

Chart on US - Market size and forecast 2025-2030 ($ million)
Data Table on US - Market size and forecast 2025-2030 ($ million)
Chart on US - Year-over-year growth 2025-2030 (%)
Data Table on US - Year-over-year growth 2025-2030 (%)

12.4.2 Canada - Market size and forecast 2025-2030

Chart on Canada - Market size and forecast 2025-2030 ($ million)
Data Table on Canada - Market size and forecast 2025-2030 ($ million)
Chart on Canada - Year-over-year growth 2025-2030 (%)
Data Table on Canada - Year-over-year growth 2025-2030 (%)

12.4.3 Mexico - Market size and forecast 2025-2030

Chart on Mexico - Market size and forecast 2025-2030 ($ million)
Data Table on Mexico - Market size and forecast 2025-2030 ($ million)
Chart on Mexico - Year-over-year growth 2025-2030 (%)
Data Table on Mexico - Year-over-year growth 2025-2030 (%)

12.5 Europe - Market size and forecast 2025-2030

Chart on Europe - Market size and forecast 2025-2030 ($ million)
Data Table on Europe - Market size and forecast 2025-2030 ($ million)
Chart on Europe - Year-over-year growth 2025-2030 (%)
Data Table on Europe - Year-over-year growth 2025-2030 (%)
Chart on Regional Comparison - Europe
Data Table on Regional Comparison - Europe

12.5.1 Germany - Market size and forecast 2025-2030

Chart on Germany - Market size and forecast 2025-2030 ($ million)
Data Table on Germany - Market size and forecast 2025-2030 ($ million)
Chart on Germany - Year-over-year growth 2025-2030 (%)
Data Table on Germany - Year-over-year growth 2025-2030 (%)

12.5.2 Russia - Market size and forecast 2025-2030

Chart on Russia - Market size and forecast 2025-2030 ($ million)
Data Table on Russia - Market size and forecast 2025-2030 ($ million)
Chart on Russia - Year-over-year growth 2025-2030 (%)
Data Table on Russia - Year-over-year growth 2025-2030 (%)

12.5.3 France - Market size and forecast 2025-2030

Chart on France - Market size and forecast 2025-2030 ($ million)
Data Table on France - Market size and forecast 2025-2030 ($ million)
Chart on France - Year-over-year growth 2025-2030 (%)
Data Table on France - Year-over-year growth 2025-2030 (%)

12.5.4 Italy - Market size and forecast 2025-2030

Chart on Italy - Market size and forecast 2025-2030 ($ million)
Data Table on Italy - Market size and forecast 2025-2030 ($ million)
Chart on Italy - Year-over-year growth 2025-2030 (%)
Data Table on Italy - Year-over-year growth 2025-2030 (%)

12.5.5 Poland - Market size and forecast 2025-2030

Chart on Poland - Market size and forecast 2025-2030 ($ million)
Data Table on Poland - Market size and forecast 2025-2030 ($ million)
Chart on Poland - Year-over-year growth 2025-2030 (%)
Data Table on Poland - Year-over-year growth 2025-2030 (%)

12.5.6 UK - Market size and forecast 2025-2030

Chart on UK - Market size and forecast 2025-2030 ($ million)
Data Table on UK - Market size and forecast 2025-2030 ($ million)
Chart on UK - Year-over-year growth 2025-2030 (%)
Data Table on UK - Year-over-year growth 2025-2030 (%)

12.6 South America - Market size and forecast 2025-2030

Chart on South America - Market size and forecast 2025-2030 ($ million)
Data Table on South America - Market size and forecast 2025-2030 ($ million)
Chart on South America - Year-over-year growth 2025-2030 (%)
Data Table on South America - Year-over-year growth 2025-2030 (%)
Chart on Regional Comparison - South America
Data Table on Regional Comparison - South America

12.6.1 Brazil - Market size and forecast 2025-2030

Chart on Brazil - Market size and forecast 2025-2030 ($ million)
Data Table on Brazil - Market size and forecast 2025-2030 ($ million)
Chart on Brazil - Year-over-year growth 2025-2030 (%)
Data Table on Brazil - Year-over-year growth 2025-2030 (%)

12.6.2 Argentina - Market size and forecast 2025-2030

Chart on Argentina - Market size and forecast 2025-2030 ($ million)
Data Table on Argentina - Market size and forecast 2025-2030 ($ million)
Chart on Argentina - Year-over-year growth 2025-2030 (%)
Data Table on Argentina - Year-over-year growth 2025-2030 (%)

12.6.3 Colombia - Market size and forecast 2025-2030

Chart on Colombia - Market size and forecast 2025-2030 ($ million)
Data Table on Colombia - Market size and forecast 2025-2030 ($ million)
Chart on Colombia - Year-over-year growth 2025-2030 (%)
Data Table on Colombia - Year-over-year growth 2025-2030 (%)

12.7 Middle East and Africa - Market size and forecast 2025-2030

Chart on Middle East and Africa - Market size and forecast 2025-2030 ($ million)
Data Table on Middle East and Africa - Market size and forecast 2025-2030 ($ million)
Chart on Middle East and Africa - Year-over-year growth 2025-2030 (%)
Data Table on Middle East and Africa - Year-over-year growth 2025-2030 (%)
Chart on Regional Comparison - Middle East and Africa
Data Table on Regional Comparison - Middle East and Africa

12.7.1 South Africa - Market size and forecast 2025-2030

Chart on South Africa - Market size and forecast 2025-2030 ($ million)
Data Table on South Africa - Market size and forecast 2025-2030 ($ million)
Chart on South Africa - Year-over-year growth 2025-2030 (%)
Data Table on South Africa - Year-over-year growth 2025-2030 (%)

12.7.2 Saudi Arabia - Market size and forecast 2025-2030

Chart on Saudi Arabia - Market size and forecast 2025-2030 ($ million)
Data Table on Saudi Arabia - Market size and forecast 2025-2030 ($ million)
Chart on Saudi Arabia - Year-over-year growth 2025-2030 (%)
Data Table on Saudi Arabia - Year-over-year growth 2025-2030 (%)

12.7.3 UAE - Market size and forecast 2025-2030

Chart on UAE - Market size and forecast 2025-2030 ($ million)
Data Table on UAE - Market size and forecast 2025-2030 ($ million)
Chart on UAE - Year-over-year growth 2025-2030 (%)
Data Table on UAE - Year-over-year growth 2025-2030 (%)

12.7.4 Turkey - Market size and forecast 2025-2030

Chart on Turkey - Market size and forecast 2025-2030 ($ million)
Data Table on Turkey - Market size and forecast 2025-2030 ($ million)
Chart on Turkey - Year-over-year growth 2025-2030 (%)
Data Table on Turkey - Year-over-year growth 2025-2030 (%)

12.7.5 Israel - Market size and forecast 2025-2030

Chart on Israel - Market size and forecast 2025-2030 ($ million)
Data Table on Israel - Market size and forecast 2025-2030 ($ million)
Chart on Israel - Year-over-year growth 2025-2030 (%)
Data Table on Israel - Year-over-year growth 2025-2030 (%)

12.8 Market opportunity by geography

Market opportunity by geography ($ million)
Data Tables on Market opportunity by geography ($ million)

13. Drivers, Challenges, and Opportunity

13.1 Market drivers

Sustained global demand for affordable and healthy protein
Technological integration and pursuit of operational efficiency
Rising demand for convenience and value added products

13.2 Market challenges

Pervasive threat of highly pathogenic avian influenza
Volatility of feed prices and input costs
Intensifying regulatory and consumer demands for sustainability and animal welfare

13.3 Impact of drivers and challenges

Impact of drivers and challenges in 2025 and 2030

13.4 Market opportunities

Accelerated adoption of sustainability and circular economy principles
Deepening integration of digitalization for supply chain transparency and resilience
Strategic product innovation focused on health, wellness, and niche consumer segments

14. Competitive Landscape

14.1 Overview

14.2

Overview on criticality of inputs and factors of differentiation

14.3 Landscape disruption

Overview on factors of disruption

14.4 Industry risks

Impact of key risks on business

15. Competitive Analysis

15.1 Companies profiled

Companies covered

15.2 Company ranking index

15.3 Market positioning of companies

Matrix on companies position and classification

15.4 Acolid

Acolid - Overview
Acolid - Product / Service
Acolid - Key offerings
SWOT

15.5 BRF SA

BRF SA - Overview
BRF SA - Product / Service
BRF SA - Key offerings
SWOT

15.6 Cargill Inc.

Cargill Inc. - Overview
Cargill Inc. - Product / Service
Cargill Inc. - Key offerings
SWOT

15.7 Charoen Pokphand Foods

Charoen Pokphand Foods - Overview
Charoen Pokphand Foods - Business segments
Charoen Pokphand Foods - Key offerings
Charoen Pokphand Foods - Segment focus
SWOT

15.8 Fujian Sunner Development

Fujian Sunner Development - Overview
Fujian Sunner Development - Product / Service
Fujian Sunner Development - Key offerings
SWOT

15.9 JAPFA LTD

JAPFA LTD - Overview
JAPFA LTD - Product / Service
JAPFA LTD - Key offerings
SWOT

15.10 JBS SA

JBS SA - Overview
JBS SA - Product / Service
JBS SA - Key offerings
SWOT

15.11 KOCH FOODS INC.

KOCH FOODS INC. - Overview
KOCH FOODS INC. - Product / Service
KOCH FOODS INC. - Key offerings
SWOT

15.12 LDC Group

LDC Group - Overview
LDC Group - Product / Service
LDC Group - Key offerings
SWOT

15.13 New Hope Liuhe Co. Ltd.

New Hope Liuhe Co. Ltd. - Overview
New Hope Liuhe Co. Ltd. - Product / Service
New Hope Liuhe Co. Ltd. - Key offerings
SWOT

15.14 Plukon Food Group BV

Plukon Food Group BV - Overview
Plukon Food Group BV - Product / Service
Plukon Food Group BV - Key offerings
SWOT

15.15 San Miguel Corp.

San Miguel Corp. - Overview
San Miguel Corp. - Product / Service
San Miguel Corp. - Key offerings
SWOT

15.16 Tyson Foods Inc.

Tyson Foods Inc. - Overview
Tyson Foods Inc. - Business segments
Tyson Foods Inc. - Key news
Tyson Foods Inc. - Key offerings
Tyson Foods Inc. - Segment focus
SWOT

15.17 Wayne Sanderson Farms

Wayne Sanderson Farms - Overview
Wayne Sanderson Farms - Product / Service
Wayne Sanderson Farms - Key offerings
SWOT

15.18 Wens Foodstuff Group

Wens Foodstuff Group - Overview
Wens Foodstuff Group - Product / Service
Wens Foodstuff Group - Key offerings
SWOT

16. Appendix

16.1 Scope of the report

Market definition
Objectives
Notes and caveats

16.2 Inclusions and exclusions checklist

Inclusions checklist
Exclusions checklist

16.3 Currency conversion rates for US$

16.4 Research methodology

16.5 Data procurement

Information sources

16.6 Data validation

16.7 Validation techniques employed for market sizing

16.8 Data synthesis

16.9 360 degree market analysis

16.10 List of abbreviations

Research Methodology

Technavio presents a detailed picture of the market by way of study, synthesis, and summation of data from multiple sources. The analysts have presented the various facets of the market with a particular focus on identifying the key industry influencers. The data thus presented is comprehensive, reliable, and the result of extensive research, both primary and secondary.

INFORMATION SOURCES

Primary sources

  • Manufacturers and suppliers
  • Channel partners
  • Industry experts
  • Strategic decision makers

Secondary sources

  • Industry journals and periodicals
  • Government data
  • Financial reports of key industry players
  • Historical data
  • Press releases

DATA ANALYSIS

Data Synthesis

  • Collation of data
  • Estimation of key figures
  • Analysis of derived insights

Data Validation

  • Triangulation with data models
  • Reference against proprietary databases
  • Corroboration with industry experts

REPORT WRITING

Qualitative

  • Market drivers
  • Market challenges
  • Market trends
  • Five forces analysis

Quantitative

  • Market size and forecast
  • Market segmentation
  • Geographical insights
  • Competitive landscape

Interested in this report?

Get your sample now to see our research methodology and insights!

Download Now

Frequently Asked Questions

Poultry Meat market growth will increase by USD 70352.9 million during 2026-2030 .

The Poultry Meat market is expected to grow at a CAGR of 3.1% during 2026-2030 .

Poultry Meat market is segmented by Type (Chicken meat, Turkey meat, Duck meat, Others) Distribution channel (Offline, Online) Product (Frozen poultry meat, Fresh poultry meat, Processed poultry meat)

Acolid, BRF SA, Cargill Inc., Charoen Pokphand Foods, Fujian Sunner Development, Industrias Bachoco S.A., JAPFA LTD, JBS SA, KOCH FOODS INC., LDC Group, Lihua Foods Group, MHP SE, New Hope Liuhe Co. Ltd., Perdue Farms, Plukon Food Group BV, San Miguel Corp., Suguna Foods Pvt. Ltd., Tyson Foods Inc., Wayne Sanderson Farms, Wens Foodstuff Group are a few of the key vendors in the Poultry Meat market.

APAC will register the highest growth rate of 54.4% among the other regions. Therefore, the Poultry Meat market in APAC is expected to garner significant business opportunities for the vendors during the forecast period.

China, India, Indonesia, Japan, Vietnam, Thailand, US, Canada, Mexico, Germany, Russia, France, Italy, Poland, UK, Brazil, Argentina, Colombia, South Africa, Saudi Arabia, UAE, Turkey, Israel

  • Sustained global demand for affordable and healthy protein is the driving factor this market.

The Poultry Meat market vendors should focus on grabbing business opportunities from the Type segment as it accounted for the largest market share in the base year.