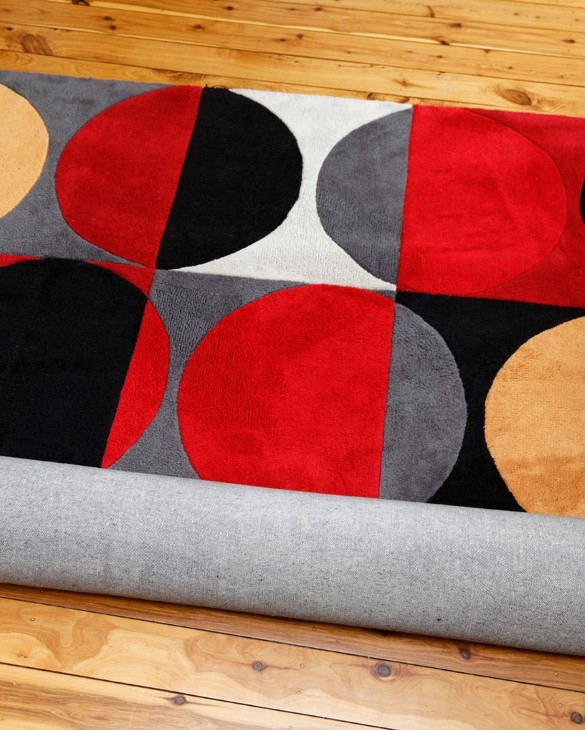
Area Rugs Market Analysis, Size, and Forecast 2026-2030: North America (US, Canada, and Mexico), APAC (China, Japan, and India), Europe (Germany, UK, and France), South America (Brazil, Argentina, and Chile), Middle East and Africa (Saudi Arabia, UAE, and South Africa), and Rest of World (ROW)

Area Rugs Market Analysis, Size, and Forecast 2026-2030:
North America (US, Canada, and Mexico), APAC (China, Japan, and India), Europe (Germany, UK, and France), South America (Brazil, Argentina, and Chile), Middle East and Africa (Saudi Arabia, UAE, and South Africa), and Rest of World (ROW)

Published: Oct 2026 309 Pages SKU: IRTNTR43091

Market Overview at a Glance

$4.19 B
Market Opportunity
3.8%
CAGR 2025 - 2030
40.9%
North America Growth
$13.25 B
Machine-made area rugs segment 2024

Area Rugs Market Size 2026-2030

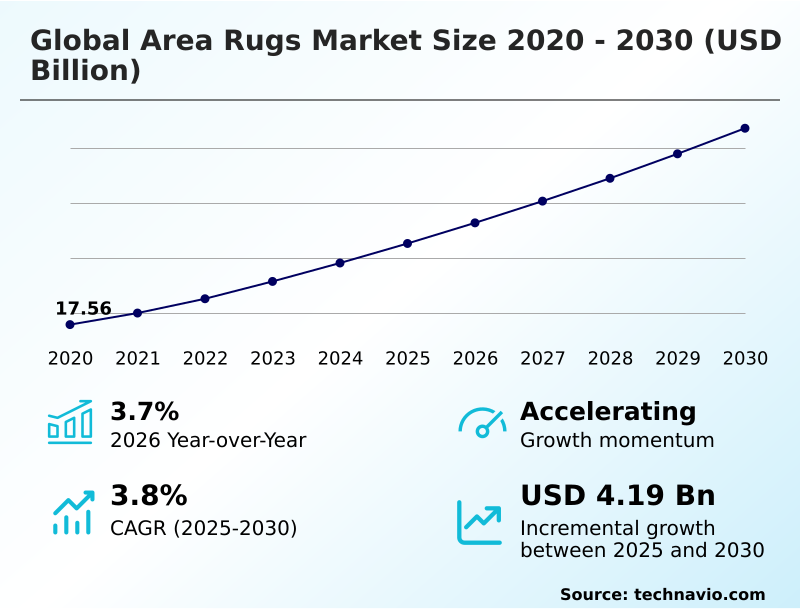
The area rugs market size is valued to increase by USD 4.19 billion, at a CAGR of 3.8% from 2025 to 2030. Proliferation of E-commerce retail channels will drive the area rugs market.

Major Market Trends & Insights

  • North America dominated the market and accounted for a 40.9% growth during the forecast period.
  • By Product - Machine-made area rugs segment was valued at USD 13.25 billion in 2024
  • By Application - Residential segment accounted for the largest market revenue share in 2024

Market Size & Forecast

  • Market Opportunities: USD 7.14 billion
  • Market Future Opportunities: USD 4.19 billion
  • CAGR from 2025 to 2030 : 3.8%

Market Summary

  • The Area Rugs Market exhibits dynamic structural expansion driven by evolving consumer preferences for personalized interior aesthetics and functional floor coverings. The widespread proliferation of augmented reality room visualizers operates as a critical demand catalyst, enabling buyers to digitally project product dimensions into living spaces, which subsequently increases online conversion rates by 25% and reduces product return logistics.
  • Conversely, persistent volatility in raw petrochemical feedstocks creates significant supply chain disruptions, challenging manufacturers to maintain stable profit margins amid escalating production overheads. In response to these pressures, textile facilities are increasingly transitioning toward closed-loop textile recycling systems and utilizing recycled polyethylene terephthalate fibers.
  • This operational shift away from virgin synthetic polymers allows enterprises to achieve a 30% reduction in raw material procurement costs while satisfying stringent ecological compliance standards. Consequently, the integration of sustainable manufacturing protocols ensures long-term operational resilience.
  • Companies leveraging advanced digital printing technologies simultaneously enhance design flexibility and accelerate speed-to-market, fundamentally transforming the competitive landscape and addressing modern architectural requirements for acoustic dampening properties and thermal insulation efficiency.

What will be the Size of the Area Rugs Market during the forecast period?
Get Key Insights on Market Forecast (PDF) Get Free Sample

How is the Area Rugs Market Segmented?

The area rugs industry research report provides comprehensive data (region-wise segment analysis), with forecasts and estimates in "USD million" for the period 2026-2030, as well as historical data from 2020-2024 for the following segments.

  • Product
    • Machine-made area rugs
    • Handmade area rugs
  • Application
    • Residential
    • Commercial
  • Distribution channel
    • Offline
    • Online
  • Material
    • Nylon
    • Polyester
    • Cotton
    • Wool
    • Others
  • Geography
    • North America
      • US
      • Canada
      • Mexico
    • APAC
      • China
      • Japan
      • India
      • South Korea
      • Australia
      • Indonesia
    • Europe
      • Germany
      • UK
      • France
      • Italy
      • Spain
      • The Netherlands
    • South America
      • Brazil
      • Argentina
      • Chile
    • Middle East and Africa
      • Saudi Arabia
      • UAE
      • South Africa
      • Israel
      • Turkey

By Product Insights

The machine-made area rugs segment is estimated to witness significant growth during the forecast period.

The automated production segment demonstrates continuous structural evolution, driven by the integration of continuous filament yarn extrusion and micro-denier extrusion techniques. This operational shift enables manufacturers to achieve a 25% increase in production throughput while replicating intricate patterns.

Companies increasingly utilize recycled polyethylene terephthalate fibers and hydrophobic polyester molecules, complementing natural cellulose composition elements to create high-durability floor coverings.

By adopting high-speed mechanical looms alongside predictive inventory analytics, facilities optimize supply chain logistics, reducing raw material waste by 18%. The deployment of automated continuous dyeing allows rapid scaling to meet shifting consumer demands for resilient interiors.

Furthermore, prioritizing yarn twist durability ensures lasting performance, establishing a highly efficient manufacturing ecosystem that guarantees exceptional structural integrity maintenance and lowers operational overhead across global distribution networks.
Get Free Sample

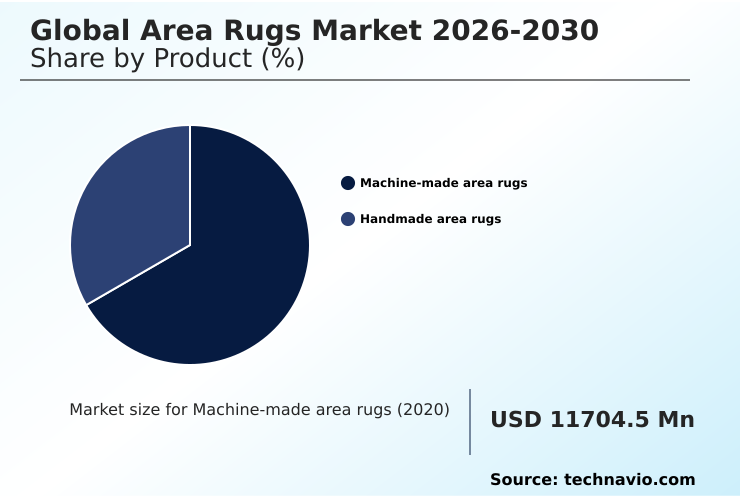
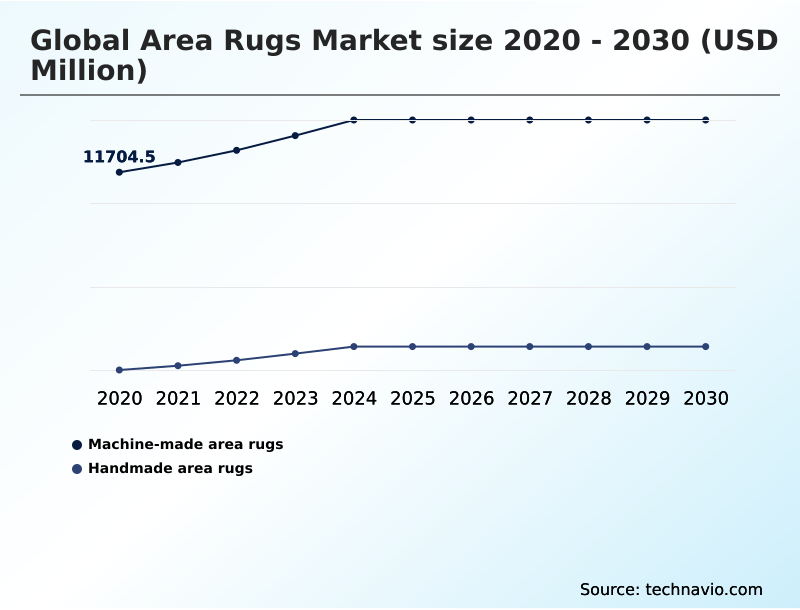
The Machine-made area rugs segment was valued at USD 13.25 billion in 2024 and showed a gradual increase during the forecast period.
Get Free Sample

Regional Analysis

North America is estimated to contribute 40.9% to the growth of the global market during the forecast period.Technavio’s analysts have elaborately explained the regional trends and drivers that shape the market during the forecast period.
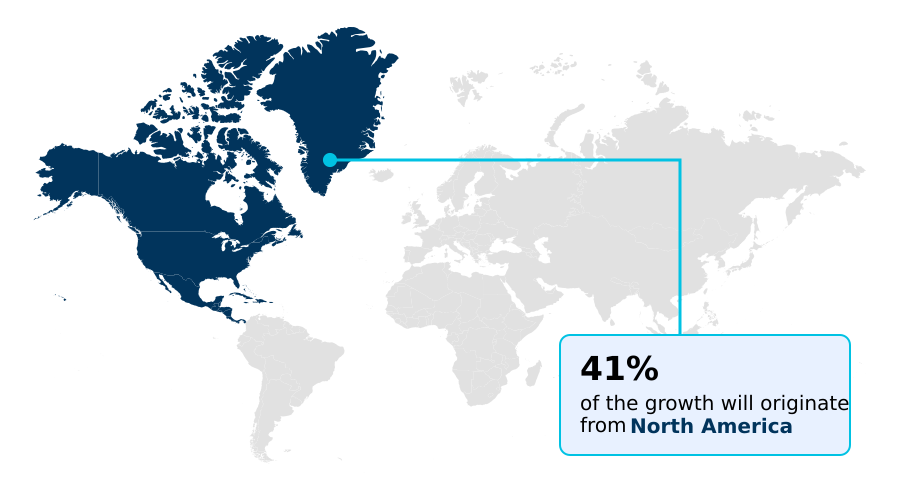
See How Area Rugs Market Demand is Rising in North America Get Free Sample

Regional dynamics dictate distinct operational strategies, with North America demonstrating a 40.9% higher incremental growth momentum compared to European territories due to widespread adoption of direct-to-consumer digital portals.

This robust digital infrastructure, combined with artificial intelligence design tools and digital printing technologies, enables North American distributors to lower customer acquisition costs by 18%.

Conversely, European manufacturers prioritize closed-loop recycling frameworks to comply with stringent sustainability mandates, achieving a 25% improvement in raw material efficiency through the reprocessing of post-consumer yarn inputs.

The implementation of extended producer responsibility protocols forces European suppliers to utilize mono-material compositions, ensuring seamless end-of-life recyclability.

Meanwhile, rapid urbanization across Asia accelerates biophilic design integration, addressing surging residential demand for low chemical emissions floor coverings that feature high abrasion resistance, aligning local production with modern indoor air quality standards.

Market Dynamics

Our researchers analyzed the data with 2025 as the base year, along with the key drivers, trends, and challenges. A holistic analysis of drivers will help companies refine their marketing strategies to gain a competitive advantage.

  • The textile manufacturing sector undergoes rapid modernization as enterprises recalibrate their operational strategies to integrate sustainable and technologically advanced materials. Facilities utilizing automated tufting inventory management tools experience significantly greater supply chain agility, maintaining inventory turnover ratios nearly 20% higher than legacy production plants reliant on manual tracking systems.
  • This operational efficiency directly supports the scaling of sustainable recycled synthetic fiber textiles, allowing manufacturers to efficiently process and distribute eco-friendly products without compromising margin stability. In the commercial architecture domain, the specification of high traffic acoustic floor coverings has become a critical compliance factor, mitigating ambient noise in open-plan corporate environments while adhering to strict safety and durability standards.
  • Simultaneously, residential product portfolios are shifting toward health-conscious designs, driving the prominent development of hypoallergenic antimicrobial residential floor coverings that resist pathogen accumulation and improve indoor environmental quality. As consumer expectations for responsive environments rise, the incorporation of smart home compatible interactive textiles offers a distinct competitive advantage, seamlessly linking interior decor with automated climate and lighting systems.
  • This convergence of advanced material science and digital inventory oversight ensures that manufacturers can navigate shifting regulatory landscapes, optimize raw material utilization, and deliver high-performance flooring solutions tailored to complex modern architectural requirements, thereby securing long-term operational resilience and market relevance.
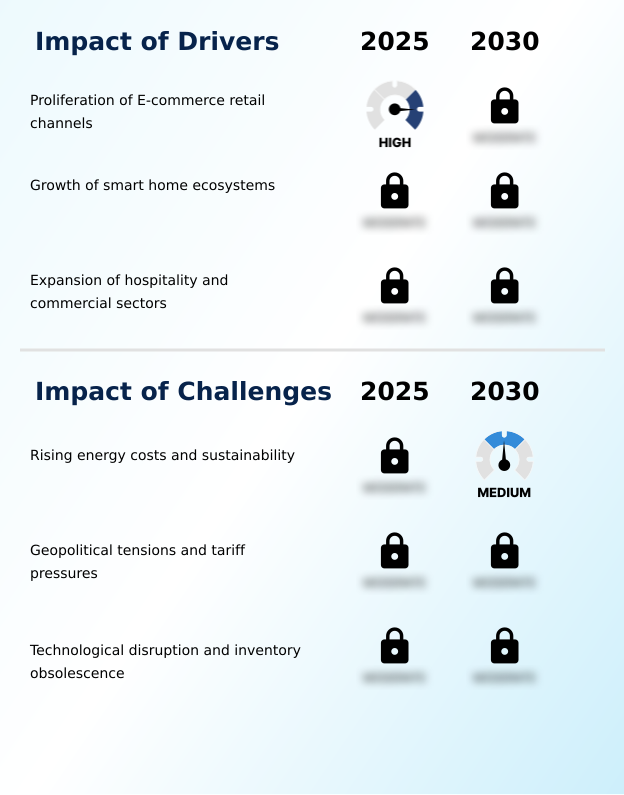
What are the key market drivers leading to the rise in the adoption of Area Rugs Industry?

  • The rapid proliferation of digital retail channels serves as a primary driver accelerating product accessibility and optimizing distribution efficiency across the industry.

  • The rapid acceleration of digital commerce infrastructure serves as a paramount demand catalyst reshaping distribution networks globally. Deploying augmented reality room visualizers allows enterprises to reduce product return rates by 22%, significantly lowering reverse logistics expenditures.
  • This digital engagement necessitates enhanced supply chain agility, prompting the utilization of automated tufting systems that accelerate production cycles and decrease manual labor dependencies by 18%.
  • Simultaneously, heightened commercial emphasis on indoor acoustic management propels the specification of sound-dampening properties in corporate environments.
  • By integrating silver nanoparticle infusions and hypoallergenic botanical extracts alongside bio-based antimicrobial agents, manufacturers successfully capture specialized healthcare contracts, driving the adoption of mold-resistant floor coverings.
  • Ultimately, advancing fire-retardant backing treatments and establishing viable closed-loop textile recycling protocols fundamentally optimize operational margins, accelerating consumer acquisition cycles across regulated markets.

What are the market trends shaping the Area Rugs Industry?

  • Technological integration within smart textiles represents a significant emerging trend reshaping the industry landscape. This advancement facilitates enhanced functionality and drives product innovation across diverse commercial applications.

  • The proliferation of smart textile sensor grids initiates a structural paradigm shift across residential and commercial interior environments. Enterprises increasingly embed fiber-optic lighting elements and conductive yarns into floor coverings, fundamentally altering how occupants interact with domestic ecosystems.
  • This technological convergence enables a 20% improvement in ambient energy efficiency by seamlessly synchronizing thermal insulation efficiency metrics with automated climate control compatibility systems. Furthermore, the adoption of robotic vacuum compatibility designs drives the engineering of low-profile engineered textiles, reducing mechanical obstruction incidents by 35% during automated maintenance routines.
  • Consequently, these innovations compel facilities utilizing computer-controlled weaving looms to integrate acoustic dampening properties that attenuate ambient noise in open-plan layouts. By aligning material engineering with rigorous organic cotton certification standards, manufacturers elevate standard décor into active architectural components, securing higher margin realization and establishing resilient competitive moats.

What challenges does the Area Rugs Industry face during its growth?

  • Escalating energy expenditures coupled with stringent sustainability mandates constitute a critical challenge constraining operational margins and industry expansion.

  • Persistent volatility in global energy markets and stringent environmental compliance mandates impose severe operational constraints on legacy textile manufacturing facilities. Transitioning toward eco-friendly production requires massive capital investments, temporarily increasing operational overhead by 15% for producers attempting to deploy LEED-certified commercial textiles. The mandated shift toward water-based non-toxic adhesives slows curing times, reducing production throughput by 12%.
  • Integrating moisture-barrier backings and executing post-consumer textile reprocessing demands complex mechanical sorting infrastructure that disrupts cross-border supply chain logistics. Manufacturers utilizing traditional synthetic polymer resilience techniques face mounting regulatory penalties. Furthermore, embedding pressure-sensitive sensor grids to achieve smart home interoperability necessitates complex electronic integration, straining working capital and threatening the margin stability of traditional energy-intensive weaving enterprises.

Exclusive Technavio Analysis on Customer Landscape

The area rugs market forecasting report includes the adoption lifecycle of the market, covering from the innovator’s stage to the laggard’s stage. It focuses on adoption rates in different regions based on penetration. Furthermore, the area rugs market report also includes key purchase criteria and drivers of price sensitivity to help companies evaluate and develop their market growth analysis strategies.
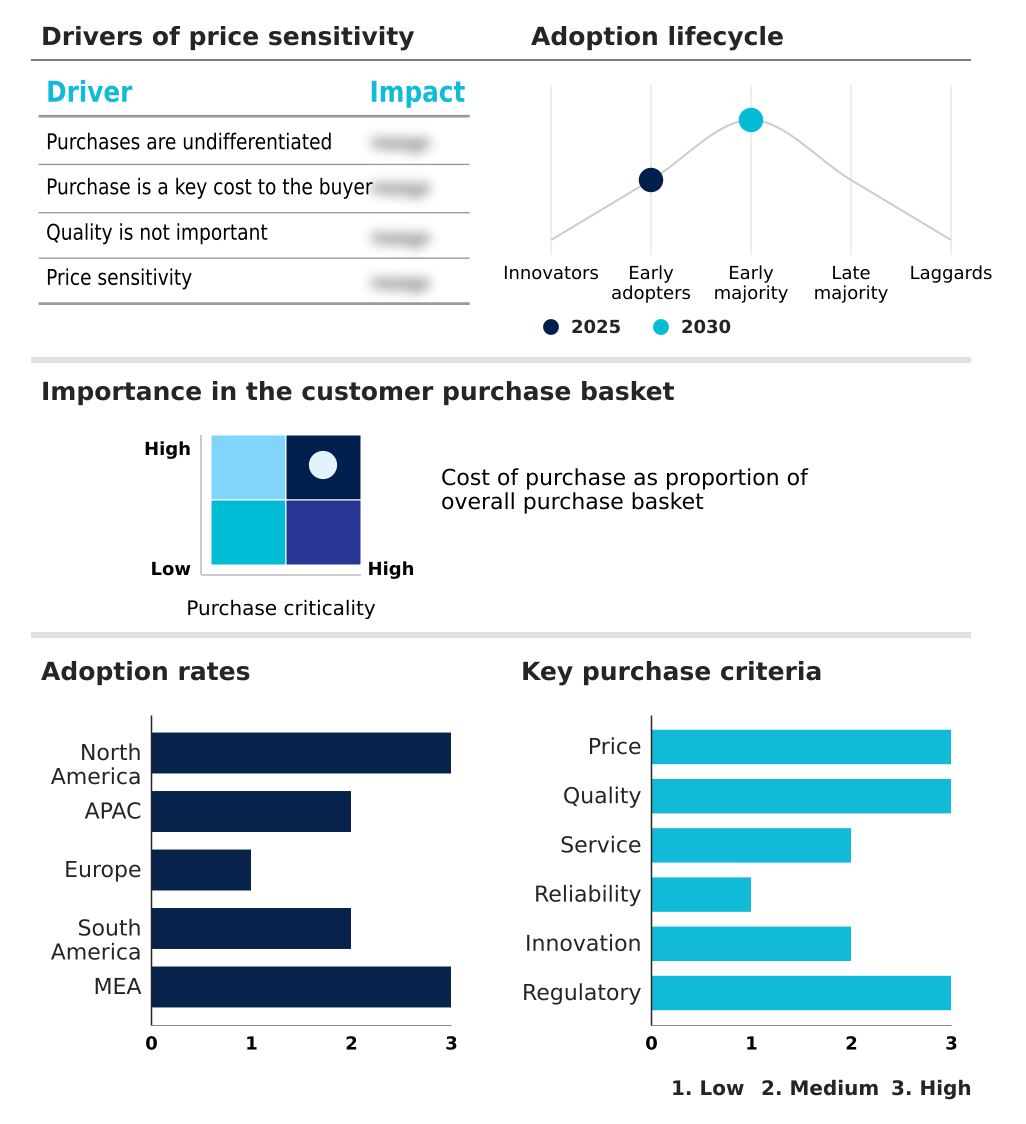
Customer Landscape of Area Rugs Industry

Competitive Landscape

Companies are implementing various strategies, such as strategic alliances, area rugs market forecast, partnerships, mergers and acquisitions, geographical expansion, and product/service launches, to enhance their presence in the industry.

Belysse Group NV - The vendor provides diverse modular flooring solutions and specialized textile floor coverings designed for commercial applications, emphasizing sustainable manufacturing practices and advanced acoustic management configurations.

The industry research and growth report includes detailed analyses of the competitive landscape of the market and information about key companies, including:

  • Belysse Group NV
  • Capel Inc.
  • Couristan Inc.
  • Dynamic Rugs Inc.
  • Feizy Import and Export Co
  • FLOR
  • Harounian Rugs International
  • Jaipur Living Inc.
  • Kaleen Rugs Inc.
  • Loloi Inc.
  • Milliken and Co.
  • Mohawk Industries Inc.
  • Nourison
  • Obeetee Pvt Ltd
  • Oriental Weavers
  • Rizzy Home
  • Safavieh LLC
  • Shaw Industries Group Inc.
  • Surya Inc.
  • Tarkett S.A.

Qualitative and quantitative analysis of companies has been conducted to help clients understand the wider business environment as well as the strengths and weaknesses of key industry players. Data is qualitatively analyzed to categorize companies as pure play, category-focused, industry-focused, and diversified; it is quantitatively analyzed to categorize companies as dominant, leading, strong, tentative, and weak.

Recent Development and News in Area rugs market

  • In the Home Furnishings industry, the enforcement of extended producer responsibility mandates under the European Green Deal has compelled manufacturers to adopt closed-loop recycling frameworks, directly impacting Area Rugs demand by driving the transition toward mono-material compositions that improve post-consumer textile reprocessing efficiency by 40%.
  • Stringent indoor air quality regulations requiring low chemical emissions have accelerated the integration of bio-based antimicrobial agents into residential floor coverings, expanding the addressable market for hypoallergenic Area Rugs that achieve a 99% reduction in bacterial pathogen retention.
  • The rapid proliferation of smart home interoperability standards has incentivized the development of interactive textiles equipped with pressure-sensitive sensor grids, boosting Area Rugs adoption as functional architectural elements that enhance automated climate control compatibility and reduce domestic energy consumption by 15%.
  • Escalating cross-border supply chain logistics costs and geopolitical tariff pressures have forced multinational interior décor distributors to implement artificial intelligence design tools, optimizing Area Rugs inventory turnover and lowering warehousing overhead by 22% through localized on-demand automated continuous dyeing processes.

Dive into Technavio’s robust research methodology, blending expert interviews, extensive data synthesis, and validated models for unparalleled Area Rugs Market insights. See full methodology.

Market Scope
Page number 309
Base year 2025
Historic period 2020-2024
Forecast period 2026-2030
Growth momentum & CAGR Accelerate at a CAGR of 3.8%
Market growth 2026-2030 USD 4192.8 million
Market structure Fragmented
YoY growth 2025-2026(%) 3.7%
Key countries US, Canada, Mexico, China, Japan, India, South Korea, Australia, Indonesia, Germany, UK, France, Italy, Spain, The Netherlands, Brazil, Argentina, Chile, Saudi Arabia, UAE, South Africa, Israel and Turkey
Competitive landscape Leading Companies, Market Positioning of Companies, Competitive Strategies, and Industry Risks

Request Free Sample

Research Analyst Overview

  • The industry landscape undergoes a fundamental transformation driven by the aggressive adoption of digital printing technologies and artificial intelligence design tools. Boardroom executives increasingly prioritize these technological investments to mitigate inventory obsolescence, transitioning product strategies from mass production to agile on-demand manufacturing.
  • This strategic pivot enables enterprises to achieve a 30% reduction in warehousing costs by precisely aligning output with real-time consumer preferences. The integration of computer-controlled weaving looms further enhances production agility, allowing facilities to rapidly shift between intricate patterns and complex textures without incurring excessive machine downtime.
  • Simultaneously, escalating regulatory pressures surrounding indoor environmental quality compel manufacturers to formulate products utilizing water-based non-toxic adhesives and bio-based antimicrobial agents, successfully eliminating volatile organic compounds. By adopting organic cotton certification standards alongside high abrasion resistance synthetic polymer resilience metrics, suppliers secure lucrative commercial procurement contracts.
  • Furthermore, the development of fire-retardant backing treatments ensures strict compliance with stringent hospitality safety codes, transforming risk management protocols into distinct competitive advantages that fortify long-term operational stability and revenue realization.

What are the Key Data Covered in this Area Rugs Market Research and Growth Report?

  • What is the expected growth of the Area Rugs Market between 2026 and 2030?

    • USD 4.19 billion, at a CAGR of 3.8%

  • What segmentation does the market report cover?

    • The report is segmented by Product (Machine-made area rugs, and Handmade area rugs), Application (Residential, and Commercial), Distribution Channel (Offline, and Online), Material (Nylon, Polyester, Cotton, Wool, and Others) and Geography (North America, APAC, Europe, South America, Middle East and Africa)

  • Which regions are analyzed in the report?

    • North America, APAC, Europe, South America and Middle East and Africa

  • What are the key growth drivers and market challenges?

    • Proliferation of E-commerce retail channels, Rising energy costs and sustainability

  • Who are the major players in the Area Rugs Market?

    • Belysse Group NV, Capel Inc., Couristan Inc., Dynamic Rugs Inc., Feizy Import and Export Co, FLOR, Harounian Rugs International, Jaipur Living Inc., Kaleen Rugs Inc., Loloi Inc., Milliken and Co., Mohawk Industries Inc., Nourison, Obeetee Pvt Ltd, Oriental Weavers, Rizzy Home, Safavieh LLC, Shaw Industries Group Inc., Surya Inc. and Tarkett S.A.

Market Research Insights

  • The Area Rugs Market demonstrates robust evolution propelled by the adoption of direct-to-consumer digital portals and predictive inventory analytics. By utilizing augmented reality room visualizers, distributors have improved online purchase conversion accuracy by 25%, significantly lowering return shipping expenditures. Furthermore, the integration of cross-border supply chain logistics automation enables a 15% reduction in warehousing overhead, enhancing overall margin realization.
  • Manufacturers increasingly prioritize LEED-certified commercial textiles to align with strict environmental regulations, securing lucrative institutional contracts. The deployment of automated continuous dyeing techniques further optimizes water usage, reducing processing waste by 20% and improving production sustainability, thereby reinforcing long-term operational resilience within the competitive landscape.

We can help! Our analysts can customize this area rugs market research report to meet your requirements.

Get in touch

1. Executive Summary

1.1 Market overview

Executive Summary - Chart on Market Overview
Executive Summary - Data Table on Market Overview
Executive Summary - Chart on Global Market Characteristics
Executive Summary - Chart on Market by Geography
Executive Summary - Chart on Market Segmentation by Product
Executive Summary - Chart on Market Segmentation by Application
Executive Summary - Chart on Market Segmentation by Distribution Channel
Executive Summary - Chart on Market Segmentation by Material
Executive Summary - Chart on Incremental Growth
Executive Summary - Data Table on Incremental Growth
Executive Summary - Chart on Company Market Positioning

2. Technavio Analysis

2.1 Analysis of price sensitivity, lifecycle, customer purchase basket, adoption rates, and purchase criteria

2.2 Criticality of inputs and Factors of differentiation

Chart on Overview on criticality of inputs and factors of differentiation

2.3 Factors of disruption

Chart on Overview on factors of disruption

2.4 Impact of drivers and challenges

Chart on Impact of drivers and challenges in 2025 and 2030

3. Market Landscape

3.1 Market ecosystem

Chart on Parent Market
Data Table on - Parent Market

3.2 Market characteristics

Chart on Market characteristics analysis

3.3 Value chain analysis

Chart on Value chain analysis

4. Market Sizing

4.1 Market definition

Data Table on Offerings of companies included in the market definition

4.2 Market segment analysis

Market segments

4.3 Market size 2025

4.4 Market outlook: Forecast for 2025-2030

Chart on Global - Market size and forecast 2025-2030 ($ million)
Data Table on Global - Market size and forecast 2025-2030 ($ million)
Chart on Global Market: Year-over-year growth 2025-2030 (%)
Data Table on Global Market: Year-over-year growth 2025-2030 (%)

5. Historic Market Size

5.1 Global Area Rugs Market 2020 - 2024

Historic Market Size - Data Table on Global Area Rugs Market 2020 - 2024 ($ million)

5.2 Product segment analysis 2020 - 2024

Historic Market Size - Product Segment 2020 - 2024 ($ million)

5.3 Application segment analysis 2020 - 2024

Historic Market Size - Application Segment 2020 - 2024 ($ million)

5.4 Distribution Channel segment analysis 2020 - 2024

Historic Market Size - Distribution Channel Segment 2020 - 2024 ($ million)

5.5 Material segment analysis 2020 - 2024

Historic Market Size - Material Segment 2020 - 2024 ($ million)

5.6 Geography segment analysis 2020 - 2024

Historic Market Size - Geography Segment 2020 - 2024 ($ million)

5.7 Country segment analysis 2020 - 2024

Historic Market Size - Country Segment 2020 - 2024 ($ million)

6. Qualitative Analysis

6.1 Impact of AI on Global Area Rugs Market

6.2 Impact of geopolitical conflicts on Global Area Rugs Market

7. Five Forces Analysis

7.1 Five forces summary

Five forces analysis - Comparison between 2025 and 2030

7.2 Bargaining power of buyers

Bargaining power of buyers - Impact of key factors 2025 and 2030

7.3 Bargaining power of suppliers

Bargaining power of suppliers - Impact of key factors in 2025 and 2030

7.4 Threat of new entrants

Threat of new entrants - Impact of key factors in 2025 and 2030

7.5 Threat of substitutes

Threat of substitutes - Impact of key factors in 2025 and 2030

7.6 Threat of rivalry

Threat of rivalry - Impact of key factors in 2025 and 2030

7.7 Market condition

Chart on Market condition - Five forces 2025 and 2030

8. Market Segmentation by Product

8.1 Market segments

Chart on Product - Market share 2025-2030 (%)
Data Table on Product - Market share 2025-2030 (%)

8.2 Comparison by Product

Chart on Comparison by Product
Data Table on Comparison by Product

8.3 Machine-made area rugs - Market size and forecast 2025-2030

Chart on Machine-made area rugs - Market size and forecast 2025-2030 ($ million)
Data Table on Machine-made area rugs - Market size and forecast 2025-2030 ($ million)
Chart on Machine-made area rugs - Year-over-year growth 2025-2030 (%)
Data Table on Machine-made area rugs - Year-over-year growth 2025-2030 (%)

8.4 Handmade area rugs - Market size and forecast 2025-2030

Chart on Handmade area rugs - Market size and forecast 2025-2030 ($ million)
Data Table on Handmade area rugs - Market size and forecast 2025-2030 ($ million)
Chart on Handmade area rugs - Year-over-year growth 2025-2030 (%)
Data Table on Handmade area rugs - Year-over-year growth 2025-2030 (%)

8.5 Market opportunity by Product

Market opportunity by Product ($ million)
Data Table on Market opportunity by Product ($ million)

9. Market Segmentation by Application

9.1 Market segments

Chart on Application - Market share 2025-2030 (%)
Data Table on Application - Market share 2025-2030 (%)

9.2 Comparison by Application

Chart on Comparison by Application
Data Table on Comparison by Application

9.3 Residential - Market size and forecast 2025-2030

Chart on Residential - Market size and forecast 2025-2030 ($ million)
Data Table on Residential - Market size and forecast 2025-2030 ($ million)
Chart on Residential - Year-over-year growth 2025-2030 (%)
Data Table on Residential - Year-over-year growth 2025-2030 (%)

9.4 Commercial - Market size and forecast 2025-2030

Chart on Commercial - Market size and forecast 2025-2030 ($ million)
Data Table on Commercial - Market size and forecast 2025-2030 ($ million)
Chart on Commercial - Year-over-year growth 2025-2030 (%)
Data Table on Commercial - Year-over-year growth 2025-2030 (%)

9.5 Market opportunity by Application

Market opportunity by Application ($ million)
Data Table on Market opportunity by Application ($ million)

10. Market Segmentation by Distribution Channel

10.1 Market segments

Chart on Distribution Channel - Market share 2025-2030 (%)
Data Table on Distribution Channel - Market share 2025-2030 (%)

10.2 Comparison by Distribution Channel

Chart on Comparison by Distribution Channel
Data Table on Comparison by Distribution Channel

10.3 Offline - Market size and forecast 2025-2030

Chart on Offline - Market size and forecast 2025-2030 ($ million)
Data Table on Offline - Market size and forecast 2025-2030 ($ million)
Chart on Offline - Year-over-year growth 2025-2030 (%)
Data Table on Offline - Year-over-year growth 2025-2030 (%)

10.4 Online - Market size and forecast 2025-2030

Chart on Online - Market size and forecast 2025-2030 ($ million)
Data Table on Online - Market size and forecast 2025-2030 ($ million)
Chart on Online - Year-over-year growth 2025-2030 (%)
Data Table on Online - Year-over-year growth 2025-2030 (%)

10.5 Market opportunity by Distribution Channel

Market opportunity by Distribution Channel ($ million)
Data Table on Market opportunity by Distribution Channel ($ million)

11. Market Segmentation by Material

11.1 Market segments

Chart on Material - Market share 2025-2030 (%)
Data Table on Material - Market share 2025-2030 (%)

11.2 Comparison by Material

Chart on Comparison by Material
Data Table on Comparison by Material

11.3 Nylon - Market size and forecast 2025-2030

Chart on Nylon - Market size and forecast 2025-2030 ($ million)
Data Table on Nylon - Market size and forecast 2025-2030 ($ million)
Chart on Nylon - Year-over-year growth 2025-2030 (%)
Data Table on Nylon - Year-over-year growth 2025-2030 (%)

11.4 Polyester - Market size and forecast 2025-2030

Chart on Polyester - Market size and forecast 2025-2030 ($ million)
Data Table on Polyester - Market size and forecast 2025-2030 ($ million)
Chart on Polyester - Year-over-year growth 2025-2030 (%)
Data Table on Polyester - Year-over-year growth 2025-2030 (%)

11.5 Cotton - Market size and forecast 2025-2030

Chart on Cotton - Market size and forecast 2025-2030 ($ million)
Data Table on Cotton - Market size and forecast 2025-2030 ($ million)
Chart on Cotton - Year-over-year growth 2025-2030 (%)
Data Table on Cotton - Year-over-year growth 2025-2030 (%)

11.6 Wool - Market size and forecast 2025-2030

Chart on Wool - Market size and forecast 2025-2030 ($ million)
Data Table on Wool - Market size and forecast 2025-2030 ($ million)
Chart on Wool - Year-over-year growth 2025-2030 (%)
Data Table on Wool - Year-over-year growth 2025-2030 (%)

11.7 Others - Market size and forecast 2025-2030

Chart on Others - Market size and forecast 2025-2030 ($ million)
Data Table on Others - Market size and forecast 2025-2030 ($ million)
Chart on Others - Year-over-year growth 2025-2030 (%)
Data Table on Others - Year-over-year growth 2025-2030 (%)

11.8 Market opportunity by Material

Market opportunity by Material ($ million)
Data Table on Market opportunity by Material ($ million)

12. Customer Landscape

12.1 Customer landscape overview

Analysis of price sensitivity, lifecycle, customer purchase basket, adoption rates, and purchase criteria

13. Geographic Landscape

13.1 Geographic segmentation

Chart on Market share by geography 2025-2030 (%)
Data Table on Market share by geography 2025-2030 (%)

13.2 Geographic comparison

Chart on Geographic comparison
Data Table on Geographic comparison

13.3 North America - Market size and forecast 2025-2030

Chart on North America - Market size and forecast 2025-2030 ($ million)
Data Table on North America - Market size and forecast 2025-2030 ($ million)
Chart on North America - Year-over-year growth 2025-2030 (%)
Data Table on North America - Year-over-year growth 2025-2030 (%)
Chart on Regional Comparison - North America
Data Table on Regional Comparison - North America

13.3.1 US - Market size and forecast 2025-2030

Chart on US - Market size and forecast 2025-2030 ($ million)
Data Table on US - Market size and forecast 2025-2030 ($ million)
Chart on US - Year-over-year growth 2025-2030 (%)
Data Table on US - Year-over-year growth 2025-2030 (%)

13.3.2 Canada - Market size and forecast 2025-2030

Chart on Canada - Market size and forecast 2025-2030 ($ million)
Data Table on Canada - Market size and forecast 2025-2030 ($ million)
Chart on Canada - Year-over-year growth 2025-2030 (%)
Data Table on Canada - Year-over-year growth 2025-2030 (%)

13.3.3 Mexico - Market size and forecast 2025-2030

Chart on Mexico - Market size and forecast 2025-2030 ($ million)
Data Table on Mexico - Market size and forecast 2025-2030 ($ million)
Chart on Mexico - Year-over-year growth 2025-2030 (%)
Data Table on Mexico - Year-over-year growth 2025-2030 (%)

13.4 APAC - Market size and forecast 2025-2030

Chart on APAC - Market size and forecast 2025-2030 ($ million)
Data Table on APAC - Market size and forecast 2025-2030 ($ million)
Chart on APAC - Year-over-year growth 2025-2030 (%)
Data Table on APAC - Year-over-year growth 2025-2030 (%)
Chart on Regional Comparison - APAC
Data Table on Regional Comparison - APAC

13.4.1 China - Market size and forecast 2025-2030

Chart on China - Market size and forecast 2025-2030 ($ million)
Data Table on China - Market size and forecast 2025-2030 ($ million)
Chart on China - Year-over-year growth 2025-2030 (%)
Data Table on China - Year-over-year growth 2025-2030 (%)

13.4.2 Japan - Market size and forecast 2025-2030

Chart on Japan - Market size and forecast 2025-2030 ($ million)
Data Table on Japan - Market size and forecast 2025-2030 ($ million)
Chart on Japan - Year-over-year growth 2025-2030 (%)
Data Table on Japan - Year-over-year growth 2025-2030 (%)

13.4.3 India - Market size and forecast 2025-2030

Chart on India - Market size and forecast 2025-2030 ($ million)
Data Table on India - Market size and forecast 2025-2030 ($ million)
Chart on India - Year-over-year growth 2025-2030 (%)
Data Table on India - Year-over-year growth 2025-2030 (%)

13.4.4 South Korea - Market size and forecast 2025-2030

Chart on South Korea - Market size and forecast 2025-2030 ($ million)
Data Table on South Korea - Market size and forecast 2025-2030 ($ million)
Chart on South Korea - Year-over-year growth 2025-2030 (%)
Data Table on South Korea - Year-over-year growth 2025-2030 (%)

13.4.5 Australia - Market size and forecast 2025-2030

Chart on Australia - Market size and forecast 2025-2030 ($ million)
Data Table on Australia - Market size and forecast 2025-2030 ($ million)
Chart on Australia - Year-over-year growth 2025-2030 (%)
Data Table on Australia - Year-over-year growth 2025-2030 (%)

13.4.6 Indonesia - Market size and forecast 2025-2030

Chart on Indonesia - Market size and forecast 2025-2030 ($ million)
Data Table on Indonesia - Market size and forecast 2025-2030 ($ million)
Chart on Indonesia - Year-over-year growth 2025-2030 (%)
Data Table on Indonesia - Year-over-year growth 2025-2030 (%)

13.5 Europe - Market size and forecast 2025-2030

Chart on Europe - Market size and forecast 2025-2030 ($ million)
Data Table on Europe - Market size and forecast 2025-2030 ($ million)
Chart on Europe - Year-over-year growth 2025-2030 (%)
Data Table on Europe - Year-over-year growth 2025-2030 (%)
Chart on Regional Comparison - Europe
Data Table on Regional Comparison - Europe

13.5.1 Germany - Market size and forecast 2025-2030

Chart on Germany - Market size and forecast 2025-2030 ($ million)
Data Table on Germany - Market size and forecast 2025-2030 ($ million)
Chart on Germany - Year-over-year growth 2025-2030 (%)
Data Table on Germany - Year-over-year growth 2025-2030 (%)

13.5.2 UK - Market size and forecast 2025-2030

Chart on UK - Market size and forecast 2025-2030 ($ million)
Data Table on UK - Market size and forecast 2025-2030 ($ million)
Chart on UK - Year-over-year growth 2025-2030 (%)
Data Table on UK - Year-over-year growth 2025-2030 (%)

13.5.3 France - Market size and forecast 2025-2030

Chart on France - Market size and forecast 2025-2030 ($ million)
Data Table on France - Market size and forecast 2025-2030 ($ million)
Chart on France - Year-over-year growth 2025-2030 (%)
Data Table on France - Year-over-year growth 2025-2030 (%)

13.5.4 Italy - Market size and forecast 2025-2030

Chart on Italy - Market size and forecast 2025-2030 ($ million)
Data Table on Italy - Market size and forecast 2025-2030 ($ million)
Chart on Italy - Year-over-year growth 2025-2030 (%)
Data Table on Italy - Year-over-year growth 2025-2030 (%)

13.5.5 Spain - Market size and forecast 2025-2030

Chart on Spain - Market size and forecast 2025-2030 ($ million)
Data Table on Spain - Market size and forecast 2025-2030 ($ million)
Chart on Spain - Year-over-year growth 2025-2030 (%)
Data Table on Spain - Year-over-year growth 2025-2030 (%)

13.5.6 The Netherlands - Market size and forecast 2025-2030

Chart on The Netherlands - Market size and forecast 2025-2030 ($ million)
Data Table on The Netherlands - Market size and forecast 2025-2030 ($ million)
Chart on The Netherlands - Year-over-year growth 2025-2030 (%)
Data Table on The Netherlands - Year-over-year growth 2025-2030 (%)

13.6 South America - Market size and forecast 2025-2030

Chart on South America - Market size and forecast 2025-2030 ($ million)
Data Table on South America - Market size and forecast 2025-2030 ($ million)
Chart on South America - Year-over-year growth 2025-2030 (%)
Data Table on South America - Year-over-year growth 2025-2030 (%)
Chart on Regional Comparison - South America
Data Table on Regional Comparison - South America

13.6.1 Brazil - Market size and forecast 2025-2030

Chart on Brazil - Market size and forecast 2025-2030 ($ million)
Data Table on Brazil - Market size and forecast 2025-2030 ($ million)
Chart on Brazil - Year-over-year growth 2025-2030 (%)
Data Table on Brazil - Year-over-year growth 2025-2030 (%)

13.6.2 Argentina - Market size and forecast 2025-2030

Chart on Argentina - Market size and forecast 2025-2030 ($ million)
Data Table on Argentina - Market size and forecast 2025-2030 ($ million)
Chart on Argentina - Year-over-year growth 2025-2030 (%)
Data Table on Argentina - Year-over-year growth 2025-2030 (%)

13.6.3 Chile - Market size and forecast 2025-2030

Chart on Chile - Market size and forecast 2025-2030 ($ million)
Data Table on Chile - Market size and forecast 2025-2030 ($ million)
Chart on Chile - Year-over-year growth 2025-2030 (%)
Data Table on Chile - Year-over-year growth 2025-2030 (%)

13.7 Middle East and Africa - Market size and forecast 2025-2030

Chart on Middle East and Africa - Market size and forecast 2025-2030 ($ million)
Data Table on Middle East and Africa - Market size and forecast 2025-2030 ($ million)
Chart on Middle East and Africa - Year-over-year growth 2025-2030 (%)
Data Table on Middle East and Africa - Year-over-year growth 2025-2030 (%)
Chart on Regional Comparison - Middle East and Africa
Data Table on Regional Comparison - Middle East and Africa

13.7.1 Saudi Arabia - Market size and forecast 2025-2030

Chart on Saudi Arabia - Market size and forecast 2025-2030 ($ million)
Data Table on Saudi Arabia - Market size and forecast 2025-2030 ($ million)
Chart on Saudi Arabia - Year-over-year growth 2025-2030 (%)
Data Table on Saudi Arabia - Year-over-year growth 2025-2030 (%)

13.7.2 UAE - Market size and forecast 2025-2030

Chart on UAE - Market size and forecast 2025-2030 ($ million)
Data Table on UAE - Market size and forecast 2025-2030 ($ million)
Chart on UAE - Year-over-year growth 2025-2030 (%)
Data Table on UAE - Year-over-year growth 2025-2030 (%)

13.7.3 South Africa - Market size and forecast 2025-2030

Chart on South Africa - Market size and forecast 2025-2030 ($ million)
Data Table on South Africa - Market size and forecast 2025-2030 ($ million)
Chart on South Africa - Year-over-year growth 2025-2030 (%)
Data Table on South Africa - Year-over-year growth 2025-2030 (%)

13.7.4 Israel - Market size and forecast 2025-2030

Chart on Israel - Market size and forecast 2025-2030 ($ million)
Data Table on Israel - Market size and forecast 2025-2030 ($ million)
Chart on Israel - Year-over-year growth 2025-2030 (%)
Data Table on Israel - Year-over-year growth 2025-2030 (%)

13.7.5 Turkey - Market size and forecast 2025-2030

Chart on Turkey - Market size and forecast 2025-2030 ($ million)
Data Table on Turkey - Market size and forecast 2025-2030 ($ million)
Chart on Turkey - Year-over-year growth 2025-2030 (%)
Data Table on Turkey - Year-over-year growth 2025-2030 (%)

13.8 Market opportunity by geography

Market opportunity by geography ($ million)
Data Tables on Market opportunity by geography ($ million)

14. Drivers, Challenges, and Opportunity

14.1 Market drivers

Proliferation of E-commerce retail channels
Growth of smart home ecosystems
Expansion of hospitality and commercial sectors

14.2 Market challenges

Rising energy costs and sustainability
Geopolitical tensions and tariff pressures
Technological disruption and inventory obsolescence

14.3 Impact of drivers and challenges

Impact of drivers and challenges in 2025 and 2030

14.4 Market opportunities

Technological integration in smart textiles
Rise of antimicrobial protective treatments
Circular economy and recycling frameworks

15. Competitive Landscape

15.1 Overview

15.2

Overview on criticality of inputs and factors of differentiation

15.3 Landscape disruption

Overview on factors of disruption

15.4 Industry risks

Impact of key risks on business

16. Competitive Analysis

16.1 Companies profiled

Companies covered

16.2 Company ranking index

16.3 Market positioning of companies

Matrix on companies position and classification

16.4 Belysse Group NV

Belysse Group NV - Overview
Belysse Group NV - Business segments
Belysse Group NV - Key offerings
Belysse Group NV - Segment focus
SWOT

16.5 Capel Inc.

Capel Inc. - Overview
Capel Inc. - Product / Service
Capel Inc. - Key offerings
SWOT

16.6 Couristan Inc.

Couristan Inc. - Overview
Couristan Inc. - Product / Service
Couristan Inc. - Key offerings
SWOT

16.7 Dynamic Rugs Inc.

Dynamic Rugs Inc. - Overview
Dynamic Rugs Inc. - Product / Service
Dynamic Rugs Inc. - Key offerings
SWOT

16.8 FLOR

FLOR - Overview
FLOR - Product / Service
FLOR - Key offerings
SWOT

16.9 Harounian Rugs International

Harounian Rugs International - Overview
Harounian Rugs International - Product / Service
Harounian Rugs International - Key offerings
SWOT

16.10 Loloi Inc.

Loloi Inc. - Overview
Loloi Inc. - Product / Service
Loloi Inc. - Key offerings
SWOT

16.11 Milliken and Co.

Milliken and Co. - Overview
Milliken and Co. - Product / Service
Milliken and Co. - Key offerings
SWOT

16.12 Mohawk Industries Inc.

Mohawk Industries Inc. - Overview
Mohawk Industries Inc. - Business segments
Mohawk Industries Inc. - Key offerings
Mohawk Industries Inc. - Segment focus
SWOT

16.13 Oriental Weavers

Oriental Weavers - Overview
Oriental Weavers - Product / Service
Oriental Weavers - Key offerings
SWOT

16.14 Rizzy Home

Rizzy Home - Overview
Rizzy Home - Product / Service
Rizzy Home - Key offerings
SWOT

16.15 Safavieh LLC

Safavieh LLC - Overview
Safavieh LLC - Product / Service
Safavieh LLC - Key offerings
SWOT

16.16 Shaw Industries Group Inc.

Shaw Industries Group Inc. - Overview
Shaw Industries Group Inc. - Product / Service
Shaw Industries Group Inc. - Key offerings
SWOT

16.17 Surya Inc.

Surya Inc. - Overview
Surya Inc. - Product / Service
Surya Inc. - Key offerings
SWOT

16.18 Tarkett S.A.

Tarkett S.A. - Overview
Tarkett S.A. - Business segments
Tarkett S.A. - Key offerings
Tarkett S.A. - Segment focus
SWOT

17. Appendix

17.1 Scope of the report

Market definition
Objectives
Notes and caveats

17.2 Inclusions and exclusions checklist

Inclusions checklist
Exclusions checklist

17.3 Currency conversion rates for US$

17.4 Research methodology

17.5 Data procurement

Information sources

17.6 Data validation

17.7 Validation techniques employed for market sizing

17.8 Data synthesis

17.9 360 degree market analysis

17.10 List of abbreviations

Research Methodology

Technavio presents a detailed picture of the market by way of study, synthesis, and summation of data from multiple sources. The analysts have presented the various facets of the market with a particular focus on identifying the key industry influencers. The data thus presented is comprehensive, reliable, and the result of extensive research, both primary and secondary.

INFORMATION SOURCES

Primary sources

  • Manufacturers and suppliers
  • Channel partners
  • Industry experts
  • Strategic decision makers

Secondary sources

  • Industry journals and periodicals
  • Government data
  • Financial reports of key industry players
  • Historical data
  • Press releases

DATA ANALYSIS

Data Synthesis

  • Collation of data
  • Estimation of key figures
  • Analysis of derived insights

Data Validation

  • Triangulation with data models
  • Reference against proprietary databases
  • Corroboration with industry experts

REPORT WRITING

Qualitative

  • Market drivers
  • Market challenges
  • Market trends
  • Five forces analysis

Quantitative

  • Market size and forecast
  • Market segmentation
  • Geographical insights
  • Competitive landscape

Interested in this report?

Get your sample now to see our research methodology and insights!

Download Now

Frequently Asked Questions

Area Rugs market growth will increase by USD 4192.8 million during 2026-2030.

The Area Rugs market is expected to grow at a CAGR of 3.8% during 2026-2030.

Area Rugs market is segmented by Product (Machine-made area rugs, Handmade area rugs) Application (Residential, Commercial) Distribution channel (Offline, Online) Material (Nylon, Polyester, Cotton, Wool, Others)

Belysse Group NV, Capel Inc., Couristan Inc., Dynamic Rugs Inc., Feizy Import and Export Co, FLOR, Harounian Rugs International, Jaipur Living Inc., Kaleen Rugs Inc., Loloi Inc., Milliken and Co., Mohawk Industries Inc., Nourison, Obeetee Pvt Ltd, Oriental Weavers, Rizzy Home, Safavieh LLC, Shaw Industries Group Inc., Surya Inc., Tarkett S.A. are a few of the key vendors in the Area Rugs market.

North America will register the highest growth rate of 40.9% among the other regions. Therefore, the Area Rugs market in North America is expected to garner significant business opportunities for the vendors during the forecast period.

US, Canada, Mexico, China, Japan, India, South Korea, Australia, Indonesia, Germany, UK, France, Italy, Spain, The Netherlands, Brazil, Argentina, Chile, Saudi Arabia, UAE, South Africa, Israel, Turkey

  • Proliferation of E-commerce retail channels is the driving factor this market.

The Area Rugs market vendors should focus on grabbing business opportunities from the Product segment as it accounted for the largest market share in the base year.
RIA - Research AI Assistant
Ask RIA
