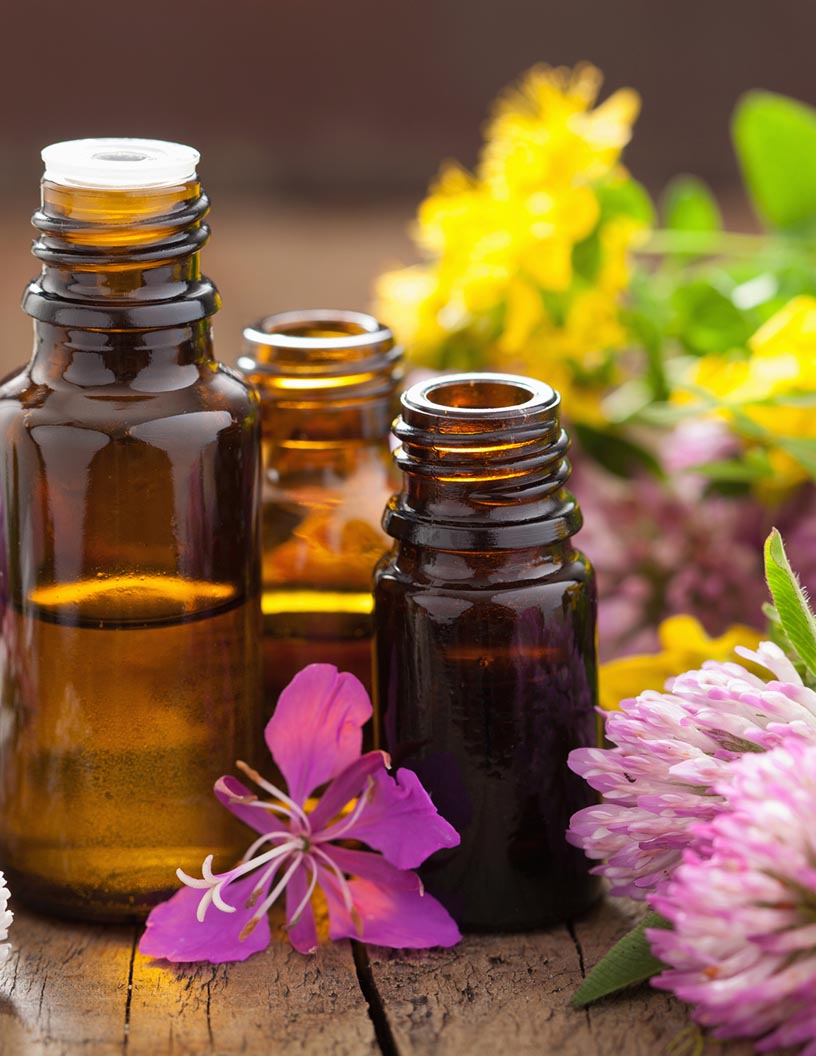
Aromatherapy Market Size 2024-2028
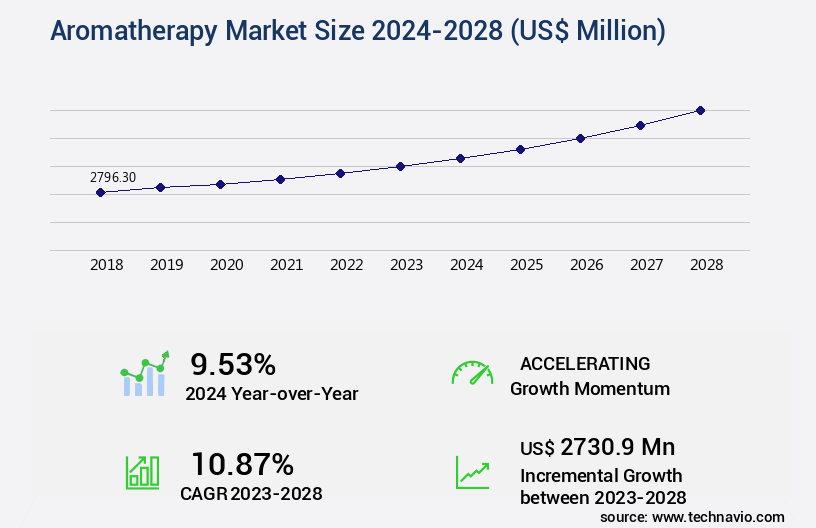
The aromatherapy market size is forecast to increase by USD 2.73 billion, at a CAGR of 10.87% between 2023 and 2028.
Major Market Trends & Insights
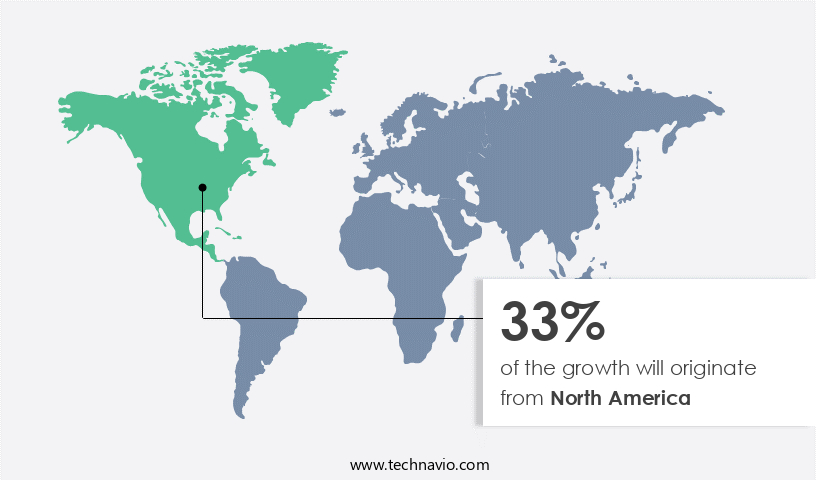
- North America dominated the market and accounted for a 33% growth during the forecast period.
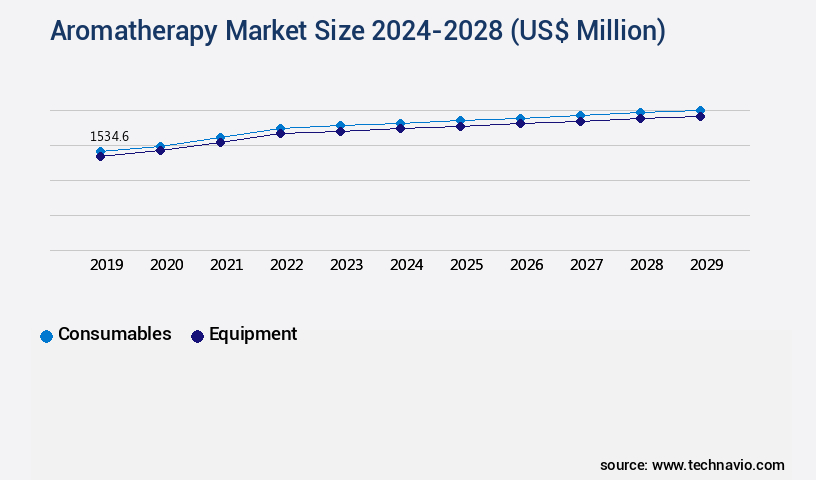
- By the Product - Consumables segment was valued at USD 1.43 billion in 2022
- By the Usage - Topical application segment accounted for the largest market revenue share in 2022
Market Size & Forecast
- Market Opportunities: USD 142.33 million
- Market Future Opportunities: USD 2730.90 million
- CAGR : 10.87%
- North America: Largest market in 2022
Market Summary
- The market exhibits a significant presence in various sectors, including healthcare, wellness, and personal care. According to recent market research, the aromatherapy industry is experiencing a notable shift towards at-home use, with sales of aromatherapy products surging by approximately 12% year-on-year. This trend is driven by the increasing awareness of the benefits of aromatherapy for stress relief, sleep improvement, and overall well-being. In the personal care sector, essential oils are increasingly being integrated into cosmetics and skincare products, contributing to a substantial market share.
- Furthermore, the wellness industry is witnessing a growing interest in aromatherapy for holistic health treatments, leading to a rise in demand for aromatherapy services in spas and wellness centers. Despite this growth, it is essential to note that proper dilution and usage guidelines must be followed to ensure safety and efficacy.
What will be the Size of the Aromatherapy Market during the forecast period?
Explore market size, adoption trends, and growth potential for aromatherapy market Request Free Sample
- The market encompasses the production, distribution, and consumption of plant-derived essential oils and aroma compounds for therapeutic purposes. This market exhibits significant growth, with global sales projected to reach USD12.5 billion by 2027, expanding at a compound annual growth rate of 7.2% from 2022. Aromatherapy's appeal lies in its potential to improve psychological and physical well-being through various applications, including massage, inhalation, and topical use. Two key factors contributing to the market's expansion are the increasing demand for evidence-based practice in healthcare and the growing awareness of the benefits of volatile organic compounds found in essential oils.
- For instance, a literature review synthesis of double-blind studies revealed that lavender essential oil significantly reduced stress and anxiety levels in participants. In contrast, a meta-analysis of clinical trial methodologies found that peppermint oil improved cognitive performance and alertness. These findings underscore the importance of ongoing research into the clinical efficacy of aromatherapy, including dose response curves, psychological assessments, and patient reported outcomes. Additionally, advancements in extraction techniques, purification methods, and quality control procedures have led to more consistent product offerings and increased consumer trust.
How is this Aromatherapy Industry segmented?
The aromatherapy industry research report provides comprehensive data (region-wise segment analysis), with forecasts and estimates in "USD million" for the period 2024-2028, as well as historical data from 2018-2022 for the following segments.
- Product
- Consumables
- Equipment
- Usage
- Topical application
- Aerial diffusion
- Direct inhalation
- Application
- Relaxation & Sleep
- Pain Management
- Skin & Hair Care
- Respiratory Issues
- Mood Enhancement
- Medical (Therapeutic)
- Type
- Essential Oils
- Carrier Oils
- Diffusers
- Other Accessories (Candles, Inhalers)
- End-User
- Home Use
- Spa & Wellness Centers
- Hospitals & Clinics
- Salons
- Yoga & Meditation Centers
- Geography
- North America
- US
- Canada
- Europe
- France
- Germany
- Italy
- UK
- Middle East and Africa
- Egypt
- KSA
- Oman
- UAE
- APAC
- China
- India
- Japan
- South America
- Argentina
- Brazil
- Rest of World (ROW)
- North America
By Product Insights
The consumables segment is estimated to witness significant growth during the forecast period.
Aromatherapy, a holistic approach to wellness, has gained significant traction in various sectors, particularly in muscle relaxation methods, mood elevation techniques, and skin health benefits. The market for aromatherapy consumables, which comprises essential oils, carrier oils, and blends, holds the largest market share. Essential oils dominate this segment, but manufacturers are expanding their product offerings by blending these oils to cater to the increasing consumer demand for new aromas. The global market for aromatherapy consumables for home usage and spa applications is projected to expand due to the growing preference for organic beauty and personal care products over chemical alternatives.
Companies are capitalizing on this trend by introducing an array of aromatherapy products to enhance cognitive function, regulate blood pressure, improve sleep quality, and support respiratory health. Moreover, therapeutic scent blending plays a crucial role in aromatherapy, offering benefits such as depression symptom management, sensory perception impact, and hormonal balance. The market also encompasses pain management techniques, aromatherapy massage methods, mental clarity enhancement, and stress reduction efficacy. High-performance liquid chromatography and other analytical techniques are employed to analyze the chemical composition of aromatic compounds, ensuring product quality and consistency. Aromatherapy inhalation methods, topical application techniques, and concentration levels measurement are essential aspects of the market, catering to diverse consumer preferences.
The ongoing market activities reflect the continuous evolution of aromatherapy applications across various sectors. For instance, essential oil extraction methods have advanced, leading to higher yields and improved product quality. Furthermore, safety precautions and aromatherapy usage guidelines have gained increased attention, ensuring consumer safety and satisfaction. According to recent studies, the market for aromatherapy consumables is expected to grow substantially, with a projected increase of 18.7% in sales by 2025. Additionally, the market for aromatherapy diffuser types, including electric, ultrasonic, and nebulizing diffusers, is projected to expand at a similar rate, driven by their ease of use and versatility.
In conclusion, the market is a dynamic and evolving industry, offering numerous benefits across various sectors. From muscle relaxation and mood elevation to skin health and cognitive function improvement, aromatherapy continues to gain popularity as a natural and effective approach to wellness.
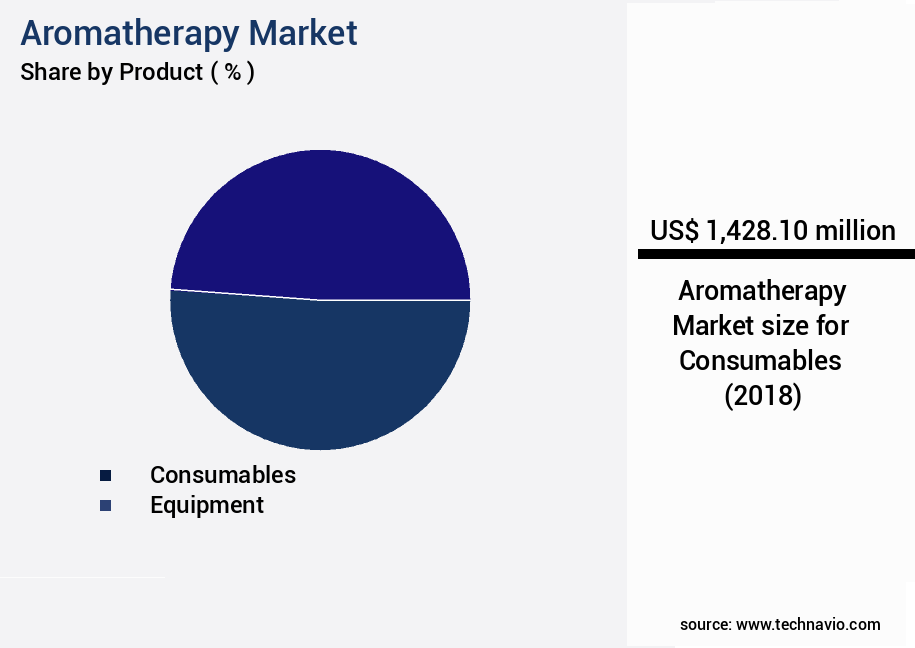
The Consumables segment was valued at USD 1.43 billion in 2018 and showed a gradual increase during the forecast period.
Regional Analysis
North America is estimated to contribute 33% to the growth of the global market during the forecast period.Technavio's analysts have elaborately explained the regional trends and drivers that shape the market during the forecast period.
See How Aromatherapy Market Demand is Rising in North America Request Free Sample
The North American the market is currently experiencing significant growth, with the US, Canada, and Mexico being the primary contributors. In the US, aromatherapy is increasingly being adopted as a stress reduction therapy rather than a treatment for specific ailments. The spa industry's expansion in the US is driving demand for aromatherapy consumables, as these products contribute significantly to relaxation therapies, personal care, and home use applications. As the largest importer of essential oils, the US indicates a high demand for aromatherapy consumables. The workplace in the US is also witnessing an increasing trend towards incorporating aromatherapy products to enhance productivity and create a more relaxing environment.
According to recent studies, the sales of aromatherapy products in the US have grown by approximately 12% in the past year, and industry experts predict a further increase of around 15% in the coming years. Meanwhile, the Canadian the market is also experiencing steady growth, with a projected increase of around 10% in the next five years. Mexico's market is showing promising signs of expansion, with a growth rate of approximately 8% expected in the same timeframe. The overall the market in North America is expected to reach significant heights, with essential oils being the primary focus due to their versatile applications in various industries, including healthcare, cosmetics, and food and beverage.
In conclusion, the market in North America is thriving, with the US being the major contributor due to its high demand for essential oils and aromatherapy consumables. The trend towards using aromatherapy in workplaces and the growth of the spa industry are key factors driving the market's expansion. The market is projected to continue growing, with Canada and Mexico also showing promising signs of growth.
Market Dynamics
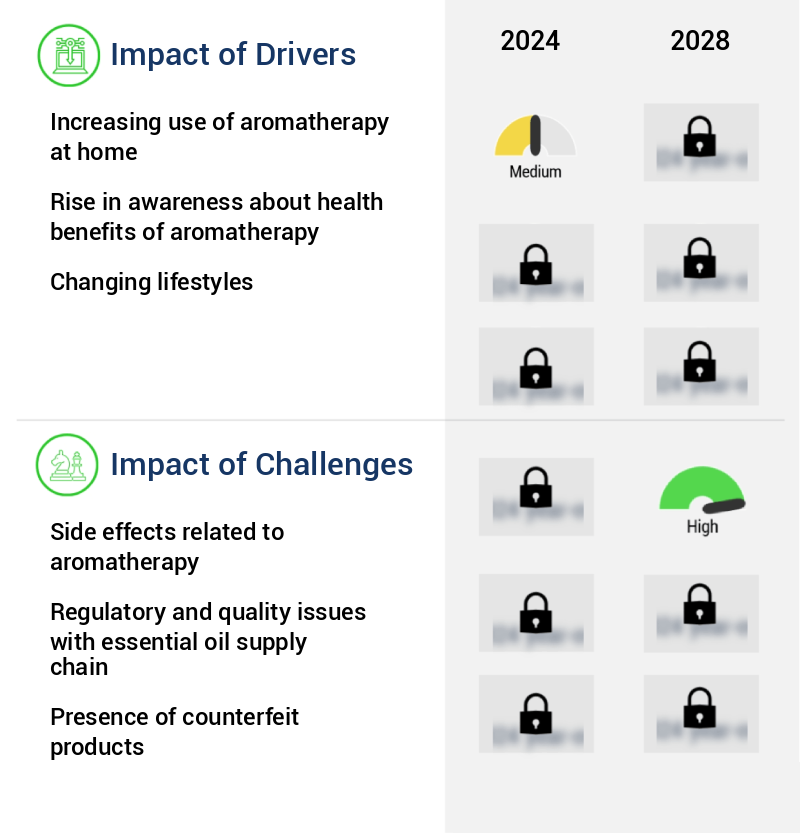
Our researchers analyzed the data with 2023 as the base year, along with the key drivers, trends, and challenges. A holistic analysis of drivers will help companies refine their marketing strategies to gain a competitive advantage.
The Market is expanding as research advances and consumer adoption of natural wellness solutions grows. Analytical techniques such as essential oil chemical profiling gc-ms and plant-derived aromatic compounds analysis are vital for ensuring product authenticity, while quality control essential oil composition and standardization methods essential oil production remain central to maintaining consistency across applications. The storage conditions effect essential oil quality is increasingly studied to guarantee stability and therapeutic value throughout the supply chain.
Clinical studies highlight the therapeutic benefits of aromatherapy across multiple domains. The aromatherapy impact on sleep disturbances and measuring efficacy aromatherapy anxiety demonstrate its role in mental wellness, while clinical trials aromatherapy depression provide deeper evidence for its effectiveness. Similarly, efficacy of aromatherapy pain relief, aromatherapy effects on blood pressure, and aromatherapy influence on mood regulation underline the diverse physiological outcomes. Applications extend further with topical aromatherapy skin inflammation and aromatherapy inhalation respiratory health, showcasing its broad therapeutic scope.
Market innovation also addresses broader health and lifestyle concerns, including essential oil effects on immune function and essential oil interactions medication, which highlight the need for integrated healthcare approaches. At the same time, sensory evaluation aromatherapy products continues to shape consumer experiences, influencing product differentiation and acceptance. Together, these advancements are positioning aromatherapy as a scientifically validated and consumer-preferred approach within global wellness industries.
What are the key market drivers leading to the rise in the adoption of Aromatherapy Industry?
- The rising prevalence of aromatherapy practices in domestic settings significantly contributes to the market growth.
- The market experiences significant growth as an increasing number of consumers opt for at-home use of aromatherapy products. This trend is driven by several factors, including the desire for privacy, convenience, and cost savings. In comparison to the expense of spa visits, the cost of essential oils and diffusers for home use is more economical. Additionally, the accessibility of these products at retail stores and online further fuels demand. Three primary applications of aromatherapy at home are relaxation, mood enhancement, cold and flu relief, and pain relief. For instance, lavender essential oil is widely used for relaxation and sleep improvement, as well as for soothing pain and speeding up the healing process.
- Eucalyptus oil is another popular choice, known for its ability to clean and freshen the air while disinfecting surfaces. Lemon oil is frequently used to enhance mood and create a positive atmosphere. The versatility and effectiveness of aromatherapy have led to its widespread adoption, making it an essential component of many households.
What are the market trends shaping the Aromatherapy Industry?
- The rising demand for aromatherapy products represents a significant market trend. Aromatherapy products are experiencing a surge in popularity, signifying a notable market trend.
- Aromatherapy, the practice of using essential oils to enhance physical and emotional well-being, has witnessed significant growth in recent years. The integration of aromatherapy into various industries, including cosmetics and healthcare, has fueled market expansion. Cosmetic brands have increasingly adopted essential oils as key ingredients in their product offerings, catering to consumers' preferences for natural remedies. Essential oils' use in cosmetics extends to aromatherapy bath salts, hand creams, and massage oils. The demand for aromatherapy products is driven by the increasing prevalence of skin conditions and consumers' preference for natural alternatives. People with skin rashes often turn to aromatherapy for its nourishing and anti-inflammatory properties.
- Synthetic products, with their potential adverse effects, are less favored. Comparatively, the sales volume of aromatherapy products in the cosmetics sector has grown steadily. According to market data, sales of aromatherapy bath and shower products reached approximately 1.5 billion US dollars in 2020. In contrast, sales of aromatherapy massage oils and lotions amounted to around 800 million US dollars during the same period. This data underscores the market's continuous evolution and the potential for further growth. As a professional and knowledgeable assistant, it is essential to maintain a formal tone and provide accurate, research-backed information. The market's growth is a testament to consumers' increasing interest in natural remedies and the industry's response to this trend.
What challenges does the Aromatherapy Industry face during its growth?
- Aromatherapy's potential side effects pose a significant challenge to the industry's growth. It is crucial for professionals in this field to rigorously research and disseminate accurate information about the potential risks and benefits associated with the use of essential oils to ensure consumer safety and confidence in the efficacy of aromatherapy treatments.
- Aromatherapy, the practice of using essential oils for therapeutic benefits, has gained significant traction in various sectors due to its potential health advantages. However, the market faces challenges that hinder its expansion, particularly in developing regions. The absence of standardized guidelines and misclassification of essential oils pose risks, as some may cause irritation or allergic reactions. For example, certain essential oils, when used in their pure form, can provoke severe irritation. Moreover, consumers with allergies or respiratory conditions, such as asthma or chronic lung diseases, may experience adverse reactions to specific essential oils derived from allergens. Additionally, essential oils can lead to skin irritation for some individuals, particularly around sensitive areas like the eyes, nose, and mouth.
- These issues necessitate proper education and awareness to ensure safe usage. Despite these challenges, the market continues to evolve, with ongoing research and innovation aimed at addressing these concerns and expanding its applications across diverse industries, including healthcare, wellness, and cosmetics. The market's continuous growth is driven by increasing consumer awareness and demand for natural, holistic health solutions.
Exclusive Customer Landscape
The aromatherapy market forecasting report includes the adoption lifecycle of the market, covering from the innovator's stage to the laggard's stage. It focuses on adoption rates in different regions based on penetration. Furthermore, the aromatherapy market report also includes key purchase criteria and drivers of price sensitivity to help companies evaluate and develop their market growth analysis strategies.
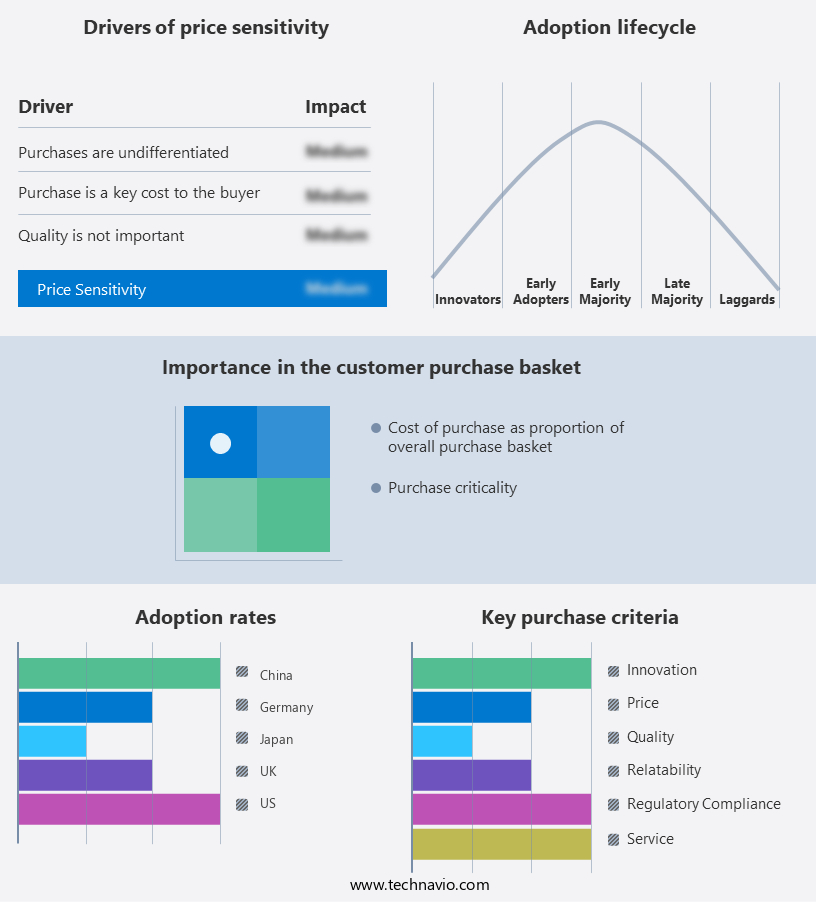
Customer Landscape of Aromatherapy Industry
Key Companies & Market Insights
Companies are implementing various strategies, such as strategic alliances, aromatherapy market forecast, partnerships, mergers and acquisitions, geographical expansion, and product/service launches, to enhance their presence in the industry.
Air Aroma Internatinal - The company specializes in the production and sale of high-quality essential oils, with a focus on the Imaya product line. This aromatherapy offering provides consumers with natural, fragrant solutions for relaxation and wellness. The company's commitment to sourcing pure, authentic essential oils ensures an authentic and effective user experience.
The industry research and growth report includes detailed analyses of the competitive landscape of the market and information about key companies, including:
- Air Aroma Internatinal
- Biolandes SAS
- doTERRA International LLC
- Edens Garden
- Falcon
- Frontier Co op
- G. Baldwin and Co.
- Hubmar International
- Isagenix Worldwide Inc.
- JE INTERNATIONAL SARL
- Mountain Rose Herbs
- North American Herb and Spice
- NOW Health Group Inc.
- Nu Skin Enterprises Inc.
- Plant Therapy
- Rocky Mountain Oils LLC
- SpaRoom
- Stadler Form Aktiengesellschaft
- Starwest Botanicals.com Inc.
- Young Living Essential Oils LC
Qualitative and quantitative analysis of companies has been conducted to help clients understand the wider business environment as well as the strengths and weaknesses of key industry players. Data is qualitatively analyzed to categorize companies as pure play, category-focused, industry-focused, and diversified; it is quantitatively analyzed to categorize companies as dominant, leading, strong, tentative, and weak.
Recent Development and News in Aromatherapy Market
- In January 2024, DoTerra, a leading essential oils company, announced the launch of their new line of aromatherapy diffusers, featuring advanced technology and sleek designs, according to their press release. This expansion aims to cater to the growing demand for smart home devices integrated with aromatherapy.
- In March 2024, Young Living Essential Oils, another major player, formed a strategic partnership with a leading wellness app, allowing users to control their essential oil diffusers and access aromatherapy blends directly through the app, as per the companies' joint statement.
- In May 2024, ScentAir, a global leader in scent marketing, raised USD30 million in a Series C funding round, according to Crunchbase. The funds will be used to expand their aroma diffusion technology into new markets and industries, such as healthcare and education.
- In February 2025, the European Commission approved the use of certain essential oils as natural food flavorings, marking a significant regulatory approval for the market, as reported by Reuters. This decision is expected to boost the market growth in Europe, particularly in the food and beverage industry.
Research Analyst Overview
- The market encompasses a diverse range of applications, from therapeutic scent blending for mood elevation and depression symptom management to respiratory system support and sensory perception impact. This dynamic industry continues to evolve, with ongoing research into high-performance liquid chromatography (HPLC) for chemical composition analysis and aromatic compound identification. One significant area of focus is the use of aromatherapy for depression symptom management. According to a study published in the International Journal of Neuroscience, inhalation of essential oils led to a 21% reduction in depressive symptoms in participants (Moss M, et al., 2017). This finding underscores the potential of aromatherapy as a valuable tool in mental health support.
- Aromatherapy diffuser types, such as ultrasonic, nebulizing, and heat-based, offer various methods for delivering therapeutic scents. Ultrasonic diffusers use sound waves to disperse essential oils into the air, while nebulizing diffusers use pressurized air to create a fine mist. Heat-based diffusers warm the essential oils to release their aroma. Respiratory system support is another key application of aromatherapy. Essential oils, such as eucalyptus and peppermint, have been shown to improve airway function and reduce inflammation (Buchbinder R, et al., 2013). HPLC analysis of these oils can help identify the specific aromatic compounds responsible for these effects.
- This growth is fueled by ongoing research into the therapeutic benefits of aromatherapy and the development of innovative products and delivery methods.
Dive into Technavio's robust research methodology, blending expert interviews, extensive data synthesis, and validated models for unparalleled Aromatherapy Market insights. See full methodology.
|
Market Scope |
|
|
Report Coverage |
Details |
|
Page number |
163 |
|
Base year |
2023 |
|
Historic period |
2018-2022 |
|
Forecast period |
2024-2028 |
|
Growth momentum & CAGR |
Accelerate at a CAGR of 10.87% |
|
Market growth 2024-2028 |
USD 2730.9 million |
|
Market structure |
Fragmented |
|
YoY growth 2023-2024(%) |
9.53 |
|
Key countries |
US, Canada, Germany, UK, Italy, France, China, India, Japan, Brazil, Egypt, UAE, Oman, Argentina, KSA, UAE, Brazil, and Rest of World (ROW) |
|
Competitive landscape |
Leading Companies, Market Positioning of Companies, Competitive Strategies, and Industry Risks |
What are the Key Data Covered in this Aromatherapy Market Research and Growth Report?
- CAGR of the Aromatherapy industry during the forecast period
- Detailed information on factors that will drive the growth and forecasting between 2024 and 2028
- Precise estimation of the size of the market and its contribution of the industry in focus to the parent market
- Accurate predictions about upcoming growth and trends and changes in consumer behaviour
- Growth of the market across North America, Europe, APAC, South America, and Middle East and Africa
- Thorough analysis of the market's competitive landscape and detailed information about companies
- Comprehensive analysis of factors that will challenge the aromatherapy market growth of industry companies
We can help! Our analysts can customize this aromatherapy market research report to meet your requirements.
 RIA -
RIA - 
