Assembly Automation Market Analysis, Size, and Forecast 2026-2030: APAC (China, Japan, and India), North America (US, Canada, and Mexico), Europe (Germany, France, and UK), Middle East and Africa (Saudi Arabia, UAE, and South Africa), South America (Brazil, Argentina, and Colombia), and Rest of World (ROW)

Assembly Automation Market Analysis, Size, and Forecast 2026-2030:
APAC (China, Japan, and India), North America (US, Canada, and Mexico), Europe (Germany, France, and UK), Middle East and Africa (Saudi Arabia, UAE, and South Africa), South America (Brazil, Argentina, and Colombia), and Rest of World (ROW)

Published: Dec 2025 308 Pages SKU: IRTNTR81224

Market Overview at a Glance

$28.39 B
Market Opportunity
9.5%
CAGR 2025 - 2030
54.9%
APAC Growth
$23.91 B
Robot automation equipment segment 2024

Assembly Automation Market Size 2026-2030

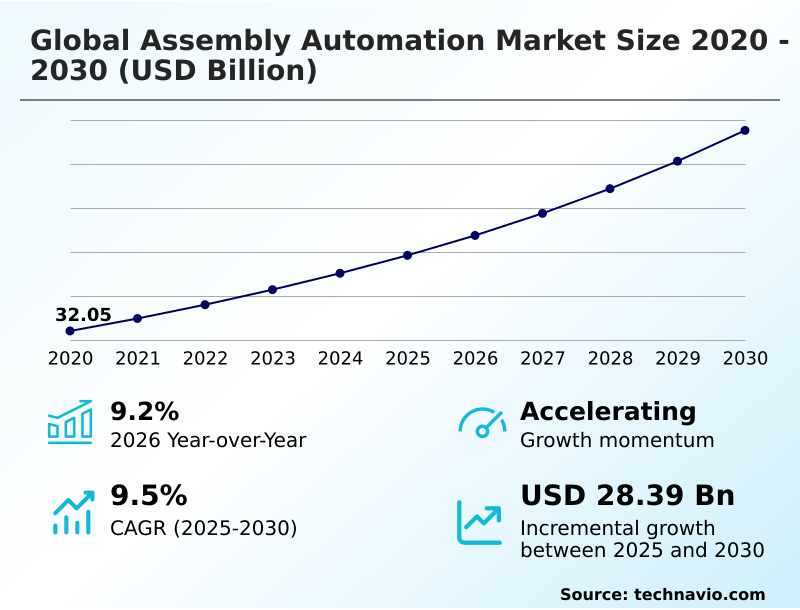
The assembly automation market size is valued to increase by USD 28.39 billion, at a CAGR of 9.5% from 2025 to 2030. Labor shortages and strategic shift to workforce augmentation will drive the assembly automation market.

Major Market Trends & Insights

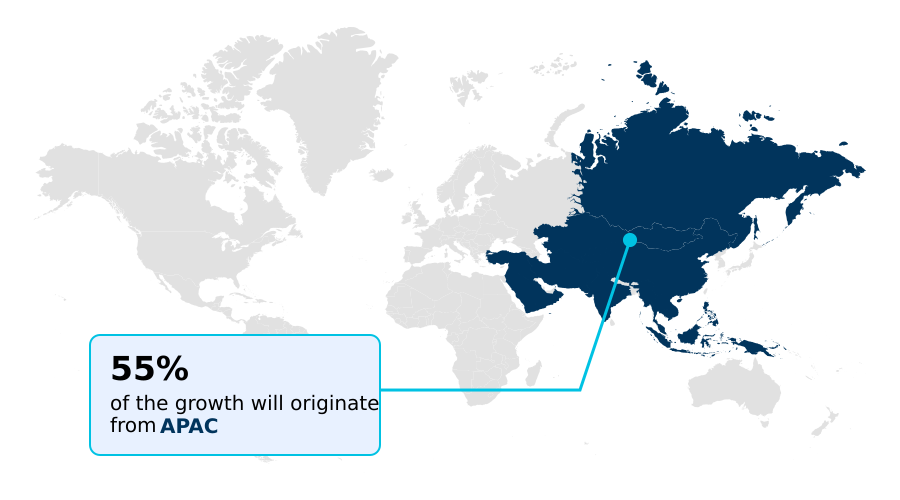
  • APAC dominated the market and accounted for a 54.9% growth during the forecast period.
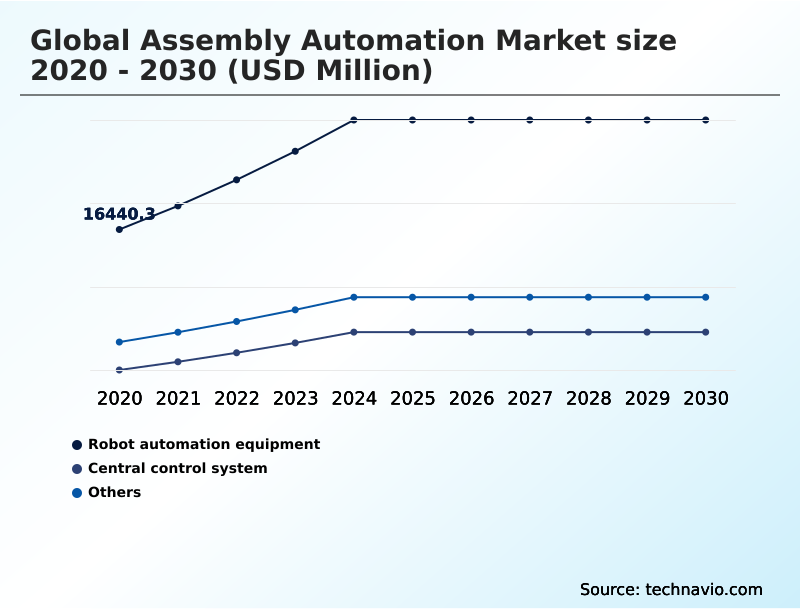
  • By Component - Robot automation equipment segment was valued at USD 23.91 billion in 2024
  • By End-user - Automotive segment accounted for the largest market revenue share in 2024

Market Size & Forecast

  • Market Opportunities: USD 45.58 billion
  • Market Future Opportunities: USD 28.39 billion
  • CAGR from 2025 to 2030 : 9.5%

Market Summary

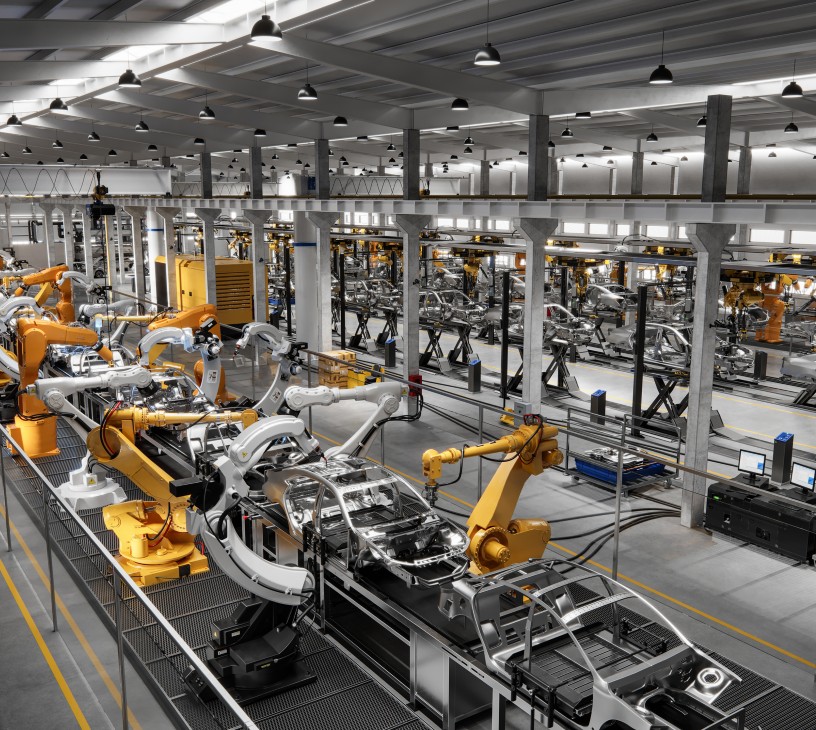
  • The Assembly Automation market is defined by the strategic convergence of mechanized equipment, robotic systems, and advanced software to perform the aggregation of discrete components into finished goods. This process relies on a synchronized infrastructure of programmable logic controllers, sensors, and actuators that coordinate material logistics and joining tasks.
  • The adoption of Assembly Automation is propelled by the need for greater operational efficiency and quality, as human assembly capabilities are exceeded by the miniaturization of electronics and the complexity of modern products. In one business scenario, an automotive OEM implements autonomous mobile robots and digital twin technology to create a flexible, high-mix, low-volume production line.
  • This allows the facility to assemble multiple electric vehicle models on the same floor, reducing retooling downtime and responding dynamically to shifts in consumer demand. The integration of generative AI and software-defined automation is further democratizing access to these advanced systems, moving the industry toward more intelligent and resilient manufacturing ecosystems.

What will be the Size of the Assembly Automation Market during the forecast period?

Get Key Insights on Market Forecast (PDF) Request Free Sample

How is the Assembly Automation Market Segmented?

The assembly automation industry research report provides comprehensive data (region-wise segment analysis), with forecasts and estimates in "USD million" for the period 2026-2030, as well as historical data from 2020-2024 for the following segments.

  • Component
    • Robot automation equipment
    • Central control system
    • Others
  • End-user
    • Automotive
    • Electronics
    • Healthcare
    • Aerospace and defense
    • Others
  • Business segment
    • Large enterprises
    • Small and medium enterprises
  • Geography
    • APAC
      • China
      • Japan
      • India
    • North America
      • US
      • Canada
      • Mexico
    • Europe
      • Germany
      • France
      • UK
    • Middle East and Africa
      • Saudi Arabia
      • UAE
      • South Africa
    • South America
      • Brazil
      • Argentina
      • Colombia
    • Rest of World (ROW)

By Component Insights

The robot automation equipment segment is estimated to witness significant growth during the forecast period.

The robot automation equipment segment is driven by the deployment of high-performance collaborative robots and industrial arms to address labor shortages. A key shift is the integration of physical AI, enabling robotic systems to operate in unstructured environments.

For instance, advanced models combining high-payload capacity with mechatronics deliver up to a 30% improvement in cycle times for machine tending and palletizing. This evolution from simple motion control systems to intelligent, adaptive machines underscores a move toward workforce augmentation.

The focus is on robots that are not only stronger and faster but also leverage predictive maintenance and kinematics to adapt to variable production needs, facilitating the growth of flexible manufacturing without extensive reprogramming.

Request Free Sample

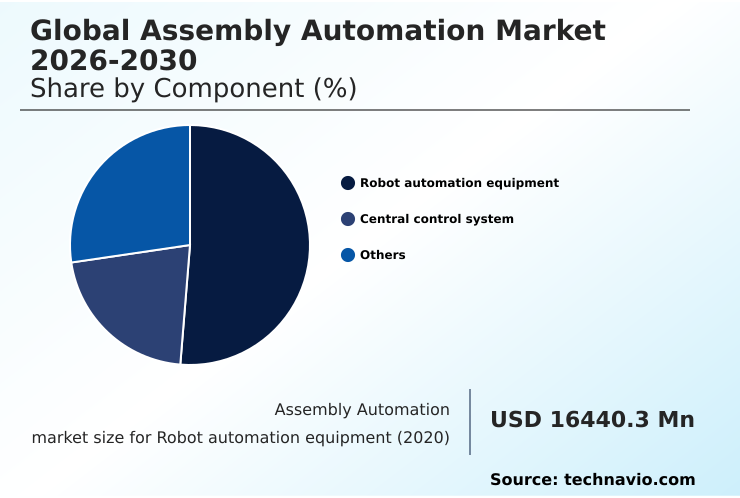
The Robot automation equipment segment was valued at USD 23.91 billion in 2024 and showed a gradual increase during the forecast period.

Request Free Sample

Regional Analysis

APAC is estimated to contribute 54.9% to the growth of the global market during the forecast period.Technavio’s analysts have elaborately explained the regional trends and drivers that shape the market during the forecast period.

See How Assembly Automation Market Demand is Rising in APAC Request Free Sample

The geographic landscape is dominated by APAC, which accounts for over 54% of the market, driven by large-scale manufacturing in China and the technological sophistication of Japan and South Korea.

This region is a hub for high-speed pick-and-place robotics and is pioneering dark factories. North America, representing nearly 20% of the market, is focused on reshoring manufacturing, leveraging AI-enabled control systems for manufacturing and collaborative robots to counter labor shortages.

Europe emphasizes Industry 4.0 principles, with a strong focus on functional safety, sustainability, and software-defined automation.

European firms are leaders in developing greenfield projects and advanced system integration, with digital twin for process simulation used to reduce ramp-up time by up to 30%, showcasing a mature market that intertwines physical automation with rigorous digital and compliance standards.

Market Dynamics

Our researchers analyzed the data with 2025 as the base year, along with the key drivers, trends, and challenges. A holistic analysis of drivers will help companies refine their marketing strategies to gain a competitive advantage.

  • The evolution of the market is vividly illustrated through the application of specific, advanced technologies. For instance, robotic drilling and fastening systems are becoming indispensable in the aerospace sector, where precision and structural integrity are paramount.
  • In parallel, the rise of flexible manufacturing is enabled by automated guided vehicles for material logistics, which are the backbone of modern matrix production layouts. These systems allow for dynamic workflows, a stark contrast to rigid conveyor-based lines. The intelligence layer is provided by AI-enabled control systems for manufacturing, which optimize processes in real time.
  • In the electronics sector, high-speed pick-and-place robotics are essential for handling miniaturized components, while collaborative robots for machine tending are filling critical labor gaps in general industry. The commissioning phase has been revolutionized by using a digital twin for process simulation, which has been shown to reduce physical installation errors and ramp-up times more effectively than traditional trial-and-error methods.
  • Real-time adaptive motion control and vision-guided robotic assembly ensure that robots can handle product variations without manual reprogramming. Automated quality inspection systems and a unified software-defined control architecture are now standard for achieving zero-defect production. This modular production for electric vehicles, which require heavy payload and precision joining, further highlights the need for adaptable systems.
  • Predictive maintenance for robotic arms, cybersecurity for industrial control systems, and advanced end-of-arm tooling for delicate handling are all critical for ensuring uptime and security. Autonomous logistics in manufacturing and adherence to human-robot collaboration safety standards are also key considerations, while generative AI for plc code generation democratizes access to complex automation.

What are the key market drivers leading to the rise in the adoption of Assembly Automation Industry?

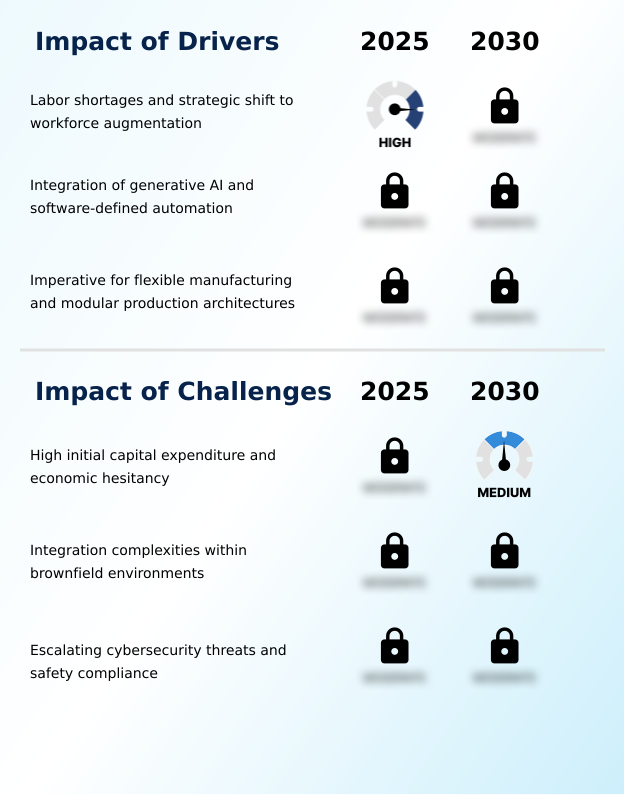
  • Persistent labor shortages and a strategic shift toward workforce augmentation are key drivers fueling growth in the assembly automation market.

  • Market growth is primarily driven by the need to address critical labor shortages through workforce augmentation. Manufacturers are deploying collaborative robots and autonomous mobile robots (AMRs) to fill gaps in manual assembly and logistics.
  • For instance, new cobot models offer a 15-kilogram payload capacity and a 30% improvement in joint speed, effectively augmenting human capabilities. A second major driver is the integration of AI and software-defined automation, which lowers the barrier to entry.
  • The advent of generative AI copilots can reduce PLC programming development time by up to 40%. This is complemented by the imperative for flexible manufacturing, particularly in industries with high-mix, low-volume production.
  • Modular production architectures, replacing linear conveyors, allow for rapid reconfiguration to accommodate new product models without extensive downtime or capital expenditure.

What are the market trends shaping the Assembly Automation Industry?

  • The emergence of generative copilots within engineering workflows represents a significant market trend. These AI-powered tools are streamlining the design and commissioning of complex automation systems.

  • Key market trends are reshaping assembly line architecture and engineering workflows. The emergence of generative AI for PLC code generation is democratizing advanced automation, with some tools reducing software development time by approximately 40%. This is part of a broader shift toward a software-defined control architecture.
  • Concurrently, the industry is moving from rigid linear conveyors to modular production for electric vehicles, enabled by autonomous mobile robots (AMRs) and automated guided vehicles. This allows for matrix production layouts, enhancing flexibility. Finally, physical AI is transforming collaborative robots from slow assistants into high-performance machines.
  • Next-generation cobots now feature industrial-grade speed and payload capabilities, such as a 15-kilogram capacity, combined with advanced perception systems for complex tasks like bin picking, blurring the line with traditional 6-axis articulated arms.

What challenges does the Assembly Automation Industry face during its growth?

  • High initial capital expenditure, compounded by economic hesitancy in key manufacturing sectors, presents a primary challenge affecting industry growth.

  • Significant challenges constrain market adoption, led by high initial capital expenditure and economic hesitancy, particularly among small and medium enterprises. A second major hurdle involves integration complexities within brownfield environments. Legacy factories often feature heterogeneous machinery and outdated communication protocols, with analyses showing that over 60% of implementation time can be spent on writing custom interfaces for this operational technology.
  • This issue creates data silos and inflates deployment costs. A third critical challenge is the dual threat of escalating cybersecurity risks and stringent safety compliance. The increased connectivity of industrial control systems has led to a 300% rise in targeted cyberattacks in some periods, while evolving human-robot collaboration safety standards add complexity and potential liability to deployments.

Exclusive Technavio Analysis on Customer Landscape

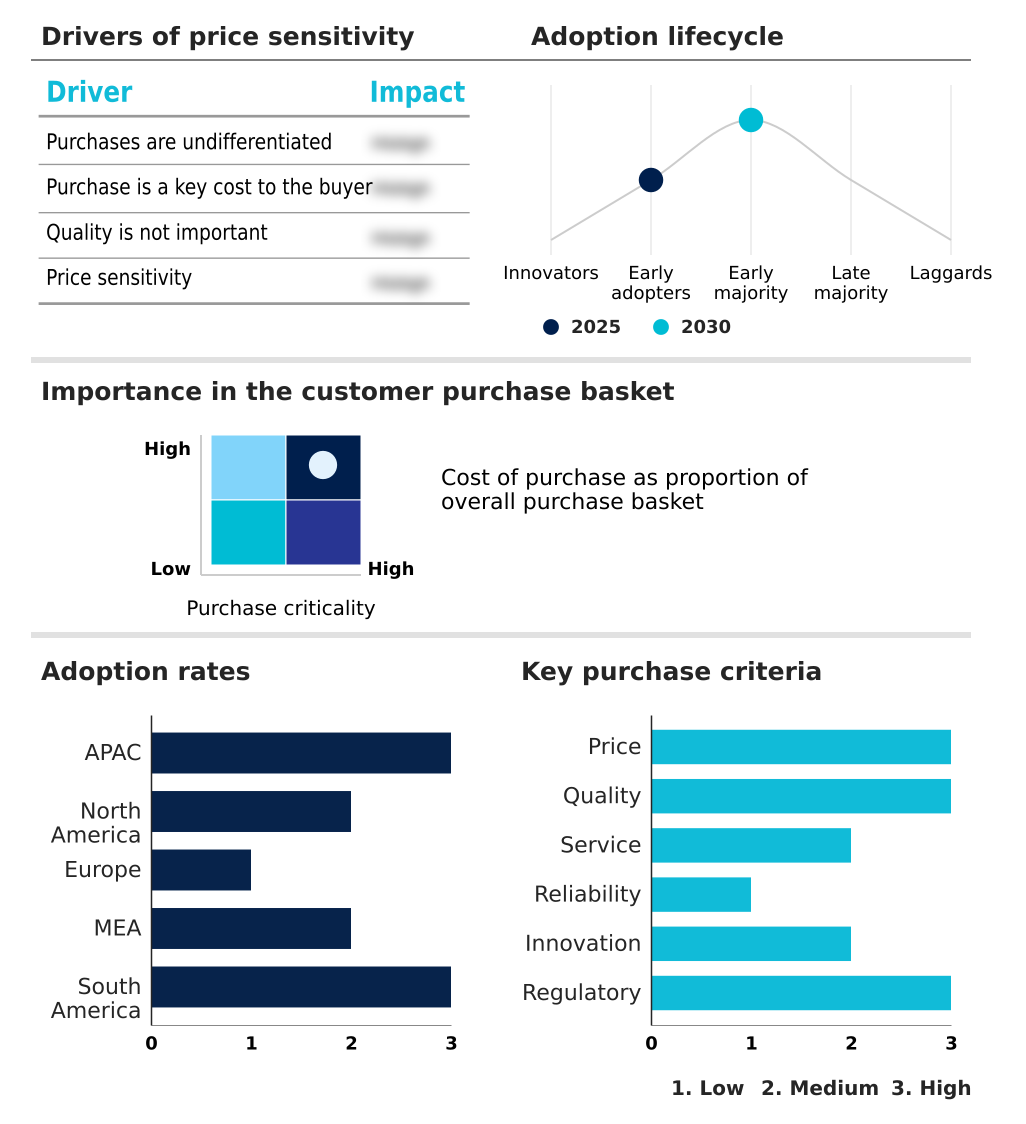
The assembly automation market forecasting report includes the adoption lifecycle of the market, covering from the innovator’s stage to the laggard’s stage. It focuses on adoption rates in different regions based on penetration. Furthermore, the assembly automation market report also includes key purchase criteria and drivers of price sensitivity to help companies evaluate and develop their market growth analysis strategies.

Customer Landscape of Assembly Automation Industry

Competitive Landscape

Companies are implementing various strategies, such as strategic alliances, assembly automation market forecast, partnerships, mergers and acquisitions, geographical expansion, and product/service launches, to enhance their presence in the industry.

ABB Ltd. - Offerings center on advanced industrial robots, including collaborative and 6-axis arms, alongside integrated automation systems and software for the automotive, electronics, and manufacturing sectors.

The industry research and growth report includes detailed analyses of the competitive landscape of the market and information about key companies, including:

  • ABB Ltd.
  • Comau Spa
  • DENSO Corp.
  • Durr AG
  • Emerson Electric Co.
  • Epson Corp.
  • FANUC Corp.
  • GROB WERKE GmbH
  • Honeywell International Inc.
  • Keyence Corp.
  • KUKA AG
  • Mitsubishi Electric Corp.
  • OMRON Corp.
  • Panasonic Holdings Corp.
  • Rockwell Automation Inc.
  • Schneider Electric SE
  • Siemens AG
  • Staubli International
  • Universal Robots AS
  • YASKAWA ELECTRIC CO.

Qualitative and quantitative analysis of companies has been conducted to help clients understand the wider business environment as well as the strengths and weaknesses of key industry players. Data is qualitatively analyzed to categorize companies as pure play, category-focused, industry-focused, and diversified; it is quantitatively analyzed to categorize companies as dominant, leading, strong, tentative, and weak.

Recent Development and News in Assembly automation market

  • In May, 2025, Universal Robots AS launched the AI-ready UR15 collaborative robot at Automate 2025, featuring a 15-kilogram payload and delivering faster cycle times for machine tending and palletizing applications.
  • In April, 2025, OMRON Corp. announced the establishment of a new global robotics organization to accelerate the development and delivery of localized automation solutions for key regional markets, particularly in Asia.
  • In March, 2025, KUKA AG unveiled the KMP 3000P, an autonomous mobile platform capable of carrying loads up to three tons, designed to replace chain conveyors in automotive body shops.
  • In February, 2025, Becton, Dickinson and Company completed the retrofit of its European production facilities with high-speed, aseptic assembly cells for pre-filled syringes to ensure rapid scalability and sterility.

Dive into Technavio’s robust research methodology, blending expert interviews, extensive data synthesis, and validated models for unparalleled Assembly Automation Market insights. See full methodology.

Market Scope
Page number 308
Base year 2025
Historic period 2020-2024
Forecast period 2026-2030
Growth momentum & CAGR Accelerate at a CAGR of 9.5%
Market growth 2026-2030 USD 28393.5 million
Market structure Fragmented
YoY growth 2025-2026(%) 9.2%
Key countries China, Japan, India, South Korea, Australia, Indonesia, US, Canada, Mexico, Germany, France, UK, Italy, Spain, The Netherlands, Saudi Arabia, UAE, South Africa, Israel, Turkey, Brazil, Argentina and Colombia
Competitive landscape Leading Companies, Market Positioning of Companies, Competitive Strategies, and Industry Risks

Request Free Sample

Research Analyst Overview

  • The market is undergoing a significant transformation, moving beyond simple hardware deployment to the integration of intelligent, interconnected technologies. The adoption of multi-axis robotic arms, SCARA robots, and other robotic systems is now standard, but the key differentiator is the software layer.
  • Technologies such as digital twin technology, generative AI, and physical AI are reshaping what is possible in automated assembly. The entire ecosystem, built on programmable logic controllers and machine vision systems, is becoming smarter. This shift toward software-defined automation and cloud robotics presents a strategic challenge at the boardroom level, forcing a re-evaluation of capital expenditure.
  • Investment decisions now weigh the long-term value of a flexible, data-driven software platform against the immediate cost of hardware. The use of advanced simulation tools has demonstrated a capability to reduce project ramp-up times by up to 30%, fundamentally altering ROI calculations.
  • This evolution is driven by the need to manage complex kinematics and motion control systems while ensuring functional safety and enabling predictive maintenance, with decentralized architecture and IIoT facilitating this change.

What are the Key Data Covered in this Assembly Automation Market Research and Growth Report?

  • What is the expected growth of the Assembly Automation Market between 2026 and 2030?

    • USD 28.39 billion, at a CAGR of 9.5%

  • What segmentation does the market report cover?

    • The report is segmented by Component (Robot automation equipment, Central control system, and Others), End-user (Automotive, Electronics, Healthcare, Aerospace and defense, and Others), Business Segment (Large enterprises, and Small and medium enterprises) and Geography (APAC, North America, Europe, Middle East and Africa, South America)

  • Which regions are analyzed in the report?

    • APAC, North America, Europe, Middle East and Africa and South America

  • What are the key growth drivers and market challenges?

    • Labor shortages and strategic shift to workforce augmentation, High initial capital expenditure and economic hesitancy

  • Who are the major players in the Assembly Automation Market?

    • ABB Ltd., Comau Spa, DENSO Corp., Durr AG, Emerson Electric Co., Epson Corp., FANUC Corp., GROB WERKE GmbH, Honeywell International Inc., Keyence Corp., KUKA AG, Mitsubishi Electric Corp., OMRON Corp., Panasonic Holdings Corp., Rockwell Automation Inc., Schneider Electric SE, Siemens AG, Staubli International, Universal Robots AS and YASKAWA ELECTRIC CO.

Market Research Insights

  • Market dynamics are shaped by a strategic pivot toward operational resilience and advanced digital technologies. The imperative for supply chain resilience is accelerating the adoption of modular production, which shows a greater ROI compared to rigid, linear systems. This shift is supported by real-time data processing and a focus on asset performance management.
  • Key technologies underpinning this transition include vision-guided robotic assembly and software-defined control architecture, which have collectively reduced development time by over 30% in certain applications. This advancement in industrial control systems is crucial as manufacturers seek to optimize assembly sequences dynamically, lowering energy consumption by as much as 20% in newly deployed systems.
  • The focus is no longer solely on speed but also on creating an intelligent, interconnected smart factory environment.

We can help! Our analysts can customize this assembly automation market research report to meet your requirements.

Get in touch

1. Executive Summary

1.1 Market overview

Executive Summary - Chart on Market Overview
Executive Summary - Data Table on Market Overview
Executive Summary - Chart on Global Market Characteristics
Executive Summary - Chart on Market by Geography
Executive Summary - Chart on Market Segmentation by Component
Executive Summary - Chart on Market Segmentation by End-user
Executive Summary - Chart on Market Segmentation by Business Segment
Executive Summary - Chart on Incremental Growth
Executive Summary - Data Table on Incremental Growth
Executive Summary - Chart on Company Market Positioning

2. Technavio Analysis

2.1 Analysis of price sensitivity, lifecycle, customer purchase basket, adoption rates, and purchase criteria

2.2 Criticality of inputs and Factors of differentiation

Chart on Overview on criticality of inputs and factors of differentiation

2.3 Factors of disruption

Chart on Overview on factors of disruption

2.4 Impact of drivers and challenges

Chart on Impact of drivers and challenges in 2025 and 2030

3. Market Landscape

3.1 Market ecosystem

Chart on Parent Market
Data Table on - Parent Market

3.2 Market characteristics

Chart on Market characteristics analysis

3.3 Value chain analysis

Chart on Value chain analysis

4. Market Sizing

4.1 Market definition

Data Table on Offerings of companies included in the market definition

4.2 Market segment analysis

Market segments

4.3 Market size 2025

4.4 Market outlook: Forecast for 2025-2030

Chart on Global - Market size and forecast 2025-2030 ($ million)
Data Table on Global - Market size and forecast 2025-2030 ($ million)
Chart on Global Market: Year-over-year growth 2025-2030 (%)
Data Table on Global Market: Year-over-year growth 2025-2030 (%)

5. Historic Market Size

5.1 Global Assembly Automation Market 2020 - 2024

Historic Market Size - Data Table on Global Assembly Automation Market 2020 - 2024 ($ million)

5.2 Component segment analysis 2020 - 2024

Historic Market Size - Component Segment 2020 - 2024 ($ million)

5.3 End-user segment analysis 2020 - 2024

Historic Market Size - End-user Segment 2020 - 2024 ($ million)

5.4 Business segment analysis 2020 - 2024

Historic Market Size - Business Segment 2020 - 2024 ($ million)

5.5 Geography segment analysis 2020 - 2024

Historic Market Size - Geography Segment 2020 - 2024 ($ million)

5.6 Country segment analysis 2020 - 2024

Historic Market Size - Country Segment 2020 - 2024 ($ million)

6. Qualitative Analysis

6.1 The AI impact on global assembly automation market

7. Five Forces Analysis

7.1 Five forces summary

Five forces analysis - Comparison between 2025 and 2030

7.2 Bargaining power of buyers

Bargaining power of buyers - Impact of key factors 2025 and 2030

7.3 Bargaining power of suppliers

Bargaining power of suppliers - Impact of key factors in 2025 and 2030

7.4 Threat of new entrants

Threat of new entrants - Impact of key factors in 2025 and 2030

7.5 Threat of substitutes

Threat of substitutes - Impact of key factors in 2025 and 2030

7.6 Threat of rivalry

Threat of rivalry - Impact of key factors in 2025 and 2030

7.7 Market condition

Chart on Market condition - Five forces 2025 and 2030

8. Market Segmentation by Component

8.1 Market segments

Chart on Component - Market share 2025-2030 (%)
Data Table on Component - Market share 2025-2030 (%)

8.2 Comparison by Component

Chart on Comparison by Component
Data Table on Comparison by Component

8.3 Robot automation equipment - Market size and forecast 2025-2030

Chart on Robot automation equipment - Market size and forecast 2025-2030 ($ million)
Data Table on Robot automation equipment - Market size and forecast 2025-2030 ($ million)
Chart on Robot automation equipment - Year-over-year growth 2025-2030 (%)
Data Table on Robot automation equipment - Year-over-year growth 2025-2030 (%)

8.4 Central control system - Market size and forecast 2025-2030

Chart on Central control system - Market size and forecast 2025-2030 ($ million)
Data Table on Central control system - Market size and forecast 2025-2030 ($ million)
Chart on Central control system - Year-over-year growth 2025-2030 (%)
Data Table on Central control system - Year-over-year growth 2025-2030 (%)

8.5 Others - Market size and forecast 2025-2030

Chart on Others - Market size and forecast 2025-2030 ($ million)
Data Table on Others - Market size and forecast 2025-2030 ($ million)
Chart on Others - Year-over-year growth 2025-2030 (%)
Data Table on Others - Year-over-year growth 2025-2030 (%)

8.6 Market opportunity by Component

Market opportunity by Component ($ million)
Data Table on Market opportunity by Component ($ million)

9. Market Segmentation by End-user

9.1 Market segments

Chart on End-user - Market share 2025-2030 (%)
Data Table on End-user - Market share 2025-2030 (%)

9.2 Comparison by End-user

Chart on Comparison by End-user
Data Table on Comparison by End-user

9.3 Automotive - Market size and forecast 2025-2030

Chart on Automotive - Market size and forecast 2025-2030 ($ million)
Data Table on Automotive - Market size and forecast 2025-2030 ($ million)
Chart on Automotive - Year-over-year growth 2025-2030 (%)
Data Table on Automotive - Year-over-year growth 2025-2030 (%)

9.4 Electronics - Market size and forecast 2025-2030

Chart on Electronics - Market size and forecast 2025-2030 ($ million)
Data Table on Electronics - Market size and forecast 2025-2030 ($ million)
Chart on Electronics - Year-over-year growth 2025-2030 (%)
Data Table on Electronics - Year-over-year growth 2025-2030 (%)

9.5 Healthcare - Market size and forecast 2025-2030

Chart on Healthcare - Market size and forecast 2025-2030 ($ million)
Data Table on Healthcare - Market size and forecast 2025-2030 ($ million)
Chart on Healthcare - Year-over-year growth 2025-2030 (%)
Data Table on Healthcare - Year-over-year growth 2025-2030 (%)

9.6 Aerospace and defense - Market size and forecast 2025-2030

Chart on Aerospace and defense - Market size and forecast 2025-2030 ($ million)
Data Table on Aerospace and defense - Market size and forecast 2025-2030 ($ million)
Chart on Aerospace and defense - Year-over-year growth 2025-2030 (%)
Data Table on Aerospace and defense - Year-over-year growth 2025-2030 (%)

9.7 Others - Market size and forecast 2025-2030

Chart on Others - Market size and forecast 2025-2030 ($ million)
Data Table on Others - Market size and forecast 2025-2030 ($ million)
Chart on Others - Year-over-year growth 2025-2030 (%)
Data Table on Others - Year-over-year growth 2025-2030 (%)

9.8 Market opportunity by End-user

Market opportunity by End-user ($ million)
Data Table on Market opportunity by End-user ($ million)

10. Market Segmentation by Business Segment

10.1 Market segments

Chart on Market Segmentation by Business Segment - Market share 2025-2030 (%)
Data Table on Market Segmentation by Business Segment - Market share 2025-2030 (%)

10.2 Comparison by Market Segmentation by Business Segment

Chart on Comparison by Market Segmentation by Business Segment
Data Table on Comparison by Market Segmentation by Business Segment

10.3 Large enterprises - Market size and forecast 2025-2030

Chart on Large enterprises - Market size and forecast 2025-2030 ($ million)
Data Table on Large enterprises - Market size and forecast 2025-2030 ($ million)
Chart on Large enterprises - Year-over-year growth 2025-2030 (%)
Data Table on Large enterprises - Year-over-year growth 2025-2030 (%)

10.4 Small and medium enterprises - Market size and forecast 2025-2030

Chart on Small and medium enterprises - Market size and forecast 2025-2030 ($ million)
Data Table on Small and medium enterprises - Market size and forecast 2025-2030 ($ million)
Chart on Small and medium enterprises - Year-over-year growth 2025-2030 (%)
Data Table on Small and medium enterprises - Year-over-year growth 2025-2030 (%)

10.5 Market opportunity by Market Segmentation by Business Segment

Market opportunity by Market Segmentation by Business Segment ($ million)
Data Table on Market opportunity by Market Segmentation by Business Segment ($ million)

11. Customer Landscape

11.1 Customer landscape overview

Analysis of price sensitivity, lifecycle, customer purchase basket, adoption rates, and purchase criteria

12. Geographic Landscape

12.1 Geographic segmentation

Chart on Market share by geography 2025-2030 (%)
Data Table on Market share by geography 2025-2030 (%)

12.2 Geographic comparison

Chart on Geographic comparison
Data Table on Geographic comparison

12.3 APAC - Market size and forecast 2025-2030

Chart on APAC - Market size and forecast 2025-2030 ($ million)
Data Table on APAC - Market size and forecast 2025-2030 ($ million)
Chart on APAC - Year-over-year growth 2025-2030 (%)
Data Table on APAC - Year-over-year growth 2025-2030 (%)
Chart on Regional Comparison - APAC
Data Table on Regional Comparison - APAC

12.3.1 China - Market size and forecast 2025-2030

Chart on China - Market size and forecast 2025-2030 ($ million)
Data Table on China - Market size and forecast 2025-2030 ($ million)
Chart on China - Year-over-year growth 2025-2030 (%)
Data Table on China - Year-over-year growth 2025-2030 (%)

12.3.2 Japan - Market size and forecast 2025-2030

Chart on Japan - Market size and forecast 2025-2030 ($ million)
Data Table on Japan - Market size and forecast 2025-2030 ($ million)
Chart on Japan - Year-over-year growth 2025-2030 (%)
Data Table on Japan - Year-over-year growth 2025-2030 (%)

12.3.3 India - Market size and forecast 2025-2030

Chart on India - Market size and forecast 2025-2030 ($ million)
Data Table on India - Market size and forecast 2025-2030 ($ million)
Chart on India - Year-over-year growth 2025-2030 (%)
Data Table on India - Year-over-year growth 2025-2030 (%)

12.3.4 South Korea - Market size and forecast 2025-2030

Chart on South Korea - Market size and forecast 2025-2030 ($ million)
Data Table on South Korea - Market size and forecast 2025-2030 ($ million)
Chart on South Korea - Year-over-year growth 2025-2030 (%)
Data Table on South Korea - Year-over-year growth 2025-2030 (%)

12.3.5 Australia - Market size and forecast 2025-2030

Chart on Australia - Market size and forecast 2025-2030 ($ million)
Data Table on Australia - Market size and forecast 2025-2030 ($ million)
Chart on Australia - Year-over-year growth 2025-2030 (%)
Data Table on Australia - Year-over-year growth 2025-2030 (%)

12.3.6 Indonesia - Market size and forecast 2025-2030

Chart on Indonesia - Market size and forecast 2025-2030 ($ million)
Data Table on Indonesia - Market size and forecast 2025-2030 ($ million)
Chart on Indonesia - Year-over-year growth 2025-2030 (%)
Data Table on Indonesia - Year-over-year growth 2025-2030 (%)

12.4 North America - Market size and forecast 2025-2030

Chart on North America - Market size and forecast 2025-2030 ($ million)
Data Table on North America - Market size and forecast 2025-2030 ($ million)
Chart on North America - Year-over-year growth 2025-2030 (%)
Data Table on North America - Year-over-year growth 2025-2030 (%)
Chart on Regional Comparison - North America
Data Table on Regional Comparison - North America

12.4.1 US - Market size and forecast 2025-2030

Chart on US - Market size and forecast 2025-2030 ($ million)
Data Table on US - Market size and forecast 2025-2030 ($ million)
Chart on US - Year-over-year growth 2025-2030 (%)
Data Table on US - Year-over-year growth 2025-2030 (%)

12.4.2 Canada - Market size and forecast 2025-2030

Chart on Canada - Market size and forecast 2025-2030 ($ million)
Data Table on Canada - Market size and forecast 2025-2030 ($ million)
Chart on Canada - Year-over-year growth 2025-2030 (%)
Data Table on Canada - Year-over-year growth 2025-2030 (%)

12.4.3 Mexico - Market size and forecast 2025-2030

Chart on Mexico - Market size and forecast 2025-2030 ($ million)
Data Table on Mexico - Market size and forecast 2025-2030 ($ million)
Chart on Mexico - Year-over-year growth 2025-2030 (%)
Data Table on Mexico - Year-over-year growth 2025-2030 (%)

12.5 Europe - Market size and forecast 2025-2030

Chart on Europe - Market size and forecast 2025-2030 ($ million)
Data Table on Europe - Market size and forecast 2025-2030 ($ million)
Chart on Europe - Year-over-year growth 2025-2030 (%)
Data Table on Europe - Year-over-year growth 2025-2030 (%)
Chart on Regional Comparison - Europe
Data Table on Regional Comparison - Europe

12.5.1 Germany - Market size and forecast 2025-2030

Chart on Germany - Market size and forecast 2025-2030 ($ million)
Data Table on Germany - Market size and forecast 2025-2030 ($ million)
Chart on Germany - Year-over-year growth 2025-2030 (%)
Data Table on Germany - Year-over-year growth 2025-2030 (%)

12.5.2 France - Market size and forecast 2025-2030

Chart on France - Market size and forecast 2025-2030 ($ million)
Data Table on France - Market size and forecast 2025-2030 ($ million)
Chart on France - Year-over-year growth 2025-2030 (%)
Data Table on France - Year-over-year growth 2025-2030 (%)

12.5.3 UK - Market size and forecast 2025-2030

Chart on UK - Market size and forecast 2025-2030 ($ million)
Data Table on UK - Market size and forecast 2025-2030 ($ million)
Chart on UK - Year-over-year growth 2025-2030 (%)
Data Table on UK - Year-over-year growth 2025-2030 (%)

12.5.4 Italy - Market size and forecast 2025-2030

Chart on Italy - Market size and forecast 2025-2030 ($ million)
Data Table on Italy - Market size and forecast 2025-2030 ($ million)
Chart on Italy - Year-over-year growth 2025-2030 (%)
Data Table on Italy - Year-over-year growth 2025-2030 (%)

12.5.5 Spain - Market size and forecast 2025-2030

Chart on Spain - Market size and forecast 2025-2030 ($ million)
Data Table on Spain - Market size and forecast 2025-2030 ($ million)
Chart on Spain - Year-over-year growth 2025-2030 (%)
Data Table on Spain - Year-over-year growth 2025-2030 (%)

12.5.6 The Netherlands - Market size and forecast 2025-2030

Chart on The Netherlands - Market size and forecast 2025-2030 ($ million)
Data Table on The Netherlands - Market size and forecast 2025-2030 ($ million)
Chart on The Netherlands - Year-over-year growth 2025-2030 (%)
Data Table on The Netherlands - Year-over-year growth 2025-2030 (%)

12.6 Middle East and Africa - Market size and forecast 2025-2030

Chart on Middle East and Africa - Market size and forecast 2025-2030 ($ million)
Data Table on Middle East and Africa - Market size and forecast 2025-2030 ($ million)
Chart on Middle East and Africa - Year-over-year growth 2025-2030 (%)
Data Table on Middle East and Africa - Year-over-year growth 2025-2030 (%)
Chart on Regional Comparison - Middle East and Africa
Data Table on Regional Comparison - Middle East and Africa

12.6.1 Saudi Arabia - Market size and forecast 2025-2030

Chart on Saudi Arabia - Market size and forecast 2025-2030 ($ million)
Data Table on Saudi Arabia - Market size and forecast 2025-2030 ($ million)
Chart on Saudi Arabia - Year-over-year growth 2025-2030 (%)
Data Table on Saudi Arabia - Year-over-year growth 2025-2030 (%)

12.6.2 UAE - Market size and forecast 2025-2030

Chart on UAE - Market size and forecast 2025-2030 ($ million)
Data Table on UAE - Market size and forecast 2025-2030 ($ million)
Chart on UAE - Year-over-year growth 2025-2030 (%)
Data Table on UAE - Year-over-year growth 2025-2030 (%)

12.6.3 South Africa - Market size and forecast 2025-2030

Chart on South Africa - Market size and forecast 2025-2030 ($ million)
Data Table on South Africa - Market size and forecast 2025-2030 ($ million)
Chart on South Africa - Year-over-year growth 2025-2030 (%)
Data Table on South Africa - Year-over-year growth 2025-2030 (%)

12.6.4 Israel - Market size and forecast 2025-2030

Chart on Israel - Market size and forecast 2025-2030 ($ million)
Data Table on Israel - Market size and forecast 2025-2030 ($ million)
Chart on Israel - Year-over-year growth 2025-2030 (%)
Data Table on Israel - Year-over-year growth 2025-2030 (%)

12.6.5 Turkey - Market size and forecast 2025-2030

Chart on Turkey - Market size and forecast 2025-2030 ($ million)
Data Table on Turkey - Market size and forecast 2025-2030 ($ million)
Chart on Turkey - Year-over-year growth 2025-2030 (%)
Data Table on Turkey - Year-over-year growth 2025-2030 (%)

12.7 South America - Market size and forecast 2025-2030

Chart on South America - Market size and forecast 2025-2030 ($ million)
Data Table on South America - Market size and forecast 2025-2030 ($ million)
Chart on South America - Year-over-year growth 2025-2030 (%)
Data Table on South America - Year-over-year growth 2025-2030 (%)
Chart on Regional Comparison - South America
Data Table on Regional Comparison - South America

12.7.1 Brazil - Market size and forecast 2025-2030

Chart on Brazil - Market size and forecast 2025-2030 ($ million)
Data Table on Brazil - Market size and forecast 2025-2030 ($ million)
Chart on Brazil - Year-over-year growth 2025-2030 (%)
Data Table on Brazil - Year-over-year growth 2025-2030 (%)

12.7.2 Argentina - Market size and forecast 2025-2030

Chart on Argentina - Market size and forecast 2025-2030 ($ million)
Data Table on Argentina - Market size and forecast 2025-2030 ($ million)
Chart on Argentina - Year-over-year growth 2025-2030 (%)
Data Table on Argentina - Year-over-year growth 2025-2030 (%)

12.7.3 Colombia - Market size and forecast 2025-2030

Chart on Colombia - Market size and forecast 2025-2030 ($ million)
Data Table on Colombia - Market size and forecast 2025-2030 ($ million)
Chart on Colombia - Year-over-year growth 2025-2030 (%)
Data Table on Colombia - Year-over-year growth 2025-2030 (%)

12.8 Market opportunity by geography

Market opportunity by geography ($ million)
Data Tables on Market opportunity by geography ($ million)

13. Drivers, Challenges, and Opportunity

13.1 Market drivers

Labor shortages and strategic shift to workforce augmentation
Integration of generative AI and software-defined automation
Imperative for flexible manufacturing and modular production architectures

13.2 Market challenges

High initial capital expenditure and economic hesitancy
Integration complexities within brownfield environments
Escalating cybersecurity threats and safety compliance

13.3 Impact of drivers and challenges

Impact of drivers and challenges in 2025 and 2030

13.4 Market opportunities

Emergence of generative copilots in engineering workflows
Shift from linear conveyors to matrix production and autonomous logistics
Rise of physical AI and high-performance collaborative robotics

14. Competitive Landscape

14.1 Overview

14.2

Overview on criticality of inputs and factors of differentiation

14.3 Landscape disruption

Overview on factors of disruption

14.4 Industry risks

Impact of key risks on business

15. Competitive Analysis

15.1 Companies profiled

Companies covered

15.2 Company ranking index

15.3 Market positioning of companies

Matrix on companies position and classification

15.4 ABB Ltd.

ABB Ltd. - Overview
ABB Ltd. - Business segments
ABB Ltd. - Key news
ABB Ltd. - Key offerings
ABB Ltd. - Segment focus
SWOT

15.5 Comau Spa

Comau Spa - Overview
Comau Spa - Product / Service
Comau Spa - Key offerings
SWOT

15.6 DENSO Corp.

DENSO Corp. - Overview
DENSO Corp. - Business segments
DENSO Corp. - Key news
DENSO Corp. - Key offerings
DENSO Corp. - Segment focus
SWOT

15.7 Durr AG

Durr AG - Overview
Durr AG - Business segments
Durr AG - Key offerings
Durr AG - Segment focus
SWOT

15.8 Emerson Electric Co.

Emerson Electric Co. - Overview
Emerson Electric Co. - Business segments
Emerson Electric Co. - Key news
Emerson Electric Co. - Key offerings
Emerson Electric Co. - Segment focus
SWOT

15.9 Epson Corp.

Epson Corp. - Overview
Epson Corp. - Business segments
Epson Corp. - Key news
Epson Corp. - Key offerings
Epson Corp. - Segment focus
SWOT

15.10 FANUC Corp.

FANUC Corp. - Overview
FANUC Corp. - Business segments
FANUC Corp. - Key offerings
FANUC Corp. - Segment focus
SWOT

15.11 GROB WERKE GmbH

GROB WERKE GmbH - Overview
GROB WERKE GmbH - Product / Service
GROB WERKE GmbH - Key offerings
SWOT

15.12 Honeywell International Inc.

Honeywell International Inc. - Overview
Honeywell International Inc. - Business segments
Honeywell International Inc. - Key news
Honeywell International Inc. - Key offerings
Honeywell International Inc. - Segment focus
SWOT

15.13 Keyence Corp.

Keyence Corp. - Overview
Keyence Corp. - Product / Service
Keyence Corp. - Key offerings
SWOT

15.14 KUKA AG

KUKA AG - Overview
KUKA AG - Business segments
KUKA AG - Key offerings
KUKA AG - Segment focus
SWOT

15.15 Mitsubishi Electric Corp.

Mitsubishi Electric Corp. - Overview
Mitsubishi Electric Corp. - Business segments
Mitsubishi Electric Corp. - Key offerings
Mitsubishi Electric Corp. - Segment focus
SWOT

15.16 OMRON Corp.

OMRON Corp. - Overview
OMRON Corp. - Business segments
OMRON Corp. - Key news
OMRON Corp. - Key offerings
OMRON Corp. - Segment focus
SWOT

15.17 Panasonic Holdings Corp.

Panasonic Holdings Corp. - Overview
Panasonic Holdings Corp. - Business segments
Panasonic Holdings Corp. - Key news
Panasonic Holdings Corp. - Key offerings
Panasonic Holdings Corp. - Segment focus
SWOT

15.18 Rockwell Automation Inc.

Rockwell Automation Inc. - Overview
Rockwell Automation Inc. - Business segments
Rockwell Automation Inc. - Key news
Rockwell Automation Inc. - Key offerings
Rockwell Automation Inc. - Segment focus
SWOT

16. Appendix

16.1 Scope of the report

Market definition
Objectives
Notes and caveats

16.2 Inclusions and exclusions checklist

Inclusions checklist
Exclusions checklist

16.3 Currency conversion rates for US$

16.4 Research methodology

16.5 Data procurement

Information sources

16.6 Data validation

16.7 Validation techniques employed for market sizing

16.8 Data synthesis

16.9 360 degree market analysis

16.10 List of abbreviations

Research Methodology

Technavio presents a detailed picture of the market by way of study, synthesis, and summation of data from multiple sources. The analysts have presented the various facets of the market with a particular focus on identifying the key industry influencers. The data thus presented is comprehensive, reliable, and the result of extensive research, both primary and secondary.

INFORMATION SOURCES

Primary sources

  • Manufacturers and suppliers
  • Channel partners
  • Industry experts
  • Strategic decision makers

Secondary sources

  • Industry journals and periodicals
  • Government data
  • Financial reports of key industry players
  • Historical data
  • Press releases

DATA ANALYSIS

Data Synthesis

  • Collation of data
  • Estimation of key figures
  • Analysis of derived insights

Data Validation

  • Triangulation with data models
  • Reference against proprietary databases
  • Corroboration with industry experts

REPORT WRITING

Qualitative

  • Market drivers
  • Market challenges
  • Market trends
  • Five forces analysis

Quantitative

  • Market size and forecast
  • Market segmentation
  • Geographical insights
  • Competitive landscape

Interested in this report?

Get your sample now to see our research methodology and insights!

Download Now

Frequently Asked Questions

Assembly Automation market growth will increase by USD 28393.5 million during 2026-2030 .

The Assembly Automation market is expected to grow at a CAGR of 9.5% during 2026-2030 .

Assembly Automation market is segmented by Component (Robot automation equipment, Central control system, Others) End-user (Automotive, Electronics, Healthcare, Aerospace and defense, Others) Business segment (Large enterprises, Small and medium enterprises)

ABB Ltd., Comau Spa, DENSO Corp., Durr AG, Emerson Electric Co., Epson Corp., FANUC Corp., GROB WERKE GmbH, Honeywell International Inc., Keyence Corp., KUKA AG, Mitsubishi Electric Corp., OMRON Corp., Panasonic Holdings Corp., Rockwell Automation Inc., Schneider Electric SE, Siemens AG, Staubli International, Universal Robots AS, YASKAWA ELECTRIC CO. are a few of the key vendors in the Assembly Automation market.

APAC will register the highest growth rate of 54.9% among the other regions. Therefore, the Assembly Automation market in APAC is expected to garner significant business opportunities for the vendors during the forecast period.

China, Japan, India, South Korea, Australia, Indonesia, US, Canada, Mexico, Germany, France, UK, Italy, Spain, The Netherlands, Saudi Arabia, UAE, South Africa, Israel, Turkey, Brazil, Argentina, Colombia

  • Labor shortages and strategic shift to workforce augmentation is the driving factor this market.

The Assembly Automation market vendors should focus on grabbing business opportunities from the Component segment as it accounted for the largest market share in the base year.