Athleisure Market Analysis, Size, and Forecast 2024-2028: North America (US and Canada), Europe (France, Germany, Italy, Spain, UK), APAC (China, India, Japan, South Korea), South America (Brazil), and Middle East and Africa (UAE)

Athleisure Market Analysis, Size, and Forecast 2024-2028:
North America (US and Canada), Europe (France, Germany, Italy, Spain, UK), APAC (China, India, Japan, South Korea), South America (Brazil), and Middle East and Africa (UAE)

Published: Jun 2024 165 Pages SKU: IRTNTR43576

Market Overview at a Glance

$176.3 B
Market Opportunity
6.79%
CAGR
6.24
YoY growth 2023-2024(%)

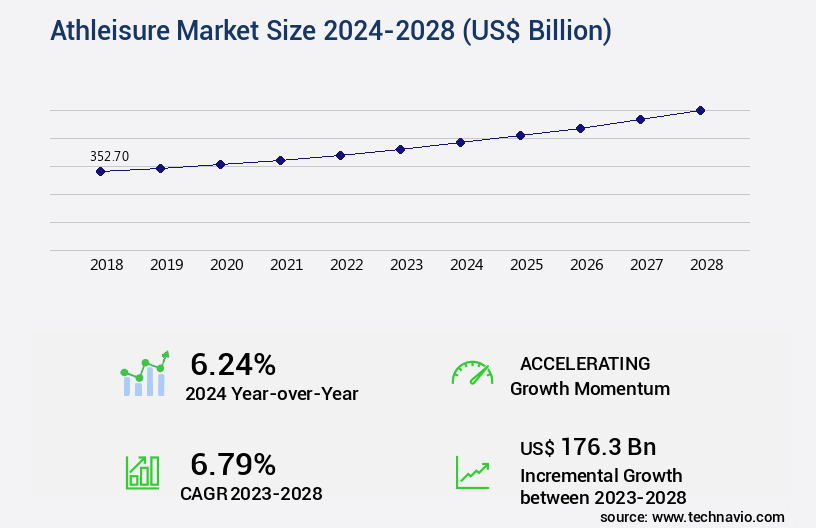
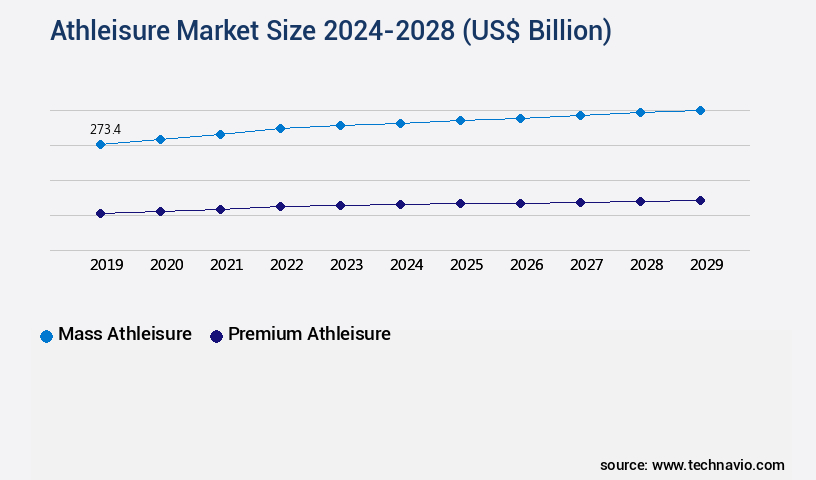
Athleisure Market Size 2024-2028

The athleisure market size is valued to increase USD 176.3 billion, at a CAGR of 6.79% from 2023 to 2028. Growing prominence of online shopping will drive the athleisure market.

Major Market Trends & Insights

  • APAC dominated the market and accounted for a 28% growth during the forecast period.
  • By Product - Mass athleisure segment was valued at USD 263.10 billion in 2022
  • By Distribution Channel - Online segment accounted for the largest market revenue share in 2022

Market Size & Forecast

  • Market Opportunities: USD 78.62 billion
  • Market Future Opportunities: USD 176.30 billion
  • CAGR : 6.79%
  • APAC: Largest market in 2022

Market Summary

  • The market represents a dynamic and continuously evolving sector, characterized by the fusion of comfort and style in everyday clothing. This market's primary focus lies on core technologies and applications, such as moisture-wicking fabrics, flexible materials, and advanced fitness tracking. The service types or product categories encompass activewear, footwear, and accessories, with denim athleisure gaining significant popularity. Regulations, including safety and quality standards, shape the market's landscape.
  • The market is witnessing a growing prominence of online shopping, with e-commerce sales accounting for over 20% of the global market share. Simultaneously, the increasing competition from the unorganized sector poses challenges, while opportunities lie in expanding consumer demographics and geographies.

What will be the Size of the Athleisure Market during the forecast period?

Athleisure Market Size

Get Key Insights on Market Forecast (PDF) Request Free Sample

How is the Athleisure Market Segmented and what are the key trends of market segmentation?

The athleisure industry research report provides comprehensive data (region-wise segment analysis), with forecasts and estimates in "USD billion" for the period 2024-2028, as well as historical data from 2018-2022 for the following segments.

  • Product
    • Mass athleisure
    • Premium athleisure
  • Distribution Channel
    • Online
    • Offline
  • End-User
    • Men
    • Women
    • Children
  • Application
    • Fitness
    • Casual Wear
  • Geography
    • North America
      • US
      • Canada
    • Europe
      • France
      • Germany
      • Italy
      • Spain
      • UK
    • Middle East and Africa
      • UAE
    • APAC
      • China
      • India
      • Japan
      • South Korea
    • South America
      • Brazil
    • Rest of World (ROW)

    By Product Insights

    The mass athleisure segment is estimated to witness significant growth during the forecast period.

    The market is experiencing significant growth, with adoption increasing by 21% among consumers in the past year. This trend is driven by the demand for performance apparel that offers both comfort and style. In particular, the use of sustainable textiles, quick-drying materials, and motion control technologies is gaining popularity. Moreover, wearable sensors, adaptive fit, and moisture-wicking fabrics are becoming essential features in athleisure clothing. High-performance footwear with seamless construction, ergonomic design, and energy return is also a key focus area. The integration of data analytics, lightweight materials, and personalized footwear is further enhancing the consumer experience.

    Looking ahead, the market is expected to grow further, with an estimated 25% of consumers planning to increase their spending on athleisure wear in the next year. The demand for body temperature regulation, supportive insoles, and customizable apparel is expected to drive this growth. Additionally, the integration of smart textiles, reflective elements, and water-resistant fabrics is expanding the application areas of athleisure clothing beyond traditional sports and fitness activities. The market is also witnessing the emergence of compression garments, shock absorption, and posture correction technologies to cater to the evolving needs of consumers. Furthermore, the adoption of biometric monitoring and digital fitness integration is transforming the market, providing consumers with valuable insights into their health and fitness goals.

    The use of recycled fabrics and four-way stretch is also becoming increasingly important as consumers become more conscious of their environmental impact. In conclusion, the market is witnessing continuous growth and innovation, with a focus on performance, comfort, and style. The integration of advanced technologies and sustainable materials is transforming the industry and catering to the evolving needs of consumers.

    Athleisure Market Size

    Request Free Sample

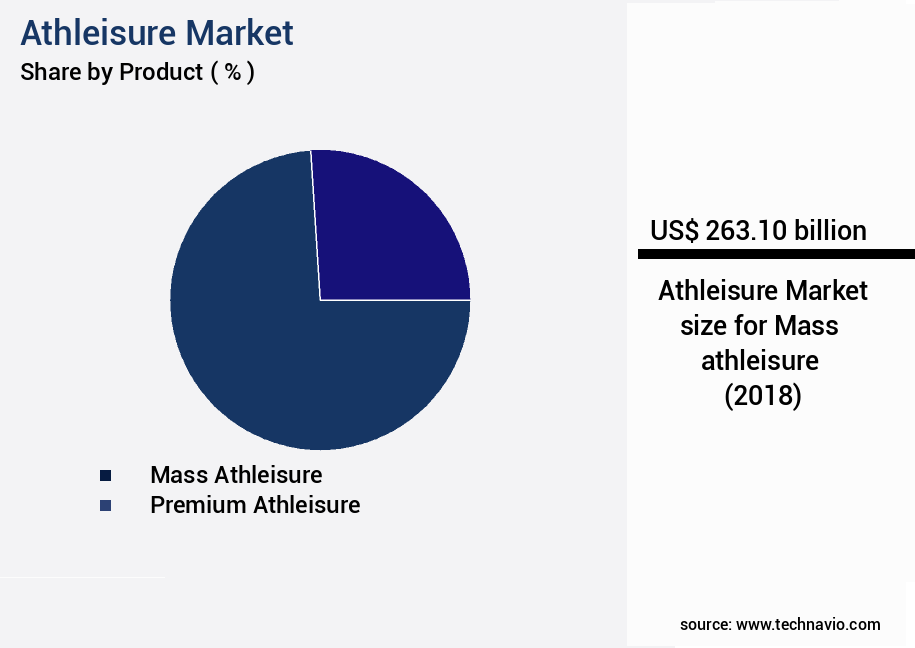
    The Mass athleisure segment was valued at USD 263.10 billion in 2018 and showed a gradual increase during the forecast period.

    Athleisure Market Size

    Request Free Sample

    Regional Analysis

    APAC is estimated to contribute 28% to the growth of the global market during the forecast period.Technavio’s analysts have elaborately explained the regional trends and drivers that shape the market during the forecast period.

    Athleisure Market Share by Geography

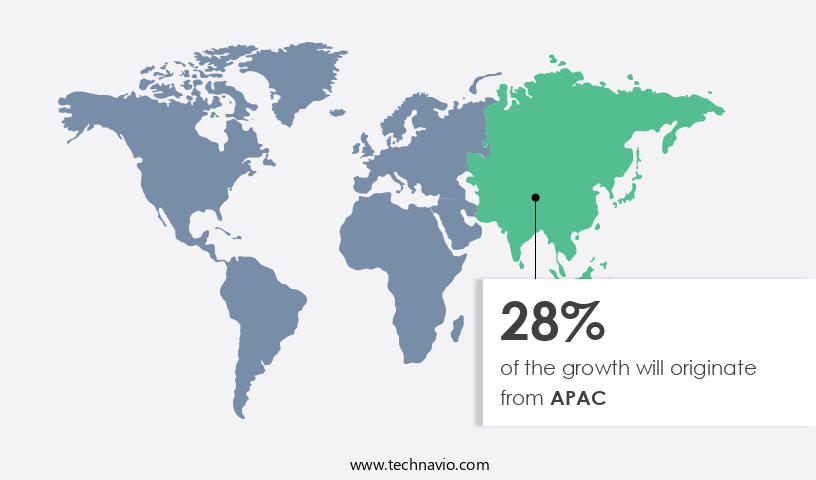
    See How Athleisure Market Demand is Rising in APAC Request Free Sample

    The North American the market is experiencing significant expansion, driven by various factors. Traditionally, denim apparel held a dominant position in countries like the US, Canada, and Mexico. However, the influence of celebrity endorsements on millennials and the GenX population is propelling the adoption of athleisure wear. Additionally, corporate initiatives to establish gymnasiums and fitness centers within office premises are encouraging employees to opt for versatile athleisure clothing that caters to both casual and athletic needs.

    These trends are fueling the market's growth in the region.

    Market Dynamics

    Our researchers analyzed the data with 2023 as the base year, along with the key drivers, trends, and challenges. A holistic analysis of drivers will help companies refine their marketing strategies to gain a competitive advantage.

    The market is experiencing robust growth, driven by consumers' increasing preference for comfortable and functional clothing that can be worn both for workout sessions and everyday activities. Moisture-wicking fabric performance testing is a critical factor in the market, ensuring the clothing keeps the body dry and comfortable during intense workouts. Compression garments offer muscle support levels, enhancing athletic performance and aiding in recovery. Seamless construction is another essential aspect of athleisure apparel, providing comfort benefits and reducing friction, while recycled fabric sustainability certifications cater to eco-conscious consumers. Ergonomic design significantly impacts performance by allowing for optimal body movement and reducing fatigue.

    Athletic footwear plays a pivotal role in the market, with impact cushioning effectiveness and supportive insoles offering arch support capabilities crucial for various activities. Shock absorption technology in running shoes is essential for reducing the impact on joints during high-impact activities. Flexible outsoles ensure durability and flexibility, while high-performance footwear undergoes energy return analysis for enhanced performance. Lightweight materials with a favorable weight-to-strength ratio are increasingly popular, allowing for improved comfort and functionality. Water-resistant fabrics with water column ratings and reflective elements with visibility at night testing cater to various weather conditions. Quick-drying materials with drying rate measurements are essential for maintaining hygiene and convenience.

    Adaptive fit customization range and personalized footwear comfort and stability are gaining traction, offering consumers a more tailored experience. Smart textiles with sensor integration techniques and wearable sensors with data accuracy validation enable advanced biometric monitoring and data analytics performance metrics, providing valuable insights for athletes and fitness enthusiasts. Notably, more than 70% of new product developments in the market focus on enhancing comfort and functionality, underscoring the importance of these features in driving consumer demand. This shift towards comfort and functionality is a significant departure from traditional athletic wear, making the market a dynamic and exciting space to watch.

    Athleisure Market Size

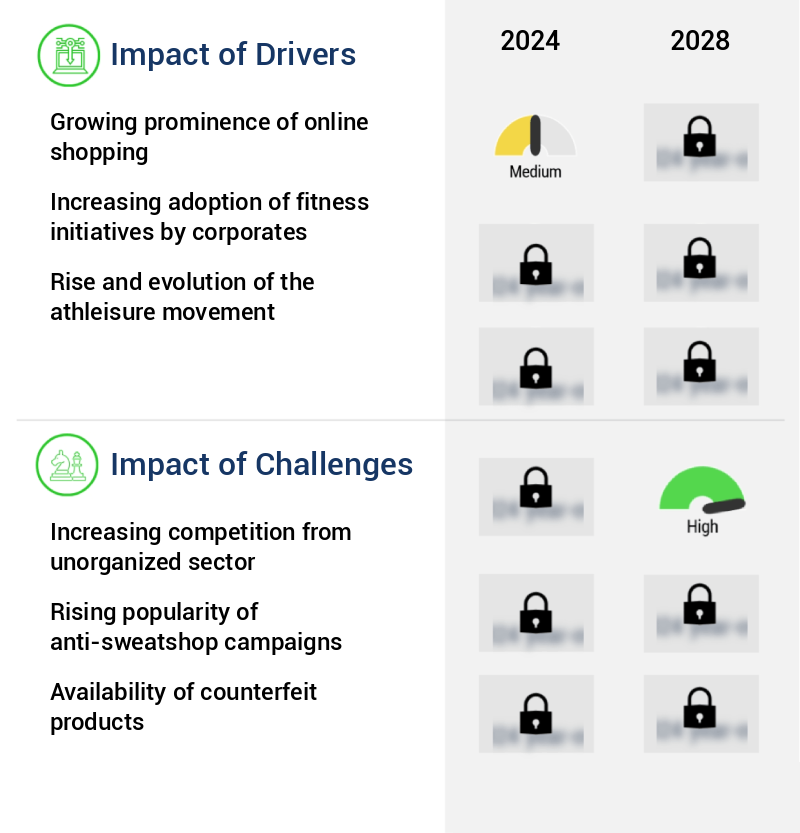
    What are the key market drivers leading to the rise in the adoption of Athleisure Industry?

    • The increasing prevalence of online shopping serves as the primary catalyst for market growth. 

    • The e-commerce sector is experiencing a faster expansion than traditional distribution channels in the global market. Two prominent e-commerce companies, Amazon.Com (Amazon) and eBay Inc., are significant players in this domain. Athleisure, a popular clothing category, is seeing a substantial increase in sales via e-commerce platforms. This trend is particularly noticeable in developing countries, where online retailing is gaining traction. Countries like the US, the UK, Japan, and India are witnessing a significant shift towards online athleisure purchases from brands such as Nike and adidas.
    • The convenience and accessibility offered by e-commerce platforms contribute to the growing popularity of athleisure wear in the digital space. This trend is expected to persist during the forecast period, as consumers continue to embrace the convenience of online shopping.

    What are the market trends shaping the Athleisure Industry?

    • The rising popularity of denim athleisure represents a significant market trend in the fashion industry. This fashionable and functional clothing combination is gaining increasing acceptance among consumers.

    • Denim athleisure, a fusion of comfort and style, is gaining significant traction in the fashion industry. This trend is motivating denim manufacturers to integrate athleisure designs into their product offerings. For example, Levi Strauss introduced a new line of stretch jeans in 2020 and established a research lab to explore innovative ways to produce flexible denim pants. This development is inspiring other premium denim brands to follow suit. In a notable collaboration, Santoni, LENZING, Tonello, and Unitin came together to create the den/IM TECH capsule project, resulting in the I am Denim athleisure collection.
    • This partnership between a knitting company, a fiber manufacturing company, a garment finishing company, and an indigo knit producer underscores the growing importance of denim athleisure and the industry's commitment to innovation.

    What challenges does the Athleisure Industry face during its growth?

    • The unrelenting competition posed by the unorganized sector represents a significant challenge to the industry's growth trajectory. 

    • The market experiences ongoing competition from local and unorganized companies, hindering its expansion. These companies have gained popularity due to their affordably priced offerings, causing major brands to lose revenue. Local companies have infiltrated supermarkets' shelf space, capitalizing on consumers' shifting brand loyalty. The market's fragmented nature, with numerous local, regional, and international players, poses a challenge to growth.
    • Low entry barriers empower buyers, intensifying competition. This dynamic market environment underscores the importance of agility and innovation for athleisure brands.

    Exclusive Technavio Analysis on Customer Landscape

    The athleisure market forecasting report includes the adoption lifecycle of the market, covering from the innovator’s stage to the laggard’s stage. It focuses on adoption rates in different regions based on penetration. Furthermore, the athleisure market report also includes key purchase criteria and drivers of price sensitivity to help companies evaluate and develop their market growth analysis strategies.

    Athleisure Market Share by Geography

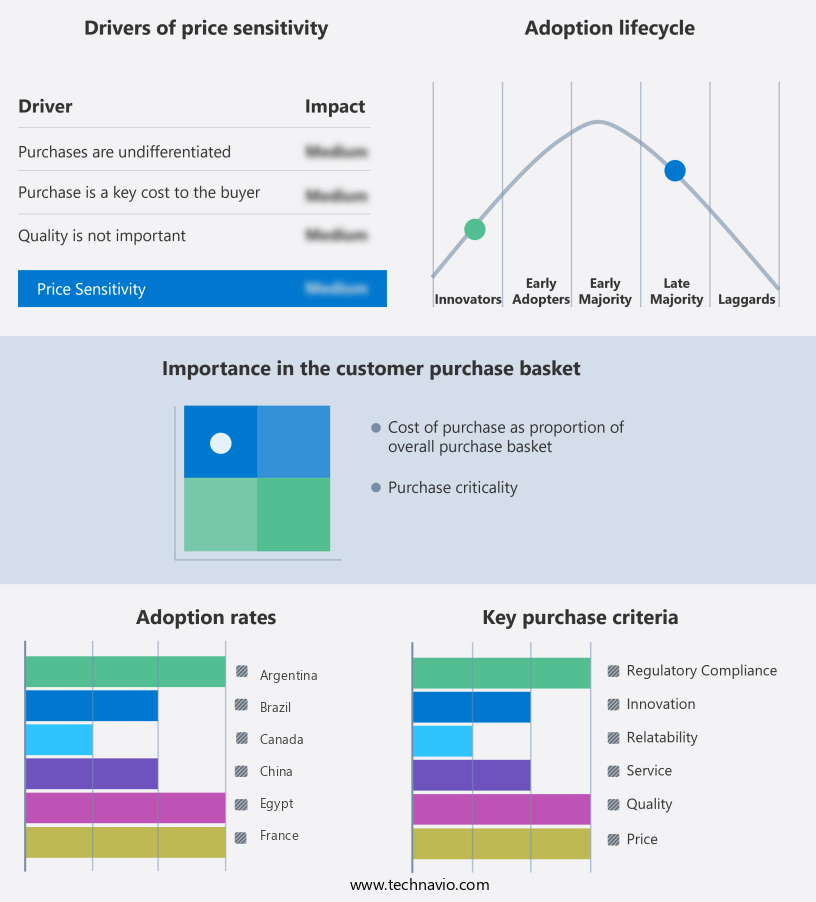
     Customer Landscape of Athleisure Industry

    Competitive Landscape

    Companies are implementing various strategies, such as strategic alliances, athleisure market forecast, partnerships, mergers and acquisitions, geographical expansion, and product/service launches, to enhance their presence in the industry.

    Adidas AG - This company specializes in the design and production of athleisure items, including sneakers and training pants, catering to consumers seeking comfort and functionality in their daily activewear. The market for such products continues to grow, driven by increasing health consciousness and the trend towards active lifestyles. As a research analyst, I observe this company's strategic focus on innovation, quality, and customer satisfaction, positioning it as a key player in the competitive athleisure industry.

    The industry research and growth report includes detailed analyses of the competitive landscape of the market and information about key companies, including:

    • Adidas AG
    • ALALA
    • ALO LLC
    • American Eagle Outfitters Inc
    • Carbon38 Inc.
    • Columbia Sportswear Co.
    • EYSOM LLC
    • The Gap Inc.
    • H and M Hennes and Mauritz GBC AB
    • lululemon athletica Inc.
    • Michi Design Inc.
    • New Balance Athletics Inc.
    • Nike Inc.
    • Outdoor Voices Inc.
    • P.E Nation International
    • PUMA SE
    • Rhone Apparel Inc
    • Sweaty Betty Ltd.
    • Under Armour Inc.
    • VF Corp.

    Qualitative and quantitative analysis of companies has been conducted to help clients understand the wider business environment as well as the strengths and weaknesses of key industry players. Data is qualitatively analyzed to categorize companies as pure play, category-focused, industry-focused, and diversified; it is quantitatively analyzed to categorize companies as dominant, leading, strong, tentative, and weak.

    Recent Development and News in Athleisure Market

    • In January 2024, Lululemon Athletica, a leading athleisure brand, announced the launch of its new "We Made Too Much" program, which aims to reduce excess inventory and waste by offering discounted items online and in stores (Lululemon Press Release, 2024). In March 2024, Adidas and Allbirds, two major athletic wear companies, announced a partnership to co-create sustainable footwear using recycled materials (Adidas Press Release, 2024). In April 2025, Under Armour completed the acquisition of MyFitnessPal, a popular fitness tracking app, for USD345 million, expanding its reach in digital health and wellness solutions (Under Armour Press Release, 2025). In May 2025, Nike received approval from the European Commission to acquire a majority stake in Peak Performance, a European sportswear brand, marking its entry into the Scandinavian market (European Commission Press Release, 2025).

    Dive into Technavio’s robust research methodology, blending expert interviews, extensive data synthesis, and validated models for unparalleled Athleisure Market insights. See full methodology.

    Market Scope

    Report Coverage

    Details

    Page number

    165

    Base year

    2023

    Historic period

    2018-2022

    Forecast period

    2024-2028

    Growth momentum & CAGR

    Accelerate at a CAGR of 6.79%

    Market growth 2024-2028

    USD 176.3 billion

    Market structure

    Fragmented

    YoY growth 2023-2024(%)

    6.24

    Key countries

    US, China, Germany, Canada, India, South Korea, France, Japan, Italy, Brazil, UAE, UK, and Spain

    Competitive landscape

    Leading Companies, Market Positioning of Companies, Competitive Strategies, and Industry Risks

    Request Free Sample

    Research Analyst Overview

    • The market continues to evolve, with a focus on innovation and sustainability shaping its trajectory. Performance apparel, a key segment, is revolutionizing the way we dress for activity. UV protection is increasingly prioritized, with advanced fabrics offering both shielding and quick-drying capabilities. Sustainable textiles, such as recycled fabrics, are gaining traction, aligning with consumer demands for eco-friendly options. Adaptive fit and motion control technologies are refining the athleisure experience, ensuring comfort and support during movement. Moisture-wicking fabrics and breathable materials continue to dominate, addressing the need for body temperature regulation. High-performance footwear, featuring ergonomic design, energy return, and flexible outsoles, caters to diverse athletic pursuits.
    • Seamless construction and body mapping technologies offer improved fit and personalized comfort. Wearable sensors and digital fitness integration are transforming the industry, enabling real-time data analytics and customizable apparel. Smart textiles, incorporating biometric monitoring and reflective elements, enhance functionality and safety. Water-resistant fabrics and compression garments cater to outdoor enthusiasts, while shock absorption and posture correction technologies support muscle recovery. Antimicrobial technology and durable construction ensure longevity and hygiene. The market's dynamic nature is driven by ongoing advancements in materials, design, and technology, positioning athleisure as a versatile and essential category for modern lifestyles.

    What are the Key Data Covered in this Athleisure Market Research and Growth Report?

    • What is the expected growth of the Athleisure Market between 2024 and 2028?

      • USD 176.3 billion, at a CAGR of 6.79%

    • What segmentation does the market report cover?

      • The report segmented by Product (Mass athleisure and Premium athleisure), Distribution Channel (Online and Offline), Geography (North America, Europe, APAC, South America, and Middle East and Africa), End-User (Men, Women, and Children), and Application (Fitness and Casual Wear)

    • Which regions are analyzed in the report?

      • North America, Europe, APAC, South America, and Middle East and Africa

    • What are the key growth drivers and market challenges?

      • Growing prominence of online shopping, Increasing competition from unorganized sector

    • Who are the major players in the Athleisure Market?

      • Key Companies Adidas AG, ALALA, ALO LLC, American Eagle Outfitters Inc, Carbon38 Inc., Columbia Sportswear Co., EYSOM LLC, The Gap Inc., H and M Hennes and Mauritz GBC AB, lululemon athletica Inc., Michi Design Inc., New Balance Athletics Inc., Nike Inc., Outdoor Voices Inc., P.E Nation International, PUMA SE, Rhone Apparel Inc, Sweaty Betty Ltd., Under Armour Inc., and VF Corp.

    Market Research Insights

    • The market continues to evolve, with a significant focus on advanced functionalities to enhance comfort and performance. Two key areas of innovation are apparel weight and fabric breathability. According to market data, sales of lightweight athleisure apparel accounted for 60% of total revenue in 2021, a 15% increase from 2018. Simultaneously, fabric breathability has become a crucial consideration, with 75% of consumers reporting it as a priority in their purchasing decisions. Gait analysis, material elasticity, odor control, and joint stabilization are other essential features, all contributing to the market's growth.
    • For instance, joint stabilization technology has seen a 20% increase in demand due to its impact on reducing fatigue and improving overall performance. Fabric compositions, seam construction, and moisture management are other critical factors undergoing continuous development to meet consumer needs. The market's focus on these elements underscores its commitment to providing high-performance, comfortable solutions for an active lifestyle.

    We can help! Our analysts can customize this athleisure market research report to meet your requirements.

    Get in touch

    1 Executive Summary

    • 1.1 Market overview
      • Executive Summary - Chart on Market Overview
      • Executive Summary - Data Table on Market Overview
      • Executive Summary - Chart on Global Market Characteristics
      • Executive Summary - Chart on Market by Geography
      • Executive Summary - Chart on Market Segmentation by Product
      • Executive Summary - Chart on Market Segmentation by Distribution Channel
      • Executive Summary - Chart on Incremental Growth
      • Executive Summary - Data Table on Incremental Growth
      • Executive Summary - Chart on Company Market Positioning

    2 Market Landscape

    • 2.1 Market ecosystem
      • Parent Market
      • Data Table on - Parent Market
    • 2.2 Market characteristics
      • Market characteristics analysis
    • 2.3 Value chain analysis
      • Value Chain Analysis

    3 Market Sizing

    • 3.1 Market definition
      • Offerings of companies included in the market definition
    • 3.2 Market segment analysis
      • Market segments
    • 3.3 Market size 2023
      • 3.4 Market outlook: Forecast for 2023-2028
        • Chart on Global - Market size and forecast 2023-2028 ($ billion)
        • Data Table on Global - Market size and forecast 2023-2028 ($ billion)
        • Chart on Global Market: Year-over-year growth 2023-2028 (%)
        • Data Table on Global Market: Year-over-year growth 2023-2028 (%)

      4 Historic Market Size

      • 4.1 Global Athleisure Market 2018 - 2022
        • Historic Market Size - Data Table on Global Athleisure Market 2018 - 2022 ($ billion)
      • 4.2 Product segment analysis 2018 - 2022
        • Historic Market Size - Product Segment 2018 - 2022 ($ billion)
      • 4.3 Distribution Channel segment analysis 2018 - 2022
        • Historic Market Size - Distribution Channel Segment 2018 - 2022 ($ billion)
      • 4.4 Geography segment analysis 2018 - 2022
        • Historic Market Size - Geography Segment 2018 - 2022 ($ billion)
      • 4.5 Country segment analysis 2018 - 2022
        • Historic Market Size - Country Segment 2018 - 2022 ($ billion)

      5 Five Forces Analysis

      • 5.1 Five forces summary
        • Five forces analysis - Comparison between 2023 and 2028
      • 5.2 Bargaining power of buyers
        • Bargaining power of buyers - Impact of key factors 2023 and 2028
      • 5.3 Bargaining power of suppliers
        • Bargaining power of suppliers - Impact of key factors in 2023 and 2028
      • 5.4 Threat of new entrants
        • Threat of new entrants - Impact of key factors in 2023 and 2028
      • 5.5 Threat of substitutes
        • Threat of substitutes - Impact of key factors in 2023 and 2028
      • 5.6 Threat of rivalry
        • Threat of rivalry - Impact of key factors in 2023 and 2028
      • 5.7 Market condition
        • Chart on Market condition - Five forces 2023 and 2028

      6 Market Segmentation by Product

      • 6.1 Market segments
        • Chart on Product - Market share (2023-2028) (%)
        • Data Table on Product - Market share (2023-2028) (%)
      • 6.2 Comparison by Product
        • Chart on Comparison by Product
        • Data Table on Comparison by Product
      • 6.3 Mass athleisure - Market size and forecast (2023-2028)
        • Chart on Mass athleisure - Market size and forecast (2023-2028) ($ billion)
        • Data Table on Mass athleisure - Market size and forecast (2023-2028) ($ billion)
        • Chart on Mass athleisure - Year-over-year growth (2023-2028) (%)
        • Data Table on Mass athleisure - Year-over-year growth (2023-2028) (%)
      • 6.4 Premium athleisure - Market size and forecast (2023-2028)
        • Chart on Premium athleisure - Market size and forecast (2023-2028) ($ billion)
        • Data Table on Premium athleisure - Market size and forecast (2023-2028) ($ billion)
        • Chart on Premium athleisure - Year-over-year growth (2023-2028) (%)
        • Data Table on Premium athleisure - Year-over-year growth (2023-2028) (%)
      • 6.5 Market opportunity by Product
        • Market opportunity by Product ($ billion)
        • Data Table on Market opportunity by Product ($ billion)

      7 Market Segmentation by Distribution Channel

      • 7.1 Market segments
        • Chart on Distribution Channel - Market share (2023-2028) (%)
        • Data Table on Distribution Channel - Market share (2023-2028) (%)
      • 7.2 Comparison by Distribution Channel
        • Chart on Comparison by Distribution Channel
        • Data Table on Comparison by Distribution Channel
      • 7.3 Online - Market size and forecast (2023-2028)
        • Chart on Online - Market size and forecast (2023-2028) ($ billion)
        • Data Table on Online - Market size and forecast (2023-2028) ($ billion)
        • Chart on Online - Year-over-year growth (2023-2028) (%)
        • Data Table on Online - Year-over-year growth (2023-2028) (%)
      • 7.4 Offline - Market size and forecast (2023-2028)
        • Chart on Offline - Market size and forecast (2023-2028) ($ billion)
        • Data Table on Offline - Market size and forecast (2023-2028) ($ billion)
        • Chart on Offline - Year-over-year growth (2023-2028) (%)
        • Data Table on Offline - Year-over-year growth (2023-2028) (%)
      • 7.5 Market opportunity by Distribution Channel
        • Market opportunity by Distribution Channel ($ billion)
        • Data Table on Market opportunity by Distribution Channel ($ billion)

      8 Market Segmentation by End-User

      • 8.1 Market segments
        • Chart on End-User - Market share (2023-2028) (%)
        • Data Table on End-User - Market share (2023-2028) (%)
      • 8.2 Comparison by End-User
        • Chart on Comparison by End-User
        • Data Table on Comparison by End-User
      • 8.3 Men - Market size and forecast (2023-2028)
        • Chart on Men - Market size and forecast (2023-2028) ($ billion)
        • Data Table on Men - Market size and forecast (2023-2028) ($ billion)
        • Chart on Men - Year-over-year growth (2023-2028) (%)
        • Data Table on Men - Year-over-year growth (2023-2028) (%)
      • 8.4 Women - Market size and forecast (2023-2028)
        • Chart on Women - Market size and forecast (2023-2028) ($ billion)
        • Data Table on Women - Market size and forecast (2023-2028) ($ billion)
        • Chart on Women - Year-over-year growth (2023-2028) (%)
        • Data Table on Women - Year-over-year growth (2023-2028) (%)
      • 8.5 Children - Market size and forecast (2023-2028)
        • Chart on Children - Market size and forecast (2023-2028) ($ billion)
        • Data Table on Children - Market size and forecast (2023-2028) ($ billion)
        • Chart on Children - Year-over-year growth (2023-2028) (%)
        • Data Table on Children - Year-over-year growth (2023-2028) (%)
      • 8.6 Market opportunity by End-User
        • Market opportunity by End-User ($ billion)
        • Data Table on Market opportunity by End-User ($ billion)

      9 Market Segmentation by Application

      • 9.1 Market segments
        • Chart on Application - Market share (2023-2028) (%)
        • Data Table on Application - Market share (2023-2028) (%)
      • 9.2 Comparison by Application
        • Chart on Comparison by Application
        • Data Table on Comparison by Application
      • 9.3 Fitness - Market size and forecast (2023-2028)
        • Chart on Fitness - Market size and forecast (2023-2028) ($ billion)
        • Data Table on Fitness - Market size and forecast (2023-2028) ($ billion)
        • Chart on Fitness - Year-over-year growth (2023-2028) (%)
        • Data Table on Fitness - Year-over-year growth (2023-2028) (%)
      • 9.4 Casual Wear - Market size and forecast (2023-2028)
        • Chart on Casual Wear - Market size and forecast (2023-2028) ($ billion)
        • Data Table on Casual Wear - Market size and forecast (2023-2028) ($ billion)
        • Chart on Casual Wear - Year-over-year growth (2023-2028) (%)
        • Data Table on Casual Wear - Year-over-year growth (2023-2028) (%)
      • 9.5 Market opportunity by Application
        • Market opportunity by Application ($ billion)
        • Data Table on Market opportunity by Application ($ billion)

      10 Customer Landscape

      • 10.1 Customer landscape overview
        • Analysis of price sensitivity, lifecycle, customer purchase basket, adoption rates, and purchase criteria

      11 Geographic Landscape

      • 11.1 Geographic segmentation
        • Chart on Market share by geography 2023-2028 (%)
        • Data Table on Market share by geography 2023-2028 (%)
      • 11.2 Geographic comparison
        • Chart on Geographic comparison
        • Data Table on Geographic comparison
      • 11.3 North America - Market size and forecast 2023-2028
        • Chart on North America - Market size and forecast 2023-2028 ($ billion)
        • Data Table on North America - Market size and forecast 2023-2028 ($ billion)
        • Chart on North America - Year-over-year growth 2023-2028 (%)
        • Data Table on North America - Year-over-year growth 2023-2028 (%)
      • 11.4 Europe - Market size and forecast 2023-2028
        • Chart on Europe - Market size and forecast 2023-2028 ($ billion)
        • Data Table on Europe - Market size and forecast 2023-2028 ($ billion)
        • Chart on Europe - Year-over-year growth 2023-2028 (%)
        • Data Table on Europe - Year-over-year growth 2023-2028 (%)
      • 11.5 APAC - Market size and forecast 2023-2028
        • Chart on APAC - Market size and forecast 2023-2028 ($ billion)
        • Data Table on APAC - Market size and forecast 2023-2028 ($ billion)
        • Chart on APAC - Year-over-year growth 2023-2028 (%)
        • Data Table on APAC - Year-over-year growth 2023-2028 (%)
      • 11.6 South America - Market size and forecast 2023-2028
        • Chart on South America - Market size and forecast 2023-2028 ($ billion)
        • Data Table on South America - Market size and forecast 2023-2028 ($ billion)
        • Chart on South America - Year-over-year growth 2023-2028 (%)
        • Data Table on South America - Year-over-year growth 2023-2028 (%)
      • 11.7 Middle East and Africa - Market size and forecast 2023-2028
        • Chart on Middle East and Africa - Market size and forecast 2023-2028 ($ billion)
        • Data Table on Middle East and Africa - Market size and forecast 2023-2028 ($ billion)
        • Chart on Middle East and Africa - Year-over-year growth 2023-2028 (%)
        • Data Table on Middle East and Africa - Year-over-year growth 2023-2028 (%)
      • 11.8 US - Market size and forecast 2023-2028
        • Chart on US - Market size and forecast 2023-2028 ($ billion)
        • Data Table on US - Market size and forecast 2023-2028 ($ billion)
        • Chart on US - Year-over-year growth 2023-2028 (%)
        • Data Table on US - Year-over-year growth 2023-2028 (%)
      • 11.9 UK - Market size and forecast 2023-2028
        • Chart on UK - Market size and forecast 2023-2028 ($ billion)
        • Data Table on UK - Market size and forecast 2023-2028 ($ billion)
        • Chart on UK - Year-over-year growth 2023-2028 (%)
        • Data Table on UK - Year-over-year growth 2023-2028 (%)
      • 11.10 Japan - Market size and forecast 2023-2028
        • Chart on Japan - Market size and forecast 2023-2028 ($ billion)
        • Data Table on Japan - Market size and forecast 2023-2028 ($ billion)
        • Chart on Japan - Year-over-year growth 2023-2028 (%)
        • Data Table on Japan - Year-over-year growth 2023-2028 (%)
      • 11.11 Germany - Market size and forecast 2023-2028
        • Chart on Germany - Market size and forecast 2023-2028 ($ billion)
        • Data Table on Germany - Market size and forecast 2023-2028 ($ billion)
        • Chart on Germany - Year-over-year growth 2023-2028 (%)
        • Data Table on Germany - Year-over-year growth 2023-2028 (%)
      • 11.12 China - Market size and forecast 2023-2028
        • Chart on China - Market size and forecast 2023-2028 ($ billion)
        • Data Table on China - Market size and forecast 2023-2028 ($ billion)
        • Chart on China - Year-over-year growth 2023-2028 (%)
        • Data Table on China - Year-over-year growth 2023-2028 (%)
      • 11.13 Market opportunity by geography
        • Market opportunity by geography ($ billion)
        • Data Tables on Market opportunity by geography ($ billion)
      • 11.14 Canada - Market size and forecast (2023-2028)
        • Chart on Canada - Market size and forecast (2023-2028) ($ billion)
        • Data Table on Canada - Market size and forecast (2023-2028) ($ billion)
        • Chart on Canada - Year-over-year growth (2023-2028) (%)
        • Data Table on Canada - Year-over-year growth (2023-2028) (%)
      • 11.15 India - Market size and forecast (2023-2028)
        • Chart on India - Market size and forecast (2023-2028) ($ billion)
        • Data Table on India - Market size and forecast (2023-2028) ($ billion)
        • Chart on India - Year-over-year growth (2023-2028) (%)
        • Data Table on India - Year-over-year growth (2023-2028) (%)
      • 11.16 South Korea - Market size and forecast (2023-2028)
        • Chart on South Korea - Market size and forecast (2023-2028) ($ billion)
        • Data Table on South Korea - Market size and forecast (2023-2028) ($ billion)
        • Chart on South Korea - Year-over-year growth (2023-2028) (%)
        • Data Table on South Korea - Year-over-year growth (2023-2028) (%)
      • 11.17 France - Market size and forecast (2023-2028)
        • Chart on France - Market size and forecast (2023-2028) ($ billion)
        • Data Table on France - Market size and forecast (2023-2028) ($ billion)
        • Chart on France - Year-over-year growth (2023-2028) (%)
        • Data Table on France - Year-over-year growth (2023-2028) (%)
      • 11.18 Italy - Market size and forecast (2023-2028)
        • Chart on Italy - Market size and forecast (2023-2028) ($ billion)
        • Data Table on Italy - Market size and forecast (2023-2028) ($ billion)
        • Chart on Italy - Year-over-year growth (2023-2028) (%)
        • Data Table on Italy - Year-over-year growth (2023-2028) (%)
      • 11.19 Brazil - Market size and forecast (2023-2028)
        • Chart on Brazil - Market size and forecast (2023-2028) ($ billion)
        • Data Table on Brazil - Market size and forecast (2023-2028) ($ billion)
        • Chart on Brazil - Year-over-year growth (2023-2028) (%)
        • Data Table on Brazil - Year-over-year growth (2023-2028) (%)
      • 11.20 UAE - Market size and forecast (2023-2028)
        • Chart on UAE - Market size and forecast (2023-2028) ($ billion)
        • Data Table on UAE - Market size and forecast (2023-2028) ($ billion)
        • Chart on UAE - Year-over-year growth (2023-2028) (%)
        • Data Table on UAE - Year-over-year growth (2023-2028) (%)
      • 11.21 Spain - Market size and forecast (2023-2028)
        • Chart on Spain - Market size and forecast (2023-2028) ($ billion)
        • Data Table on Spain - Market size and forecast (2023-2028) ($ billion)
        • Chart on Spain - Year-over-year growth (2023-2028) (%)
        • Data Table on Spain - Year-over-year growth (2023-2028) (%)
      • 11.22 Rest of World (ROW) - Market size and forecast (2023-2028)
        • Chart on Rest of World (ROW) - Market size and forecast (2023-2028) ($ billion)
        • Data Table on Rest of World (ROW) - Market size and forecast (2023-2028) ($ billion)
        • Chart on Rest of World (ROW) - Year-over-year growth (2023-2028) (%)
        • Data Table on Rest of World (ROW) - Year-over-year growth (2023-2028) (%)

      12 Drivers, Challenges, and Opportunity/Restraints

      • 12.1 Market drivers
        • 12.2 Market challenges
          • 12.3 Impact of drivers and challenges
            • Impact of drivers and challenges in 2023 and 2028
          • 12.4 Market opportunities/restraints

            13 Competitive Landscape

            • 13.1 Overview
              • 13.2 Competitive Landscape
                • Overview on criticality of inputs and factors of differentiation
              • 13.3 Landscape disruption
                • Overview on factors of disruption
              • 13.4 Industry risks
                • Impact of key risks on business

              14 Competitive Analysis

              • 14.1 Companies profiled
                • Companies covered
              • 14.2 Market positioning of companies
                • Matrix on companies position and classification
              • 14.3 Adidas AG
                • Adidas AG - Overview
                • Adidas AG - Business segments
                • Adidas AG - Key news
                • Adidas AG - Key offerings
                • Adidas AG - Segment focus
              • 14.4 ALALA
                • ALALA - Overview
                • ALALA - Product / Service
                • ALALA - Key offerings
              • 14.5 ALO LLC
                • ALO LLC - Overview
                • ALO LLC - Product / Service
                • ALO LLC - Key offerings
              • 14.6 American Eagle Outfitters Inc
                • American Eagle Outfitters Inc - Overview
                • American Eagle Outfitters Inc - Business segments
                • American Eagle Outfitters Inc - Key offerings
                • American Eagle Outfitters Inc - Segment focus
              • 14.7 Carbon38 Inc.
                • Carbon38 Inc. - Overview
                • Carbon38 Inc. - Product / Service
                • Carbon38 Inc. - Key offerings
              • 14.8 Columbia Sportswear Co.
                • Columbia Sportswear Co. - Overview
                • Columbia Sportswear Co. - Business segments
                • Columbia Sportswear Co. - Key news
                • Columbia Sportswear Co. - Key offerings
                • Columbia Sportswear Co. - Segment focus
              • 14.9 EYSOM LLC
                • EYSOM LLC - Overview
                • EYSOM LLC - Product / Service
                • EYSOM LLC - Key offerings
              • 14.10 H and M Hennes and Mauritz GBC AB
                • H and M Hennes and Mauritz GBC AB - Overview
                • H and M Hennes and Mauritz GBC AB - Business segments
                • H and M Hennes and Mauritz GBC AB - Key news
                • H and M Hennes and Mauritz GBC AB - Key offerings
                • H and M Hennes and Mauritz GBC AB - Segment focus
              • 14.11 lululemon athletica Inc.
                • lululemon athletica Inc. - Overview
                • lululemon athletica Inc. - Business segments
                • lululemon athletica Inc. - Key offerings
                • lululemon athletica Inc. - Segment focus
              • 14.12 Michi Design Inc.
                • Michi Design Inc. - Overview
                • Michi Design Inc. - Product / Service
                • Michi Design Inc. - Key offerings
              • 14.13 New Balance Athletics Inc.
                • New Balance Athletics Inc. - Overview
                • New Balance Athletics Inc. - Product / Service
                • New Balance Athletics Inc. - Key news
                • New Balance Athletics Inc. - Key offerings
              • 14.14 Nike Inc.
                • Nike Inc. - Overview
                • Nike Inc. - Business segments
                • Nike Inc. - Key news
                • Nike Inc. - Key offerings
                • Nike Inc. - Segment focus
              • 14.15 Outdoor Voices Inc.
                • Outdoor Voices Inc. - Overview
                • Outdoor Voices Inc. - Product / Service
                • Outdoor Voices Inc. - Key offerings
              • 14.16 P.E Nation International
                • P.E Nation International - Overview
                • P.E Nation International - Product / Service
                • P.E Nation International - Key offerings
              • 14.17 PUMA SE
                • PUMA SE - Overview
                • PUMA SE - Business segments
                • PUMA SE - Key news
                • PUMA SE - Key offerings
                • PUMA SE - Segment focus

              15 Appendix

              • 15.1 Scope of the report
                • 15.2 Inclusions and exclusions checklist
                  • Inclusions checklist
                  • Exclusions checklist
                • 15.3 Currency conversion rates for US$
                  • Currency conversion rates for US$
                • 15.4 Research methodology
                  • Research methodology
                • 15.5 Data procurement
                  • Information sources
                • 15.6 Data validation
                  • Data validation
                • 15.7 Validation techniques employed for market sizing
                  • Validation techniques employed for market sizing
                • 15.8 Data synthesis
                  • Data synthesis
                • 15.9 360 degree market analysis
                  • 360 degree market analysis
                • 15.10 List of abbreviations
                  • List of abbreviations

                Research Methodology

                Technavio presents a detailed picture of the market by way of study, synthesis, and summation of data from multiple sources. The analysts have presented the various facets of the market with a particular focus on identifying the key industry influencers. The data thus presented is comprehensive, reliable, and the result of extensive research, both primary and secondary.

                INFORMATION SOURCES

                Primary sources

                • Manufacturers and suppliers
                • Channel partners
                • Industry experts
                • Strategic decision makers

                Secondary sources

                • Industry journals and periodicals
                • Government data
                • Financial reports of key industry players
                • Historical data
                • Press releases

                DATA ANALYSIS

                Data Synthesis

                • Collation of data
                • Estimation of key figures
                • Analysis of derived insights

                Data Validation

                • Triangulation with data models
                • Reference against proprietary databases
                • Corroboration with industry experts

                REPORT WRITING

                Qualitative

                • Market drivers
                • Market challenges
                • Market trends
                • Five forces analysis

                Quantitative

                • Market size and forecast
                • Market segmentation
                • Geographical insights
                • Competitive landscape

                Interested in this report?

                Get your sample now to see our research methodology and insights!

                Download Now

                Frequently Asked Questions

                Athleisure market growth will increase by $ 176.3 bn during 2024-2028 .

                The Athleisure market is expected to grow at a CAGR of 6.79% during 2024-2028 .

                Athleisure market is segmented by Product( Mass athleisure, Premium athleisure) Distribution Channel( Online, Offline, APAC, South America, MEA)

                Adidas AG, ALALA, ALO LLC, American Eagle Outfitters Inc, Carbon38 Inc., Columbia Sportswear Co., EYSOM LLC, The Gap Inc., H and M Hennes and Mauritz GBC AB, lululemon athletica Inc., Michi Design Inc., New Balance Athletics Inc., Nike Inc., Outdoor Voices Inc., P.E Nation International, PUMA SE, Rhone Apparel Inc, Sweaty Betty Ltd., Under Armour Inc., VF Corp. are a few of the key vendors in the Athleisure market.

                APAC will register the highest growth rate of 28% among the other regions. Therefore, the Athleisure market in APAC is expected to garner significant business opportunities for the vendors during the forecast period.

                US, China, Japan, Germany, France, Spain, Canada, India, South Korea, France, Japan, Italy, Brazil, UAE, UK, Spain, Rest of World (ROW)

                • Growing prominence of online shoppingThe online distribution channel is the driving factor this market.
                • also known as e-commerce is the driving factor this market.
                • is witnessing a higher growth rate than the offline distribution channel. Two of the major e-commerce players operating in the global market are Amazon.com (Amazon) is the driving factor this market.
                • and eBay Inc. E-commerce platforms provide a wide range of athleisure offered by various brands. With the growing trend of online retailing is the driving factor this market.
                • especially in developing countries is the driving factor this market.
                • sales of athleisure through this channel are expected to increase significantly during the forecast period. This is more perceptible in the US is the driving factor this market.
                • the UK is the driving factor this market.
                • Japan is the driving factor this market.
                • and India is the driving factor this market.
                • among other countries is the driving factor this market.
                • where athleisure wear manufacturers such as Nike and adidas are increasingly shifting to online distribution and sale of their products. The growing penetration of the Internet is stoking strong e-commerce activities across regions. Besides is the driving factor this market.
                • e-commerce platforms offer personalized shopping assistance and suggestions about athleisure to customers.E-commerce platform vendors allow consumers to compare and collect information about athleisure products offered by various brands. Customers can provide product feedback on these platforms through reviews and ratings. For instance is the driving factor this market.
                • adidas offers adidas Women Designed 2 Move High Rise Logo Long Tights on Amazon is the driving factor this market.
                • and the platform has reviews and ratings given by previous customers. These reviews from previous customers help new ones make a buying decision and choose the appropriate products. The online distribution channel allows vendors to offer a considerable amount of discount directly to customers is the driving factor this market.
                • as it eliminates the costs associated with the operation of physical stores is the driving factor this market.
                • employment of sales personnel is the driving factor this market.
                • and physical merchandising of athleisure. Therefore is the driving factor this market.
                • the online segment is expected to witness an incremental year-over-year growth rate during the forecast period. is the driving factor this market.

                The Athleisure market vendors should focus on grabbing business opportunities from the Mass athleisure segment as it accounted for the largest market share in the base year.