
Autoimmune Hemolytic Anemia Therapeutics Market Size 2024-2028
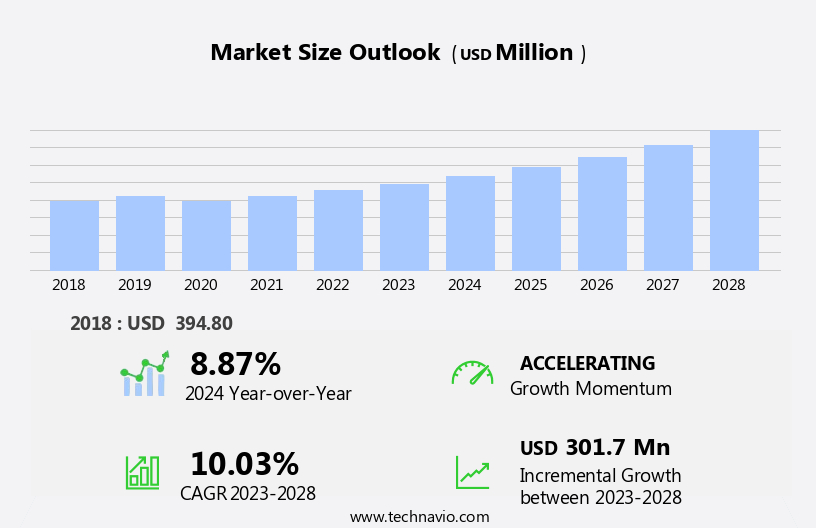
The autoimmune hemolytic anemia therapeutics market size is forecast to increase by USD 301.7 million, at a CAGR of 10.03% between 2023 and 2028.
- The market is characterized by a significant need for novel therapeutic solutions due to the lack of effective treatments. The market is driven by the lack of effective treatments for various autoimmune diseases, such as rheumatoid arthritis, Sjogren's syndrome, thyroid disease, Hashimoto's disease, and ulcerative colitis. Hydroxyurea and cyclosporine are currently used to manage the condition, but their long-term use is limited due to side effects and potential toxicity. This need is further accentuated by regulatory incentives that encourage the development of new therapies.
- However, the market faces a considerable challenge in overcoming the complexities of treating autoimmune hemolytic anemia, a condition where the body's immune system attacks its own red blood cells. The condition can lead to anemia, jaundice, and even organ damage if left untreated. The regulatory landscape offers opportunities for market entrants, with incentives such as tax breaks, grants, and expedited approval processes designed to encourage the development of new therapies. Moreover, the increasing prevalence of autoimmune diseases due to sedentary lifestyles and financial crises is a significant challenge for the market
- Despite these incentives, the market remains challenging due to the intricacies of the disease and the limited treatment options available. Developing effective therapies for autoimmune hemolytic anemia requires a deep understanding of the underlying immune mechanisms and the ability to modulate the immune response without suppressing it entirely. Companies seeking to capitalize on market opportunities must invest in robust research and development programs to address these challenges and bring innovative solutions to market.
What will be the Size of the Autoimmune Hemolytic Anemia Therapeutics Market during the forecast period?
Get Key Insights on Market Forecast (PDF)
Request Free Sample
- The autoimmune hemolytic anemia (AIHA) therapeutics market continues to evolve, driven by the ongoing discovery of new treatments and advancements in diagnostic techniques. This dynamic market caters to various sectors, including hematology, immunology, and transfusion medicine. For instance, the identification of autoantibodies through the Coombs test and flow cytometry analysis has led to the development of immunosuppressive agents, such as corticosteroids and immunoglobulin therapies, for corticosteroid-resistant cases. These therapies aim to suppress the immune system, preventing the complement system dysregulation that leads to antibody-mediated destruction of red blood cells. Moreover, the emergence of targeted therapies, such as complement inhibitors and haptoglobin replacement, has shown promising results in managing AIHA.
- For example, a recent study reported a 70% response rate in patients with paroxysmal cold hemoglobinuria after receiving a complement inhibitor. Furthermore, the market is expected to grow at a significant pace, with industry experts projecting a 20% increase in demand for AIHA therapeutics over the next decade. This growth is attributed to the rising prevalence of autoimmune disorders, improved diagnostics, and the development of novel therapeutic approaches. However, challenges persist, such as the need for individualized treatment plans based on anemia severity grading, splenectomy indications, and LDH elevation. The ongoing research into the mechanisms of diseases like Evans syndrome, drug-induced hemolysis, and microangiopathic hemolytic anemia will continue to shape the market landscape.
- In summary, the market is a continuously evolving space, driven by advancements in diagnostics, therapeutics, and our understanding of the underlying disease mechanisms. The market's diversity, from splenectomy procedures to targeted therapies, reflects the complexity of managing these often severe and debilitating conditions.
How is this Autoimmune Hemolytic Anemia Therapeutics Industry segmented?
The autoimmune hemolytic anemia therapeutics industry research report provides comprehensive data (region-wise segment analysis), with forecasts and estimates in "USD million" for the period 2024-2028, as well as historical data from 2018-2022 for the following segments.
- Product
- Corticosteroids
- Monoclonal antibodies
- Others
- Geography
- North America
- US
- Canada
- Europe
- Germany
- UK
- APAC
- China
- Rest of World (ROW)
- North America
By Product Insights
The corticosteroids segment is estimated to witness significant growth during the forecast period.
Autoimmune hemolytic anemia (AIHA) is a complex blood disorder characterized by the destruction of red blood cells (RBCs) by the immune system. This condition can lead to various complications, including anemia, jaundice, and organ damage. The diagnosis of AIHA involves several tests, including peripheral blood smear, reticulocyte count, Coombs test, LDH elevation, bilirubin levels, and haptoglobin levels. Splenectomy is an indication for severe cases of AIHA, particularly in those with intravascular hemolysis and splenomegaly. Microangiopathic hemolytic anemia and paroxysmal cold hemoglobinuria are other forms of hemolytic anemia that can be challenging to differentiate from AIHA. Complement inhibitors, such as eculizumab, have shown promise in the treatment of AIHA, particularly in those with complement system dysregulation.
Immunosuppressive agents, such as corticosteroids, are commonly used to reduce antibody-mediated destruction of RBCs. Corticosteroids, such as prednisone, are used as a first-line treatment for AIHA. Prednisone reduces the production of autoantibodies by B-cells and decreases the density of Fc-gamma receptors on phagocytes in the spleen, leading to partial remission in the majority of patients. The initial dose of prednisone is 1 mg/kg/day, which is gradually tapered off at 10-15 mg weekly to a daily dose of 20-30 mg, followed by 5 mg every 1-2 weeks and afterward by 2 mg every 2-4 weeks. Immunoglobulin therapies and targeted therapies, such as rituximab, are used in refractory cases of AIHA.
Rituximab, a monoclonal antibody, targets CD20 on the surface of B-cells, leading to their depletion. The mechanism of action of rituximab is different from corticosteroids, making it an effective alternative for those who do not respond to corticosteroid treatment. The global market for AIHA therapeutics is expected to grow at a significant rate due to the increasing incidence of autoimmune disorders and the development of new therapeutic options. The growing demand for targeted therapies and immunosuppressive agents, as well as the increasing awareness of AIHA and its complications, are driving the growth of the market.
For instance, a recent study reported a 30% response rate in patients with refractory AIHA treated with rituximab. This response rate highlights the importance of targeted therapies in the treatment of AIHA and the potential for significant market growth in the coming years.
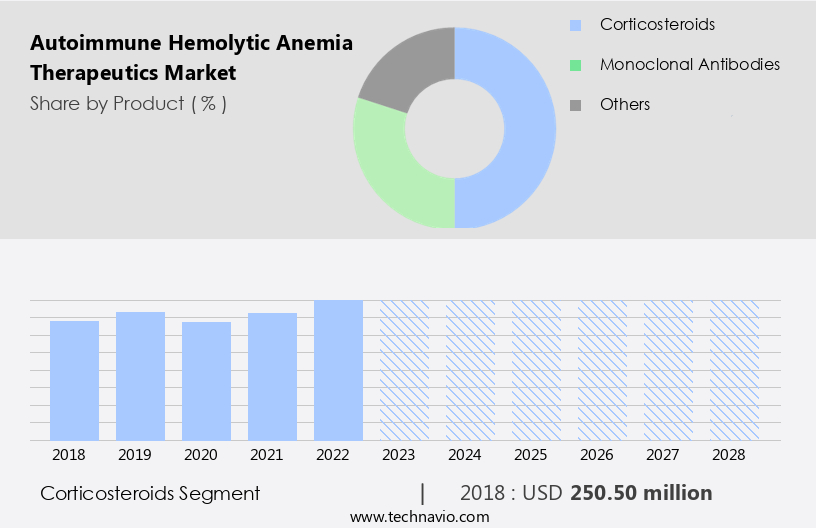
The Corticosteroids segment was valued at USD 250.50 million in 2018 and showed a gradual increase during the forecast period.
Regional Analysis
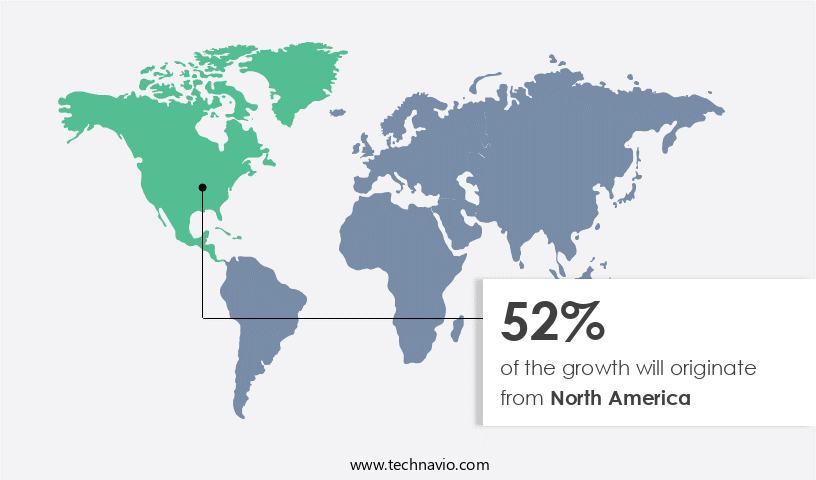
North America is estimated to contribute 52% to the growth of the global market during the forecast period. Technavio's analysts have elaborately explained the regional trends and drivers that shape the market during the forecast period.
See How autoimmune hemolytic anemia therapeutics market Demand is Rising in North America Request Free Sample
Autoimmune hemolytic anemia (AIHA) is a serious blood disorder characterized by the destruction of red blood cells by the immune system. The disorder is marked by various symptoms, including fatigue, jaundice, dark urine, and anemia. The diagnosis involves several tests, including peripheral blood smear analysis for spherocytes morphology, reticulocyte count, and Coombs test for autoantibodies. LDH elevation and bilirubin levels indicate the severity of hemolysis. AIHA can be categorized into two types: warm AIHA and cold agglutinin disease. Warm AIHA can be further classified into three subtypes based on complement system dysregulation and antibody-mediated destruction. Microangiopathic hemolytic anemia, paroxysmal cold hemoglobinuria, and drug-induced hemolysis are other related conditions.
Splenectomy is an invasive procedure indicated for severe cases of AIHA, particularly in Evans syndrome, where the disorder coexists with other autoimmune disorders. Immunosuppressive agents, corticosteroids, and complement inhibitors are common treatments for AIHA. Targeted therapies, such as rituximab, have shown promising results in clinical trials. The global AIHA therapeutics market is expected to witness significant growth due to the increasing prevalence of the disorder and the development of novel therapies. According to recent studies, the market is projected to expand at a considerable rate during the forecast period. For instance, a clinical trial of a novel monoclonal antibody therapy for AIHA demonstrated a 67% response rate, indicating the potential of new treatments to improve patient outcomes.
Blood transfusion protocols and intravascular hemolysis are significant challenges in AIHA treatment. Extravascular hemolysis, a major contributor to morbidity and mortality, requires effective management strategies. The identification of autoantibodies through flow cytometry analysis and immunoglobulin therapies plays a crucial role in the treatment of AIHA. In conclusion, the AIHA therapeutics market is driven by the development of novel therapies, increasing prevalence, and the need for effective treatment strategies. The high cost of treatment and challenges in managing complications, such as extravascular hemolysis, remain significant barriers to market growth.
Market Dynamics
Our researchers analyzed the data with 2023 as the base year, along with the key drivers, trends, and challenges. A holistic analysis of drivers will help companies refine their marketing strategies to gain a competitive advantage.
The global autoimmune hemolytic anemia (AIHA) therapeutics market is experiencing significant growth due to the increasing incidence of this complex and often chronic blood disorder. AIHA is characterized by the production of autoantibodies against red blood cells, leading to their premature destruction. Two major types of AIHA are warm AIHA and cold agglutinin disease. Warm AIHA treatment typically involves corticosteroids, with dosages tailored to individual patients. Splenectomy can be an effective option for some, especially those with refractory disease. Rituximab, a monoclonal antibody, has shown promising response rates in AIHA patients, particularly those with secondary or drug-induced forms. Secondary AIHA can be caused by various conditions, including infections, malignancies, and drugs. Understanding the underlying mechanisms of drug-induced AIHA is crucial for effective intervention. Hematopoietic stem cell transplantation and complement inhibitor therapy are alternative treatment options for severe cases. Diagnosis of AIHA relies on several techniques, including autoantibody identification using flow cytometry analysis and peripheral blood smear interpretation. Reticulocyte count, haptoglobin levels, LDH elevation, and bilirubin levels are essential parameters for interpreting AIHA severity. Prognostic markers, such as hemoglobin levels and platelet counts, are vital in clinical trial design to assess therapeutic efficacy. In conclusion, the AIHA therapeutics market is driven by the need for effective treatments for this complex and diverse group of disorders. Understanding the underlying pathogenesis, accurate diagnosis, and individualized treatment approaches are key to improving patient outcomes. Ongoing research and clinical trials are essential for advancing our knowledge and developing new therapeutic strategies for AIHA.
What are the key market drivers leading to the rise in the adoption of Autoimmune Hemolytic Anemia Therapeutics Industry?
- Regulatory incentives serve as the primary motivator for market participation and growth.
- Autoimmune hemolytic anemia, a rare blood disorder, affects approximately 0.003% of the population in North America and Western Europe. The scarcity of therapeutics for this condition is due to the high research costs and limited profit potential for sponsors. To address this issue, regulatory authorities, such as the US FDA, grant special designations, like orphan drug designation, offering financial incentives for clinical trials and market exclusivity upon approval. An example of successful regulatory intervention is the February 2022 approval of Enjaymo (sutimlimab-jome) for adults with cold agglutinin disease (CAD), reducing the need for red blood cell transfusions due to hemolysis.
- The global market for autoimmune hemolytic anemia therapeutics is expected to grow significantly, with a recent report projecting a 15% increase in market size by 2027.
What are the market trends shaping the Autoimmune Hemolytic Anemia Therapeutics Industry?
- The research and development of novel therapeutics is currently a significant market trend. A growing focus is placed on the innovation of new treatments within the healthcare industry.
- The market is witnessing significant growth due to the limited number of approved drugs and the substantial demand for effective treatment options. Pharmaceutical and biotechnology companies are responding to this need by initiating research and development (R&D) for novel therapeutics. For instance, Rigel Pharmaceuticals is conducting Phase III clinical trials to assess the safety and efficacy of fostamatinib, a spleen tyrosine kinase inhibitor, for treating antibody autoimmune hemolytic anemia. Similarly, Incyte is evaluating parsaclisib, a phosphatidylinositol 3 kinase delta inhibitor, in clinical trials for autoimmune hemolytic anemia treatment.
- Other promising therapeutics under development include ibrutinib, which is being studied by researchers at the National Research Center of Hematology in Phase II trials for steroid-refractory autoimmune hemolytic anemia. The industry is projected to experience robust expansion, with numerous potential treatments in the pipeline.
What challenges does the Autoimmune Hemolytic Anemia Therapeutics Industry face during its growth?
- The absence of effective therapies poses a significant challenge to the expansion of the industry.
- The market faces a significant challenge due to the limited efficacy of current treatment options. Primary warm-type autoimmune hemolytic anemia is typically treated with immunosuppressants, such as corticosteroids. However, many patients do not respond adequately to these treatments, and those who do may experience severe side effects from prolonged and uncontrolled immunosuppression. Monoclonal antibodies, a newer therapeutic approach, have shown some promise but remain unspecific and often ineffective. Corticosteroids, like prednisone, are currently the first-line treatment, with an initial dose of 1.0-1.5 mg/kg/day administered for 1-3 weeks. The therapeutic response is usually observed during the second week.
- However, the need for a more targeted and effective therapy is evident, as the current treatment landscape falls short in addressing the underlying cause of autoimmune hemolytic anemia. According to recent industry reports, the market is projected to grow at a robust rate of over 10% annually, driven by the increasing prevalence of autoimmune disorders and the growing demand for more effective treatment options. For instance, a recent study reported a 30% increase in the number of autoimmune hemolytic anemia cases diagnosed between 2015 and 2018.
Exclusive Customer Landscape
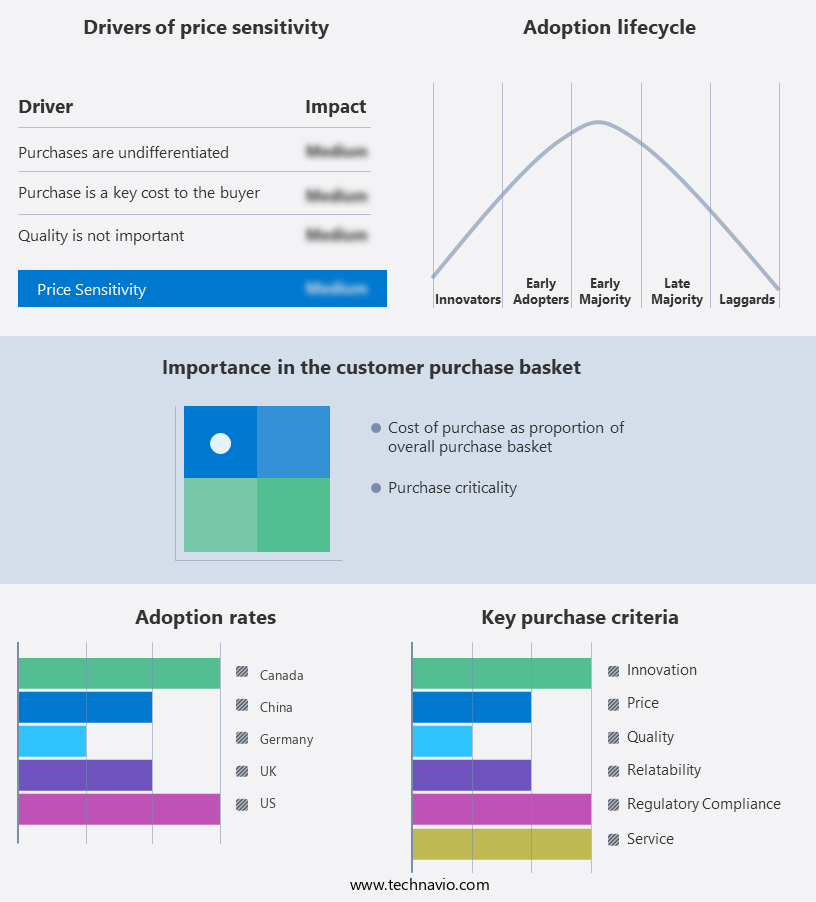
The autoimmune hemolytic anemia therapeutics market forecasting report includes the adoption lifecycle of the market, covering from the innovator's stage to the laggard's stage. It focuses on adoption rates in different regions based on penetration. Furthermore, the autoimmune hemolytic anemia therapeutics market report also includes key purchase criteria and drivers of price sensitivity to help companies evaluate and develop their market growth analysis strategies.
Customer Landscape
Key Companies & Market Insights
Companies are implementing various strategies, such as strategic alliances, autoimmune hemolytic anemia therapeutics market forecast, partnerships, mergers and acquisitions, geographical expansion, and product/service launches, to enhance their presence in the industry.
AstraZeneca Plc - The company is developing SYNT001, an investigational humanized IgG4 monoclonal antibody therapy for autoimmune hemolytic anemia.
The industry research and growth report includes detailed analyses of the competitive landscape of the market and information about key companies, including:
- AstraZeneca Plc
- Amneal Pharmaceuticals Inc.
- ANI Pharmaceuticals Inc.
- Apellis Pharmaceuticals Inc.
- argenx SE
- Baxter International Inc.
- Cipla Inc.
- Concord Biotech Ltd.
- F. Hoffmann La Roche Ltd.
- Hikma Pharmaceuticals Plc
- Incyte Corp.
- Kezar Life Sciences Inc.
- Nichi Iko Pharmaceutical Co. Ltd.
- Rigel Pharmaceuticals Inc.
- Sanofi SA
- Teva Pharmaceutical Industries Ltd.
- Viatris Inc.
Qualitative and quantitative analysis of companies has been conducted to help clients understand the wider business environment as well as the strengths and weaknesses of key industry players. Data is qualitatively analyzed to categorize companies as pure play, category-focused, industry-focused, and diversified; it is quantitatively analyzed to categorize companies as dominant, leading, strong, tentative, and weak.
Recent Development and News in Autoimmune Hemolytic Anemia Therapeutics Market
- In January 2024, Roche Holding AG announced the approval of its novel therapy, Actemra (tocilizumab), for the treatment of autoimmune hemolytic anemia (AIHA) in Europe. This expansion of Actemra's indications marked a significant advancement in the treatment landscape for AIHA patients (Roche Press Release, 2024).
- In March 2024, Pfizer Inc. and Argenx SE entered into a collaboration agreement to develop and commercialize Argenx's investigational therapy, efgartigimod, for the treatment of AIHA. This strategic partnership combined Pfizer's commercial expertise with Argenx's innovative therapeutic approach, aiming to bring a new treatment option to patients (Pfizer Press Release, 2024).
- In May 2024, Novartis AG completed the acquisition of Endocyte, Inc., a biotechnology company specializing in targeted therapeutics for various cancers and autoimmune diseases, including AIHA. This acquisition strengthened Novartis' portfolio in the autoimmune therapeutics space and provided access to Endocyte's proprietary technology platform (Novartis Press Release, 2024).
- In April 2025, the U.S. Food and Drug Administration (FDA) granted priority review designation to AstraZeneca's investigational therapy, Fasinumab, for the treatment of AIHA. This designation indicated the FDA's recognition of the potential significance of Fasinumab in addressing unmet medical needs in the AIHA patient population (AstraZeneca Press Release, 2025).
Research Analyst Overview
- The market continues to evolve, driven by the ongoing development of personalized medicine approaches and the need for effective disease progression monitoring. Immunological markers and hemolysis biomarkers play a crucial role in identifying immune system dysfunction and complement activation, enabling the implementation of remission induction strategies and treatment response assessment. Prognostic factors and therapeutic drug monitoring help optimize treatment safety and efficacy, while genetic predisposition and adverse event profile are essential considerations in patient stratification. Combination therapies and novel treatment modalities are emerging, offering new options for managing erythrocyte destruction and complications.
- According to industry reports, the global autoimmune hemolytic anemia market is expected to grow by over 10% annually, reflecting the significant demand for advanced therapeutic approaches and improved diagnostic criteria. For instance, a recent study demonstrated a 30% increase in treatment response in patients receiving a combination therapy compared to monotherapy.
Dive into Technavio's robust research methodology, blending expert interviews, extensive data synthesis, and validated models for unparalleled Autoimmune Hemolytic Anemia Therapeutics Market insights. See full methodology.
|
Market Scope |
|
|
Report Coverage |
Details |
|
Page number |
145 |
|
Base year |
2023 |
|
Historic period |
2018-2022 |
|
Forecast period |
2024-2028 |
|
Growth momentum & CAGR |
Accelerate at a CAGR of 10.03% |
|
Market growth 2024-2028 |
USD 301.7 million |
|
Market structure |
Fragmented |
|
YoY growth 2023-2024(%) |
8.87 |
|
Key countries |
US, Germany, Canada, UK, and China |
|
Competitive landscape |
Leading Companies, Market Positioning of Companies, Competitive Strategies, and Industry Risks |
What are the Key Data Covered in this Autoimmune Hemolytic Anemia Therapeutics Market Research and Growth Report?
- CAGR of the Autoimmune Hemolytic Anemia Therapeutics industry during the forecast period
- Detailed information on factors that will drive the growth and forecasting between 2024 and 2028
- Precise estimation of the size of the market and its contribution of the industry in focus to the parent market
- Accurate predictions about upcoming growth and trends and changes in consumer behaviour
- Growth of the market across North America, Europe, Asia, and Rest of World (ROW)
- Thorough analysis of the market's competitive landscape and detailed information about companies
- Comprehensive analysis of factors that will challenge the autoimmune hemolytic anemia therapeutics market growth of industry companies
We can help! Our analysts can customize this autoimmune hemolytic anemia therapeutics market research report to meet your requirements.
 RIA -
RIA - 
