Automotive Fascia Market Analysis, Size, and Forecast 2026-2030: APAC (China, Japan, and India), North America (US, Mexico, and Canada), Europe (Germany, UK, and France), Middle East and Africa (Saudi Arabia, UAE, and South Africa), South America (Brazil, Argentina, and Colombia), and Rest of World (ROW)

Automotive Fascia Market Analysis, Size, and Forecast 2026-2030:
APAC (China, Japan, and India), North America (US, Mexico, and Canada), Europe (Germany, UK, and France), Middle East and Africa (Saudi Arabia, UAE, and South Africa), South America (Brazil, Argentina, and Colombia), and Rest of World (ROW)

Published: Dec 2025 296 Pages SKU: IRTNTR81212

Market Overview at a Glance

$7.99 B
Market Opportunity
6.1%
CAGR 2025 - 2030
47.9%
APAC Growth
$13.17 B
Front fascia segment 2024

Automotive Fascia Market Size 2026-2030

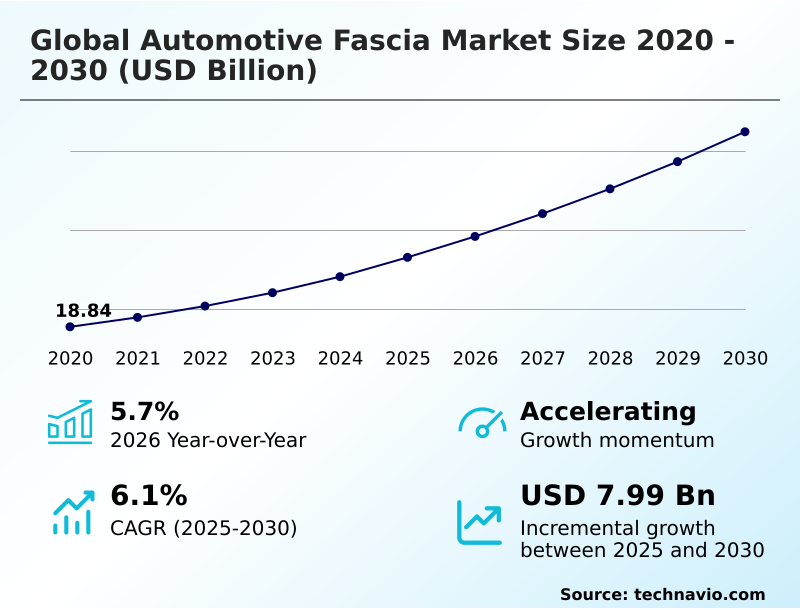
The automotive fascia market size is valued to increase by USD 7.99 billion, at a CAGR of 6.1% from 2025 to 2030. Proliferation of electric vehicles and redefinition of front end design will drive the automotive fascia market.

Major Market Trends & Insights

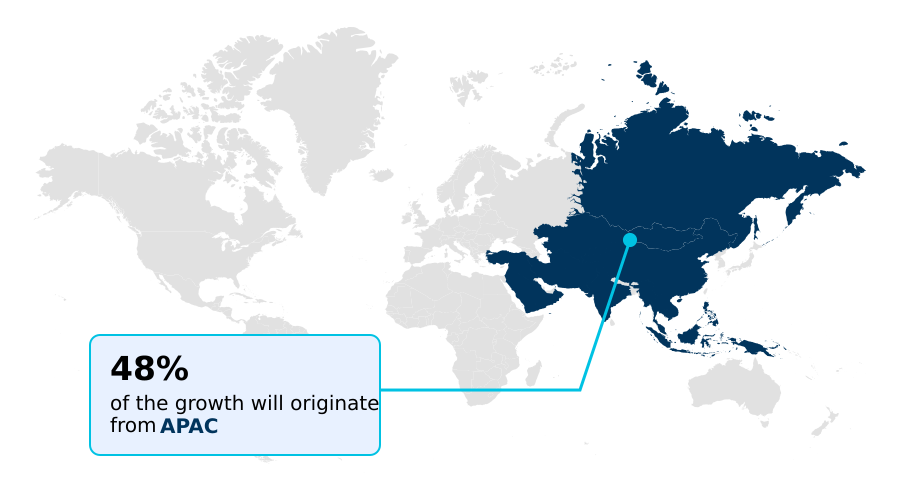
  • APAC dominated the market and accounted for a 47.9% growth during the forecast period.
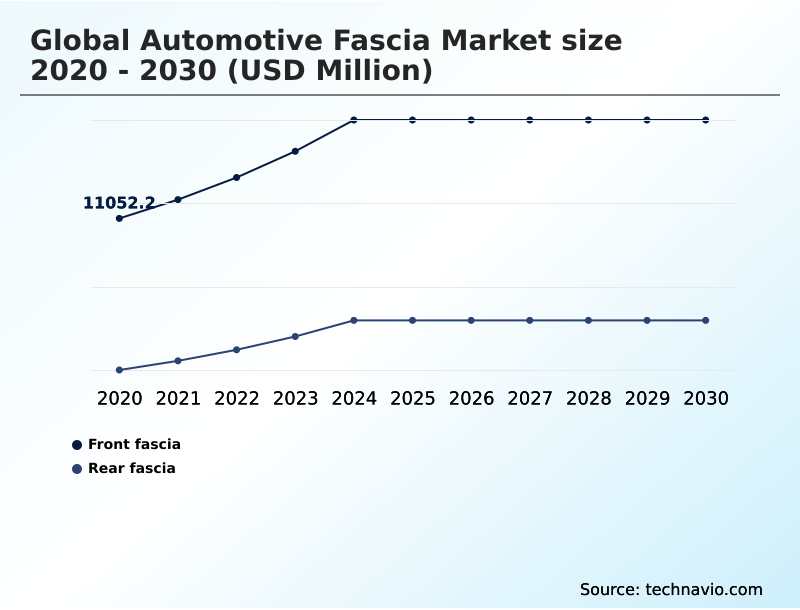
  • By Product - Front fascia segment was valued at USD 13.17 billion in 2024
  • By Vehicle Type - Passenger vehicles segment accounted for the largest market revenue share in 2024

Market Size & Forecast

  • Market Opportunities: USD 12.40 billion
  • Market Future Opportunities: USD 7.99 billion
  • CAGR from 2025 to 2030 : 6.1%

Market Summary

  • The automotive fascia market is at the forefront of vehicle evolution, balancing aesthetic appeal with profound functional demands. This sector is no longer defined by simple bumper covers; it is a hub of innovation where design meets advanced technology.
  • Key market drivers include the transition to electric vehicles, which allows for radical new front-end styling, and the critical integration of sensors for driver-assistance systems. These shifts compel manufacturers to explore new materials and production methods.
  • A central operational scenario involves automakers specifying a fascia that is not only lightweight and aerodynamic but also transparent to radar signals and capable of housing complex lighting systems. This creates challenges in material science and manufacturing precision, pushing suppliers to develop integrated solutions that address form, function, and regulatory compliance simultaneously.
  • The emphasis on sustainability further complicates this dynamic, demanding the use of recycled and bio-based polymers without compromising performance. Consequently, the market is characterized by a continuous cycle of innovation in response to technological, regulatory, and consumer pressures.

What will be the Size of the Automotive Fascia Market during the forecast period?

Get Key Insights on Market Forecast (PDF) Request Free Sample

How is the Automotive Fascia Market Segmented?

The automotive fascia industry research report provides comprehensive data (region-wise segment analysis), with forecasts and estimates in "USD million" for the period 2026-2030, as well as historical data from 2020-2024 for the following segments.

  • Product
    • Front fascia
    • Rear fascia
  • Vehicle type
    • Passenger vehicles
    • Commercial vehicle
  • Material
    • Plastic
    • Metal
    • Rubber
  • Geography
    • APAC
      • China
      • Japan
      • India
    • North America
      • US
      • Mexico
      • Canada
    • Europe
      • Germany
      • UK
      • France
    • Middle East and Africa
      • Saudi Arabia
      • UAE
      • South Africa
    • South America
      • Brazil
      • Argentina
      • Colombia
    • Rest of World (ROW)

By Product Insights

The front fascia segment is estimated to witness significant growth during the forecast period.

The front fascia segment is undergoing a technological renaissance, evolving from a cosmetic panel to a critical nexus of vehicle intelligence.

This shift is driven by the need for advanced polymer materials that enable autonomous driving sensor integration while supporting complex exterior molding.

The concept of the intelligent front panel, or smart face, is central to this evolution, especially for the electric vehicle front-end. These designs incorporate integrated lighting solutions and demand a Class-A surface finish that conceals an array of sensors.

For suppliers, mastering innovative molding processes has become essential, as these advanced components represent a value increase of over 35% compared to their traditional counterparts. This complexity necessitates robust digital design and simulation to ensure performance and manufacturability.

Request Free Sample

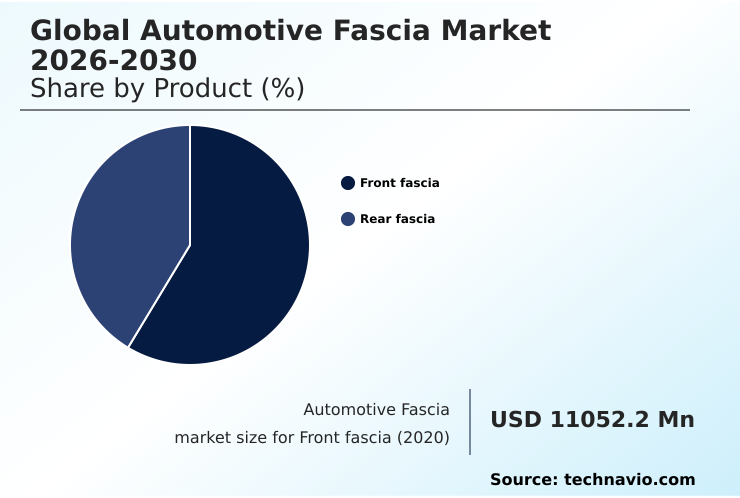
The Front fascia segment was valued at USD 13.17 billion in 2024 and showed a gradual increase during the forecast period.

Request Free Sample

Regional Analysis

APAC is estimated to contribute 47.9% to the growth of the global market during the forecast period.Technavio’s analysts have elaborately explained the regional trends and drivers that shape the market during the forecast period.

See How Automotive Fascia Market Demand is Rising in APAC Request Free Sample

The geographic landscape of the automotive fascia market is defined by divergent regional priorities, with APAC accounting for nearly 48% of the incremental growth.

This region, led by China, is a crucible for the electric vehicle front-end, pushing the boundaries of functional component integration and complex exterior molding.

In North America, the market is driven by large vehicle platforms, emphasizing durability and OEM appearance packages. Europe is heavily influenced by a fragmented regulatory framework, particularly around pedestrian impact protection and end-of-life vehicle recycling.

This forces a focus on sustainable material sourcing and advanced driver-assistance systems calibration.

Across all regions, the move toward autonomous driving sensor integration acts as a unifying driver, compelling a global approach to developing radar-transparent polycarbonate and sensor-compatible paints, improving all-weather sensor performance by 15%.

Market Dynamics

Our researchers analyzed the data with 2025 as the base year, along with the key drivers, trends, and challenges. A holistic analysis of drivers will help companies refine their marketing strategies to gain a competitive advantage.

  • The future of the automotive fascia market is being shaped by several interconnected, long-tail developments. The impact of electrification on front fascia design is paramount, creating a need for a specialized aerodynamic design for electric vehicle fascias to maximize range. This shift necessitates a re-evaluation of lightweight materials for automotive fascia systems, moving beyond traditional plastics.
  • Concurrently, the role of fascia in autonomous vehicle sensor suites grows more critical, driving innovation in ADAS sensor integration in front bumper covers and creating challenges in manufacturing intelligent front panels. This includes the crucial material selection for radar-transparent fascias.
  • The industry is also responding to sustainability mandates, exploring sustainable polymers in exterior vehicle components and grappling with the challenges of using recycled plastics in fascias without compromising quality. Advanced lighting integration in automotive fascias is central to personalization trends in vehicle exterior design, leading to complex assemblies.
  • However, this complexity results in high cost implications of smart fascia repair, a concern amplified by the impact of cybersecurity rules on smart fascias, which demand secure electronic components.
  • The future of fascia design in connected cars depends on advancements in thin-wall injection molding and managing supply chain risks for fascia raw materials, while comparing TPO and PC/ABS for bumper covers remains a key engineering decision.
  • Managing manufacturing complexity in fascia production is now a core competency, as firms that streamline this process report a 10% shorter time-to-market than competitors.

What are the key market drivers leading to the rise in the adoption of Automotive Fascia Industry?

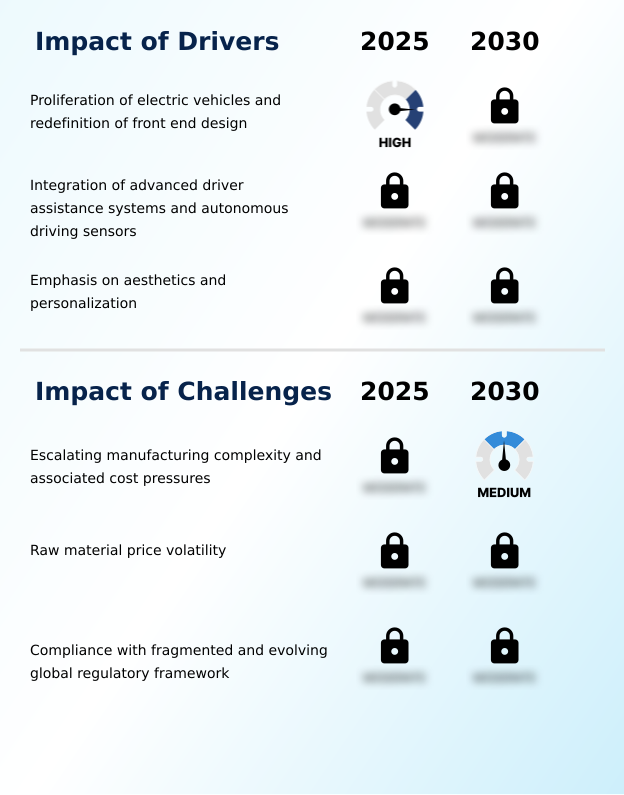
  • The proliferation of electric vehicles, which redefines front-end design by removing the need for traditional grilles, stands as a key driver for the automotive fascia market's innovation.

  • Market growth is significantly influenced by the integration of advanced driver-assistance systems and the industry's shift toward electrification.
  • The redefinition of the electric vehicle front-end allows for greater design freedom, enabling automakers to leverage personalized vehicle aesthetics and custom fascia designs as key differentiators.
  • This trend increases the value per vehicle by incorporating complex front-end module integration and sophisticated electronic control units. The requirement for seamless autonomous driving sensor integration is fueling demand for high-performance composites and advanced manufacturing techniques.
  • The proliferation of these features means modern vehicles can contain over 100 million lines of code, with a significant portion dedicated to ADAS functions, representing a 50% increase in software complexity compared to previous-generation models.

What are the market trends shaping the Automotive Fascia Industry?

  • The market is experiencing a significant trend where automotive fascias are evolving from passive components into intelligent, integrated technology hubs, a transformation driven by the convergence of advanced driver-assistance systems and sophisticated vehicle lighting.

  • Key market trends are transforming automotive fascias into intelligent technology hubs, driven by vehicle aerodynamics enhancement and the imperative for sustainability. The focus on circular economy in automotive is compelling the adoption of sustainable exterior components and advanced polymer materials. Designs are evolving to integrate sophisticated ADAS sensor housing and next-generation lighting systems, creating a distinct brand identity through design.
  • This functional integration allows for aerodynamic improvements that can reduce vehicle energy consumption by up to 8%. Furthermore, the implementation of end-of-life vehicle recycling initiatives has led to the development of new thermoplastic polyolefin composites, with some suppliers achieving a 25% recycled content in Class-A surface finish parts, showcasing a tangible shift toward more environmentally responsible manufacturing.

What challenges does the Automotive Fascia Industry face during its growth?

  • The automotive fascia market faces significant growth challenges from escalating manufacturing complexity and the associated cost pressures tied to producing technologically advanced components.

  • The primary challenges facing the market stem from escalating manufacturing complexity and significant cost pressures. Integrating a dense array of sensors for advanced driver-assistance systems and ensuring cyber-security in vehicles requires substantial R&D investment, increasing component costs by over 40% in some premium applications.
  • This complexity is compounded by a fragmented regulatory framework and volatile raw material price volatility, which disrupt cost-effective manufacturing and impact supply chain resilience. Consequently, post-collision repair costs have surged, as ADAS calibration requires specialized equipment and expertise.
  • Navigating these manufacturing complexity challenges while adhering to diverse global safety standards remains a critical operational hurdle for all suppliers in the sector.

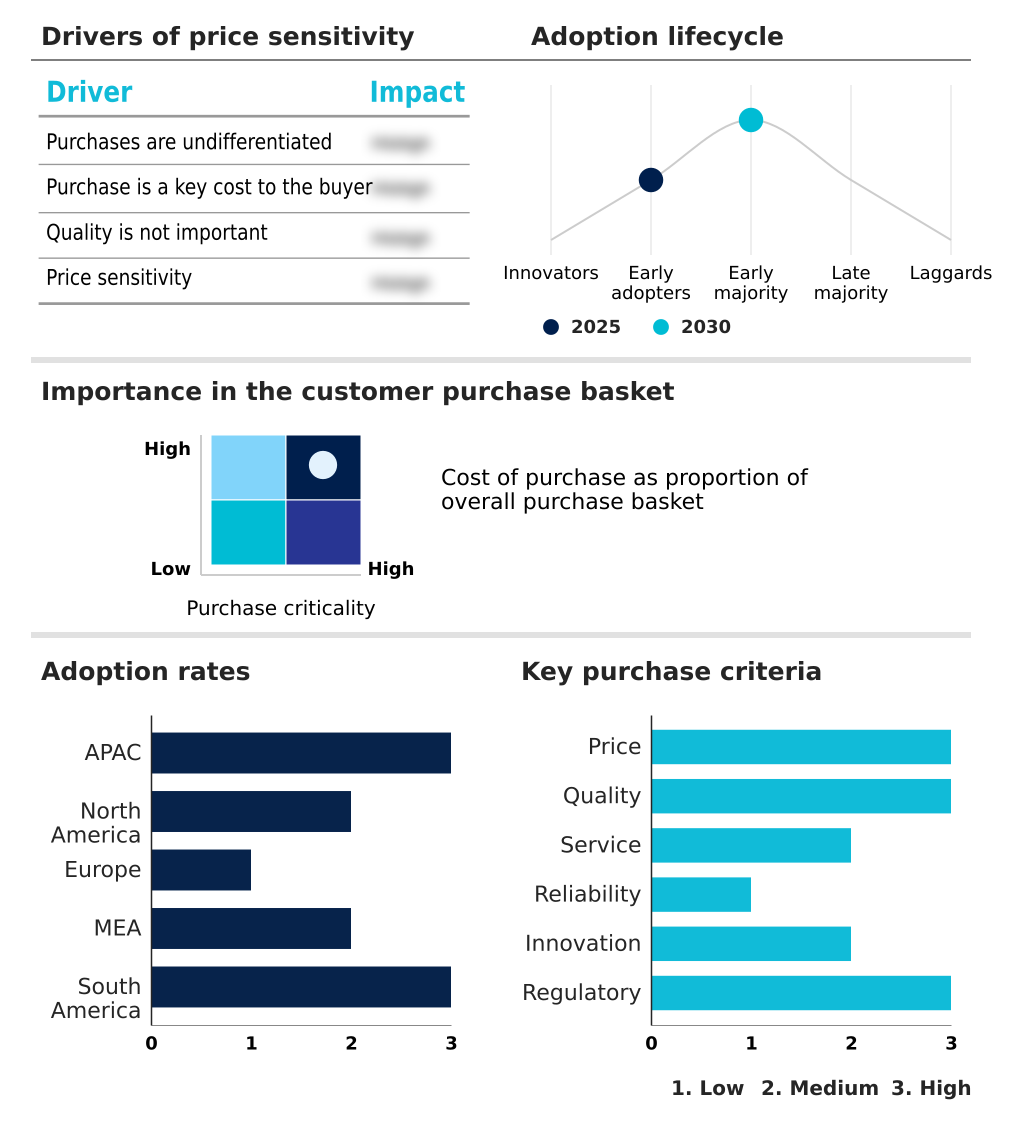
Exclusive Technavio Analysis on Customer Landscape

The automotive fascia market forecasting report includes the adoption lifecycle of the market, covering from the innovator’s stage to the laggard’s stage. It focuses on adoption rates in different regions based on penetration. Furthermore, the automotive fascia market report also includes key purchase criteria and drivers of price sensitivity to help companies evaluate and develop their market growth analysis strategies.

Customer Landscape of Automotive Fascia Industry

Competitive Landscape

Companies are implementing various strategies, such as strategic alliances, automotive fascia market forecast, partnerships, mergers and acquisitions, geographical expansion, and product/service launches, to enhance their presence in the industry.

AGS Automotive Systems - Analysis reveals a focus on engineering complete front-end modules and smart fascia systems, integrating advanced lighting, ADAS sensor technology, and sustainable exterior components.

The industry research and growth report includes detailed analyses of the competitive landscape of the market and information about key companies, including:

  • AGS Automotive Systems
  • ams OSRAM AG
  • Dorman Products Inc.
  • FALTEC Co. Ltd.
  • FlexNGate Group of Companies
  • Forvia SE
  • HELLA GmbH and Co. KGaA
  • Hyundai Mobis Co. Ltd.
  • INOAC Corp.
  • Magna International Inc.
  • Motherson Group
  • Novares
  • Shiloh Industries Inc.
  • Toyoda Gosei Co. Ltd.
  • T-Rex Truck Products Inc.
  • Valeo SA
  • Yanfeng IAT Co. Ltd.

Qualitative and quantitative analysis of companies has been conducted to help clients understand the wider business environment as well as the strengths and weaknesses of key industry players. Data is qualitatively analyzed to categorize companies as pure play, category-focused, industry-focused, and diversified; it is quantitatively analyzed to categorize companies as dominant, leading, strong, tentative, and weak.

Recent Development and News in Automotive fascia market

  • In October 2024, Polymer Innovations Corp. announced a new line of certified circular TPO compounds containing 40% post-consumer recycled content, targeting automotive exterior applications including fascias and bumpers.
  • In January 2025, Omni Exteriors Inc. inaugurated its $300 million smart factory in South Carolina, dedicated to producing intelligent front panels and front-end modules for next-generation electric vehicles.
  • In March 2025, Visionary Lidar Systems revealed a strategic partnership with a major European OEM to seamlessly integrate its next-generation solid-state LiDAR units within the front fascia of all new models launching from 2027.
  • In May 2025, AutoTech Alliance, a consortium of leading Tier 1 suppliers and insurance groups, published new draft standards for the post-collision calibration of fascia-integrated ADAS sensors to reduce repair complexity and costs.

Dive into Technavio’s robust research methodology, blending expert interviews, extensive data synthesis, and validated models for unparalleled Automotive Fascia Market insights. See full methodology.

Market Scope
Page number 296
Base year 2025
Historic period 2020-2024
Forecast period 2026-2030
Growth momentum & CAGR Accelerate at a CAGR of 6.1%
Market growth 2026-2030 USD 7990.3 million
Market structure Fragmented
YoY growth 2025-2026(%) 5.7%
Key countries China, Japan, India, South Korea, Australia, Indonesia, US, Mexico, Canada, Germany, UK, France, Italy, Spain, The Netherlands, Saudi Arabia, UAE, South Africa, Israel, Turkey, Brazil, Argentina and Colombia
Competitive landscape Leading Companies, Market Positioning of Companies, Competitive Strategies, and Industry Risks

Request Free Sample

Research Analyst Overview

  • Boardroom-level strategy in the automotive fascia market is now dictated by the convergence of technology and materials science. Strategic investment decisions focus on advanced manufacturing techniques, including multi-shot injection molding and precision tooling and molding, to enable complete front-end module integration. The adoption of thermoplastic polyolefin composites and carbon fiber reinforced plastics is critical for developing lightweight structural components.
  • These material choices directly influence structural integrity analysis and impact resistance testing, which are essential for pedestrian impact protection. Decisions are complicated by the need to support custom fascia designs and diverse OEM appearance packages featuring illuminated grille technology and dynamic light signatures.
  • The shift to an intelligent front panel that houses ADAS sensor housing requires radar-transparent polycarbonate, sensor-compatible paints, and robust thermal management solutions. This necessitates expertise in multi-material joining and creating energy-absorbing structures with a Class-A surface finish.
  • As firms navigate the market for aftermarket replacement parts and address low-speed collision repair, they must also plan for vehicle-to-everything communication and over-the-air updates for integrated electronic control units, with some achieving a 20% reduction in validation cycles through advanced simulation.

What are the Key Data Covered in this Automotive Fascia Market Research and Growth Report?

  • What is the expected growth of the Automotive Fascia Market between 2026 and 2030?

    • USD 7.99 billion, at a CAGR of 6.1%

  • What segmentation does the market report cover?

    • The report is segmented by Product (Front fascia, and Rear fascia), Vehicle Type (Passenger vehicles, and Commercial vehicles), Material (Plastic, Metal, and Rubber) and Geography (APAC, North America, Europe, Middle East and Africa, South America)

  • Which regions are analyzed in the report?

    • APAC, North America, Europe, Middle East and Africa and South America

  • What are the key growth drivers and market challenges?

    • Proliferation of electric vehicles and redefinition of front end design, Escalating manufacturing complexity and associated cost pressures

  • Who are the major players in the Automotive Fascia Market?

    • AGS Automotive Systems, ams OSRAM AG, Dorman Products Inc., FALTEC Co. Ltd., FlexNGate Group of Companies, Forvia SE, HELLA GmbH and Co. KGaA, Hyundai Mobis Co. Ltd., INOAC Corp., Magna International Inc., Motherson Group, Novares, Shiloh Industries Inc., Toyoda Gosei Co. Ltd., T-Rex Truck Products Inc., Valeo SA and Yanfeng IAT Co. Ltd.

Market Research Insights

  • The market's dynamism is driven by a complex interplay of consumer design preferences and technological imperatives. Vehicle lightweighting strategies are critical, with new high-performance composites enabling designs that contribute to a 5% improvement in vehicle efficiency. This is balanced against the need for effective regulatory compliance management, particularly concerning global safety standards.
  • OEM-supplier collaboration is intensifying to manage manufacturing complexity challenges and ensure supply chain resilience. Innovations in smart surface technology and next-generation lighting systems are transforming personalized vehicle aesthetics, allowing for unprecedented brand identity through design.
  • However, this integration leads to a spike in post-collision repair costs, which can be over 200% higher than for traditional components, presenting a significant consideration for the total cost of ownership.

We can help! Our analysts can customize this automotive fascia market research report to meet your requirements.

Get in touch

1. Executive Summary

1.1 Market overview

Executive Summary - Chart on Market Overview
Executive Summary - Data Table on Market Overview
Executive Summary - Chart on Global Market Characteristics
Executive Summary - Chart on Market by Geography
Executive Summary - Chart on Market Segmentation by Product
Executive Summary - Chart on Market Segmentation by Vehicle Type
Executive Summary - Chart on Market Segmentation by Material
Executive Summary - Chart on Incremental Growth
Executive Summary - Data Table on Incremental Growth
Executive Summary - Chart on Company Market Positioning

2. Technavio Analysis

2.1 Analysis of price sensitivity, lifecycle, customer purchase basket, adoption rates, and purchase criteria

2.2 Criticality of inputs and Factors of differentiation

Chart on Overview on criticality of inputs and factors of differentiation

2.3 Factors of disruption

Chart on Overview on factors of disruption

2.4 Impact of drivers and challenges

Chart on Impact of drivers and challenges in 2025 and 2030

3. Market Landscape

3.1 Market ecosystem

Chart on Parent Market
Data Table on - Parent Market

3.2 Market characteristics

Chart on Market characteristics analysis

3.3 Value chain analysis

Chart on Value chain analysis

4. Market Sizing

4.1 Market definition

Data Table on Offerings of companies included in the market definition

4.2 Market segment analysis

Market segments

4.3 Market size 2025

4.4 Market outlook: Forecast for 2025-2030

Chart on Global - Market size and forecast 2025-2030 ($ million)
Data Table on Global - Market size and forecast 2025-2030 ($ million)
Chart on Global Market: Year-over-year growth 2025-2030 (%)
Data Table on Global Market: Year-over-year growth 2025-2030 (%)

5. Historic Market Size

5.1 Global Automotive Fascia Market 2020 - 2024

Historic Market Size - Data Table on Global Automotive Fascia Market 2020 - 2024 ($ million)

5.2 Product segment analysis 2020 - 2024

Historic Market Size - Product Segment 2020 - 2024 ($ million)

5.3 Vehicle Type segment analysis 2020 - 2024

Historic Market Size - Vehicle Type Segment 2020 - 2024 ($ million)

5.4 Material segment analysis 2020 - 2024

Historic Market Size - Material Segment 2020 - 2024 ($ million)

5.5 Geography segment analysis 2020 - 2024

Historic Market Size - Geography Segment 2020 - 2024 ($ million)

5.6 Country segment analysis 2020 - 2024

Historic Market Size - Country Segment 2020 - 2024 ($ million)

6. Qualitative Analysis

6.1 Impact of AI on the Global Automotive Fascia Market

7. Five Forces Analysis

7.1 Five forces summary

Five forces analysis - Comparison between 2025 and 2030

7.2 Bargaining power of buyers

Bargaining power of buyers - Impact of key factors 2025 and 2030

7.3 Bargaining power of suppliers

Bargaining power of suppliers - Impact of key factors in 2025 and 2030

7.4 Threat of new entrants

Threat of new entrants - Impact of key factors in 2025 and 2030

7.5 Threat of substitutes

Threat of substitutes - Impact of key factors in 2025 and 2030

7.6 Threat of rivalry

Threat of rivalry - Impact of key factors in 2025 and 2030

7.7 Market condition

Chart on Market condition - Five forces 2025 and 2030

8. Market Segmentation by Product

8.1 Market segments

Chart on Product - Market share 2025-2030 (%)
Data Table on Product - Market share 2025-2030 (%)

8.2 Comparison by Product

Chart on Comparison by Product
Data Table on Comparison by Product

8.3 Front fascia - Market size and forecast 2025-2030

Chart on Front fascia - Market size and forecast 2025-2030 ($ million)
Data Table on Front fascia - Market size and forecast 2025-2030 ($ million)
Chart on Front fascia - Year-over-year growth 2025-2030 (%)
Data Table on Front fascia - Year-over-year growth 2025-2030 (%)

8.4 Rear fascia - Market size and forecast 2025-2030

Chart on Rear fascia - Market size and forecast 2025-2030 ($ million)
Data Table on Rear fascia - Market size and forecast 2025-2030 ($ million)
Chart on Rear fascia - Year-over-year growth 2025-2030 (%)
Data Table on Rear fascia - Year-over-year growth 2025-2030 (%)

8.5 Market opportunity by Product

Market opportunity by Product ($ million)
Data Table on Market opportunity by Product ($ million)

9. Market Segmentation by Vehicle Type

9.1 Market segments

Chart on Vehicle Type - Market share 2025-2030 (%)
Data Table on Vehicle Type - Market share 2025-2030 (%)

9.2 Comparison by Vehicle Type

Chart on Comparison by Vehicle Type
Data Table on Comparison by Vehicle Type

9.3 Passenger vehicles - Market size and forecast 2025-2030

Chart on Passenger vehicles - Market size and forecast 2025-2030 ($ million)
Data Table on Passenger vehicles - Market size and forecast 2025-2030 ($ million)
Chart on Passenger vehicles - Year-over-year growth 2025-2030 (%)
Data Table on Passenger vehicles - Year-over-year growth 2025-2030 (%)

9.4 Commercial vehicle - Market size and forecast 2025-2030

Chart on Commercial vehicle - Market size and forecast 2025-2030 ($ million)
Data Table on Commercial vehicle - Market size and forecast 2025-2030 ($ million)
Chart on Commercial vehicle - Year-over-year growth 2025-2030 (%)
Data Table on Commercial vehicle - Year-over-year growth 2025-2030 (%)

9.5 Market opportunity by Vehicle Type

Market opportunity by Vehicle Type ($ million)
Data Table on Market opportunity by Vehicle Type ($ million)

10. Market Segmentation by Material

10.1 Market segments

Chart on Material - Market share 2025-2030 (%)
Data Table on Material - Market share 2025-2030 (%)

10.2 Comparison by Material

Chart on Comparison by Material
Data Table on Comparison by Material

10.3 Plastic - Market size and forecast 2025-2030

Chart on Plastic - Market size and forecast 2025-2030 ($ million)
Data Table on Plastic - Market size and forecast 2025-2030 ($ million)
Chart on Plastic - Year-over-year growth 2025-2030 (%)
Data Table on Plastic - Year-over-year growth 2025-2030 (%)

10.4 Metal - Market size and forecast 2025-2030

Chart on Metal - Market size and forecast 2025-2030 ($ million)
Data Table on Metal - Market size and forecast 2025-2030 ($ million)
Chart on Metal - Year-over-year growth 2025-2030 (%)
Data Table on Metal - Year-over-year growth 2025-2030 (%)

10.5 Rubber - Market size and forecast 2025-2030

Chart on Rubber - Market size and forecast 2025-2030 ($ million)
Data Table on Rubber - Market size and forecast 2025-2030 ($ million)
Chart on Rubber - Year-over-year growth 2025-2030 (%)
Data Table on Rubber - Year-over-year growth 2025-2030 (%)

10.6 Market opportunity by Material

Market opportunity by Material ($ million)
Data Table on Market opportunity by Material ($ million)

11. Customer Landscape

11.1 Customer landscape overview

Analysis of price sensitivity, lifecycle, customer purchase basket, adoption rates, and purchase criteria

12. Geographic Landscape

12.1 Geographic segmentation

Chart on Market share by geography 2025-2030 (%)
Data Table on Market share by geography 2025-2030 (%)

12.2 Geographic comparison

Chart on Geographic comparison
Data Table on Geographic comparison

12.3 APAC - Market size and forecast 2025-2030

Chart on APAC - Market size and forecast 2025-2030 ($ million)
Data Table on APAC - Market size and forecast 2025-2030 ($ million)
Chart on APAC - Year-over-year growth 2025-2030 (%)
Data Table on APAC - Year-over-year growth 2025-2030 (%)
Chart on Regional Comparison - APAC
Data Table on Regional Comparison - APAC

12.3.1 China - Market size and forecast 2025-2030

Chart on China - Market size and forecast 2025-2030 ($ million)
Data Table on China - Market size and forecast 2025-2030 ($ million)
Chart on China - Year-over-year growth 2025-2030 (%)
Data Table on China - Year-over-year growth 2025-2030 (%)

12.3.2 Japan - Market size and forecast 2025-2030

Chart on Japan - Market size and forecast 2025-2030 ($ million)
Data Table on Japan - Market size and forecast 2025-2030 ($ million)
Chart on Japan - Year-over-year growth 2025-2030 (%)
Data Table on Japan - Year-over-year growth 2025-2030 (%)

12.3.3 India - Market size and forecast 2025-2030

Chart on India - Market size and forecast 2025-2030 ($ million)
Data Table on India - Market size and forecast 2025-2030 ($ million)
Chart on India - Year-over-year growth 2025-2030 (%)
Data Table on India - Year-over-year growth 2025-2030 (%)

12.3.4 South Korea - Market size and forecast 2025-2030

Chart on South Korea - Market size and forecast 2025-2030 ($ million)
Data Table on South Korea - Market size and forecast 2025-2030 ($ million)
Chart on South Korea - Year-over-year growth 2025-2030 (%)
Data Table on South Korea - Year-over-year growth 2025-2030 (%)

12.3.5 Australia - Market size and forecast 2025-2030

Chart on Australia - Market size and forecast 2025-2030 ($ million)
Data Table on Australia - Market size and forecast 2025-2030 ($ million)
Chart on Australia - Year-over-year growth 2025-2030 (%)
Data Table on Australia - Year-over-year growth 2025-2030 (%)

12.3.6 Indonesia - Market size and forecast 2025-2030

Chart on Indonesia - Market size and forecast 2025-2030 ($ million)
Data Table on Indonesia - Market size and forecast 2025-2030 ($ million)
Chart on Indonesia - Year-over-year growth 2025-2030 (%)
Data Table on Indonesia - Year-over-year growth 2025-2030 (%)

12.4 North America - Market size and forecast 2025-2030

Chart on North America - Market size and forecast 2025-2030 ($ million)
Data Table on North America - Market size and forecast 2025-2030 ($ million)
Chart on North America - Year-over-year growth 2025-2030 (%)
Data Table on North America - Year-over-year growth 2025-2030 (%)
Chart on Regional Comparison - North America
Data Table on Regional Comparison - North America

12.4.1 US - Market size and forecast 2025-2030

Chart on US - Market size and forecast 2025-2030 ($ million)
Data Table on US - Market size and forecast 2025-2030 ($ million)
Chart on US - Year-over-year growth 2025-2030 (%)
Data Table on US - Year-over-year growth 2025-2030 (%)

12.4.2 Mexico - Market size and forecast 2025-2030

Chart on Mexico - Market size and forecast 2025-2030 ($ million)
Data Table on Mexico - Market size and forecast 2025-2030 ($ million)
Chart on Mexico - Year-over-year growth 2025-2030 (%)
Data Table on Mexico - Year-over-year growth 2025-2030 (%)

12.4.3 Canada - Market size and forecast 2025-2030

Chart on Canada - Market size and forecast 2025-2030 ($ million)
Data Table on Canada - Market size and forecast 2025-2030 ($ million)
Chart on Canada - Year-over-year growth 2025-2030 (%)
Data Table on Canada - Year-over-year growth 2025-2030 (%)

12.5 Europe - Market size and forecast 2025-2030

Chart on Europe - Market size and forecast 2025-2030 ($ million)
Data Table on Europe - Market size and forecast 2025-2030 ($ million)
Chart on Europe - Year-over-year growth 2025-2030 (%)
Data Table on Europe - Year-over-year growth 2025-2030 (%)
Chart on Regional Comparison - Europe
Data Table on Regional Comparison - Europe

12.5.1 Germany - Market size and forecast 2025-2030

Chart on Germany - Market size and forecast 2025-2030 ($ million)
Data Table on Germany - Market size and forecast 2025-2030 ($ million)
Chart on Germany - Year-over-year growth 2025-2030 (%)
Data Table on Germany - Year-over-year growth 2025-2030 (%)

12.5.2 UK - Market size and forecast 2025-2030

Chart on UK - Market size and forecast 2025-2030 ($ million)
Data Table on UK - Market size and forecast 2025-2030 ($ million)
Chart on UK - Year-over-year growth 2025-2030 (%)
Data Table on UK - Year-over-year growth 2025-2030 (%)

12.5.3 France - Market size and forecast 2025-2030

Chart on France - Market size and forecast 2025-2030 ($ million)
Data Table on France - Market size and forecast 2025-2030 ($ million)
Chart on France - Year-over-year growth 2025-2030 (%)
Data Table on France - Year-over-year growth 2025-2030 (%)

12.5.4 Italy - Market size and forecast 2025-2030

Chart on Italy - Market size and forecast 2025-2030 ($ million)
Data Table on Italy - Market size and forecast 2025-2030 ($ million)
Chart on Italy - Year-over-year growth 2025-2030 (%)
Data Table on Italy - Year-over-year growth 2025-2030 (%)

12.5.5 Spain - Market size and forecast 2025-2030

Chart on Spain - Market size and forecast 2025-2030 ($ million)
Data Table on Spain - Market size and forecast 2025-2030 ($ million)
Chart on Spain - Year-over-year growth 2025-2030 (%)
Data Table on Spain - Year-over-year growth 2025-2030 (%)

12.5.6 The Netherlands - Market size and forecast 2025-2030

Chart on The Netherlands - Market size and forecast 2025-2030 ($ million)
Data Table on The Netherlands - Market size and forecast 2025-2030 ($ million)
Chart on The Netherlands - Year-over-year growth 2025-2030 (%)
Data Table on The Netherlands - Year-over-year growth 2025-2030 (%)

12.6 Middle East and Africa - Market size and forecast 2025-2030

Chart on Middle East and Africa - Market size and forecast 2025-2030 ($ million)
Data Table on Middle East and Africa - Market size and forecast 2025-2030 ($ million)
Chart on Middle East and Africa - Year-over-year growth 2025-2030 (%)
Data Table on Middle East and Africa - Year-over-year growth 2025-2030 (%)
Chart on Regional Comparison - Middle East and Africa
Data Table on Regional Comparison - Middle East and Africa

12.6.1 Saudi Arabia - Market size and forecast 2025-2030

Chart on Saudi Arabia - Market size and forecast 2025-2030 ($ million)
Data Table on Saudi Arabia - Market size and forecast 2025-2030 ($ million)
Chart on Saudi Arabia - Year-over-year growth 2025-2030 (%)
Data Table on Saudi Arabia - Year-over-year growth 2025-2030 (%)

12.6.2 UAE - Market size and forecast 2025-2030

Chart on UAE - Market size and forecast 2025-2030 ($ million)
Data Table on UAE - Market size and forecast 2025-2030 ($ million)
Chart on UAE - Year-over-year growth 2025-2030 (%)
Data Table on UAE - Year-over-year growth 2025-2030 (%)

12.6.3 South Africa - Market size and forecast 2025-2030

Chart on South Africa - Market size and forecast 2025-2030 ($ million)
Data Table on South Africa - Market size and forecast 2025-2030 ($ million)
Chart on South Africa - Year-over-year growth 2025-2030 (%)
Data Table on South Africa - Year-over-year growth 2025-2030 (%)

12.6.4 Israel - Market size and forecast 2025-2030

Chart on Israel - Market size and forecast 2025-2030 ($ million)
Data Table on Israel - Market size and forecast 2025-2030 ($ million)
Chart on Israel - Year-over-year growth 2025-2030 (%)
Data Table on Israel - Year-over-year growth 2025-2030 (%)

12.6.5 Turkey - Market size and forecast 2025-2030

Chart on Turkey - Market size and forecast 2025-2030 ($ million)
Data Table on Turkey - Market size and forecast 2025-2030 ($ million)
Chart on Turkey - Year-over-year growth 2025-2030 (%)
Data Table on Turkey - Year-over-year growth 2025-2030 (%)

12.7 South America - Market size and forecast 2025-2030

Chart on South America - Market size and forecast 2025-2030 ($ million)
Data Table on South America - Market size and forecast 2025-2030 ($ million)
Chart on South America - Year-over-year growth 2025-2030 (%)
Data Table on South America - Year-over-year growth 2025-2030 (%)
Chart on Regional Comparison - South America
Data Table on Regional Comparison - South America

12.7.1 Brazil - Market size and forecast 2025-2030

Chart on Brazil - Market size and forecast 2025-2030 ($ million)
Data Table on Brazil - Market size and forecast 2025-2030 ($ million)
Chart on Brazil - Year-over-year growth 2025-2030 (%)
Data Table on Brazil - Year-over-year growth 2025-2030 (%)

12.7.2 Argentina - Market size and forecast 2025-2030

Chart on Argentina - Market size and forecast 2025-2030 ($ million)
Data Table on Argentina - Market size and forecast 2025-2030 ($ million)
Chart on Argentina - Year-over-year growth 2025-2030 (%)
Data Table on Argentina - Year-over-year growth 2025-2030 (%)

12.7.3 Colombia - Market size and forecast 2025-2030

Chart on Colombia - Market size and forecast 2025-2030 ($ million)
Data Table on Colombia - Market size and forecast 2025-2030 ($ million)
Chart on Colombia - Year-over-year growth 2025-2030 (%)
Data Table on Colombia - Year-over-year growth 2025-2030 (%)

12.8 Market opportunity by geography

Market opportunity by geography ($ million)
Data Tables on Market opportunity by geography ($ million)

13. Drivers, Challenges, and Opportunity

13.1 Market drivers

Proliferation of electric vehicles and redefinition of front end design
Integration of advanced driver assistance systems and autonomous driving sensors
Emphasis on aesthetics and personalization

13.2 Market challenges

Escalating manufacturing complexity and associated cost pressures
Raw material price volatility
Compliance with fragmented and evolving global regulatory framework

13.3 Impact of drivers and challenges

Impact of drivers and challenges in 2025 and 2030

13.4 Market opportunities

Intelligent fascias as integrated technology hubs
Imperative of sustainability and lightweighting
Aerodynamic optimization and design differentiation in electric vehicle era

14. Competitive Landscape

14.1 Overview

14.2

Overview on criticality of inputs and factors of differentiation

14.3 Landscape disruption

Overview on factors of disruption

14.4 Industry risks

Impact of key risks on business

15. Competitive Analysis

15.1 Companies profiled

Companies covered

15.2 Company ranking index

15.3 Market positioning of companies

Matrix on companies position and classification

15.4 AGS Automotive Systems

AGS Automotive Systems - Overview
AGS Automotive Systems - Product / Service
AGS Automotive Systems - Key offerings
SWOT

15.5 Dorman Products Inc.

Dorman Products Inc. - Overview
Dorman Products Inc. - Product / Service
Dorman Products Inc. - Key news
Dorman Products Inc. - Key offerings
SWOT

15.6 FALTEC Co. Ltd.

FALTEC Co. Ltd. - Overview
FALTEC Co. Ltd. - Product / Service
FALTEC Co. Ltd. - Key offerings
SWOT

15.7 FlexNGate Group of Companies

FlexNGate Group of Companies - Overview
FlexNGate Group of Companies - Product / Service
FlexNGate Group of Companies - Key offerings
SWOT

15.8 Forvia SE

Forvia SE - Overview
Forvia SE - Business segments
Forvia SE - Key offerings
Forvia SE - Segment focus
SWOT

15.9 Hyundai Mobis Co. Ltd.

Hyundai Mobis Co. Ltd. - Overview
Hyundai Mobis Co. Ltd. - Business segments
Hyundai Mobis Co. Ltd. - Key offerings
Hyundai Mobis Co. Ltd. - Segment focus
SWOT

15.10 INOAC Corp.

INOAC Corp. - Overview
INOAC Corp. - Product / Service
INOAC Corp. - Key offerings
SWOT

15.11 Magna International Inc.

Magna International Inc. - Overview
Magna International Inc. - Business segments
Magna International Inc. - Key news
Magna International Inc. - Key offerings
Magna International Inc. - Segment focus
SWOT

15.12 Motherson Group

Motherson Group - Overview
Motherson Group - Business segments
Motherson Group - Key offerings
Motherson Group - Segment focus
SWOT

15.13 Novares

Novares - Overview
Novares - Product / Service
Novares - Key offerings
SWOT

15.14 Shiloh Industries Inc.

Shiloh Industries Inc. - Overview
Shiloh Industries Inc. - Product / Service
Shiloh Industries Inc. - Key offerings
SWOT

15.15 Toyoda Gosei Co. Ltd.

Toyoda Gosei Co. Ltd. - Overview
Toyoda Gosei Co. Ltd. - Business segments
Toyoda Gosei Co. Ltd. - Key offerings
Toyoda Gosei Co. Ltd. - Segment focus
SWOT

15.16 T-Rex Truck Products Inc.

T-Rex Truck Products Inc. - Overview
T-Rex Truck Products Inc. - Product / Service
T-Rex Truck Products Inc. - Key offerings
SWOT

15.17 Valeo SA

Valeo SA - Overview
Valeo SA - Business segments
Valeo SA - Key news
Valeo SA - Key offerings
Valeo SA - Segment focus
SWOT

15.18 Yanfeng IAT Co. Ltd.

Yanfeng IAT Co. Ltd. - Overview
Yanfeng IAT Co. Ltd. - Product / Service
Yanfeng IAT Co. Ltd. - Key offerings
SWOT

16. Appendix

16.1 Scope of the report

Market definition
Objectives
Notes and caveats

16.2 Inclusions and exclusions checklist

Inclusions checklist
Exclusions checklist

16.3 Currency conversion rates for US$

16.4 Research methodology

16.5 Data procurement

Information sources

16.6 Data validation

16.7 Validation techniques employed for market sizing

16.8 Data synthesis

16.9 360 degree market analysis

16.10 List of abbreviations

Research Methodology

Technavio presents a detailed picture of the market by way of study, synthesis, and summation of data from multiple sources. The analysts have presented the various facets of the market with a particular focus on identifying the key industry influencers. The data thus presented is comprehensive, reliable, and the result of extensive research, both primary and secondary.

INFORMATION SOURCES

Primary sources

  • Manufacturers and suppliers
  • Channel partners
  • Industry experts
  • Strategic decision makers

Secondary sources

  • Industry journals and periodicals
  • Government data
  • Financial reports of key industry players
  • Historical data
  • Press releases

DATA ANALYSIS

Data Synthesis

  • Collation of data
  • Estimation of key figures
  • Analysis of derived insights

Data Validation

  • Triangulation with data models
  • Reference against proprietary databases
  • Corroboration with industry experts

REPORT WRITING

Qualitative

  • Market drivers
  • Market challenges
  • Market trends
  • Five forces analysis

Quantitative

  • Market size and forecast
  • Market segmentation
  • Geographical insights
  • Competitive landscape

Interested in this report?

Get your sample now to see our research methodology and insights!

Download Now

Frequently Asked Questions

Automotive Fascia market growth will increase by USD 7990.3 million during 2026-2030 .

The Automotive Fascia market is expected to grow at a CAGR of 6.1% during 2026-2030 .

Automotive Fascia market is segmented by Product (Front fascia, Rear fascia) Vehicle type (Passenger vehicles, Commercial vehicle) Material (Plastic, Metal, Rubber)

AGS Automotive Systems, ams OSRAM AG, Dorman Products Inc., FALTEC Co. Ltd., FlexNGate Group of Companies, Forvia SE, HELLA GmbH and Co. KGaA, Hyundai Mobis Co. Ltd., INOAC Corp., Magna International Inc., Motherson Group, Novares, Shiloh Industries Inc., Toyoda Gosei Co. Ltd., T-Rex Truck Products Inc., Valeo SA, Yanfeng IAT Co. Ltd. are a few of the key vendors in the Automotive Fascia market.

APAC will register the highest growth rate of 47.9% among the other regions. Therefore, the Automotive Fascia market in APAC is expected to garner significant business opportunities for the vendors during the forecast period.

China, Japan, India, South Korea, Australia, Indonesia, US, Mexico, Canada, Germany, UK, France, Italy, Spain, The Netherlands, Saudi Arabia, UAE, South Africa, Israel, Turkey, Brazil, Argentina, Colombia

  • Proliferation of electric vehicles and redefinition of front end design is the driving factor this market.

The Automotive Fascia market vendors should focus on grabbing business opportunities from the Product segment as it accounted for the largest market share in the base year.