
Automotive Halogen Headlights Market Size 2025-2029
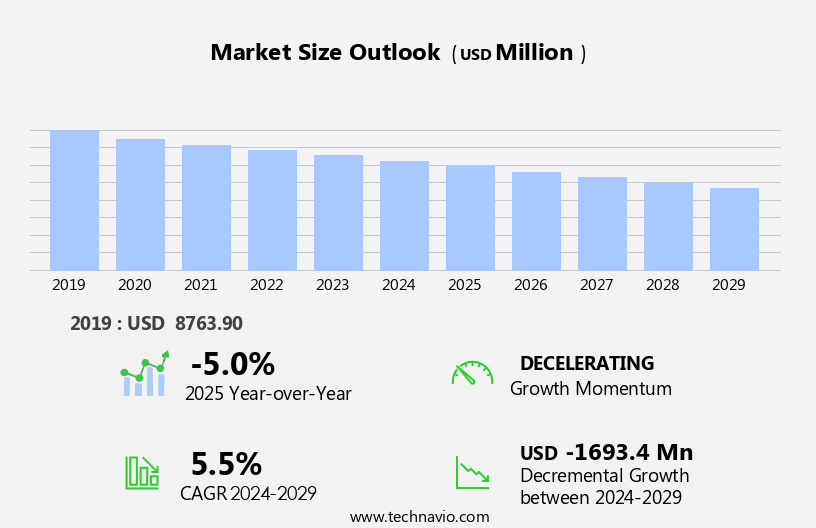
The automotive halogen headlights market size is forecast to decrease by USD 1.69 billion at a CAGR of -5.5% between 2024 and 2029.
- The market is driven by the importance of road safety and the essential role of lighting in ensuring safe and efficient transportation. Halogen headlights, which utilize a tungsten filament heated by an electric current to produce light, have been a popular choice in the automotive industry due to their lower cost benefits compared to other headlight types. However, the market is witnessing a shift towards advanced lighting technologies such as LED and laser headlights, which offer improved visibility and energy efficiency. Despite this trend, halogen headlights continue to find applications in various segments, including buses and economy cars. Moreover, the development of projector-based halogen headlights has enhanced their performance and appeal, making them a viable option for luxury cars as well. Overall, the market is expected to experience moderate growth, driven by the ongoing demand for cost-effective lighting solutions and the continuous efforts to improve the technology.
What will be the Size of the Automotive Halogen Headlights Market During the Forecast Period?
- The market encompasses the production and supply of halogen bulbs used in automotive lighting systems. Halogen bulbs, which utilize a halogen gas and tungsten filament, provide strong light output and extended rated life. Two primary types exist within this market: short-arc and long-arc halogen bulbs. Short-arc bulbs, also known as quartz-halogen bulbs, offer superior light intensity and are commonly used in luxury vehicles. Long-arc bulbs, on the other hand, provide a broader light distribution and are often found in standard automotive lighting equipment. Consumer preferences for automotive halogen headlights continue to evolve, with a focus on on-road safety, energy-efficiency, and cost-effectiveness.
- Regulations governing automotive lighting and traffic safety further influence market dynamics. As the production of vehicles shifts towards electric propulsion, the role of halogen headlights in the automotive landscape is subject to change. The market's size and direction remain influenced by factors such as vehicle type, lifestyle, and lighting regulations, with ongoing advancements in lighting technology and energy-efficient alternatives, like LEDs, posing potential competition.
How is this Automotive Halogen Headlights Industry segmented and which is the largest segment?
The automotive halogen headlights industry research report provides comprehensive data (region-wise segment analysis), with forecasts and estimates in "USD billion" for the period 2025-2029, as well as historical data from 2019-2023 for the following segments.
- Application
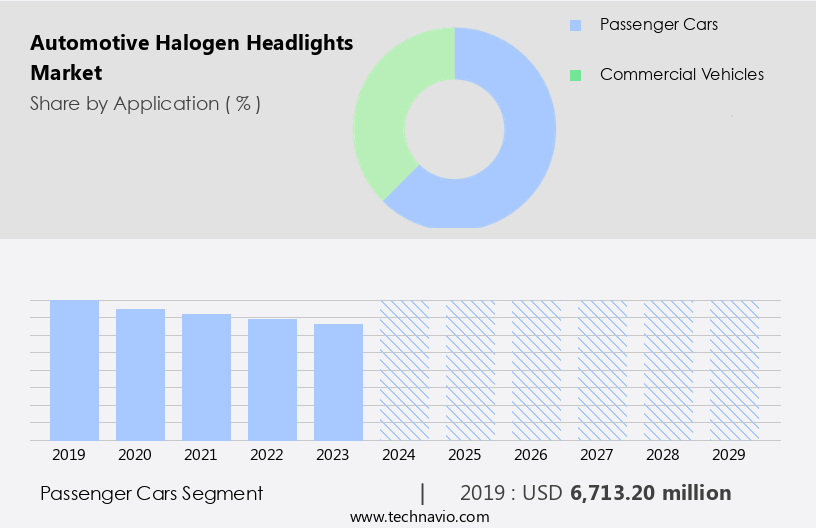
- Passenger cars
- Commercial vehicles
- Channel
- OEM
- Aftermarket
- Type
- Low beam lights
- High beam lights
- Technology
- Halogen with xenon
- Standard halogen
- Halogen with LED
- Geography
- APAC
- China
- India
- Japan
- South Korea
- Europe
- Germany
- UK
- Italy
- North America
- Canada
- US
- South America
- Middle East and Africa
- APAC
By Application Insights
- The passenger cars segment is estimated to witness significant growth during the forecast period.
The market experienced significant growth due to the widespread use of halogen bulbs in passenger vehicles. Halogen bulbs, which utilize a tungsten filament heated by an arc of halogen gas, offer high-brightness applications such as searchlights, large film projectors, floodlights, and automotive headlights. Halogen headlights provide improved road visibility, contributing to on-road safety and reducing traffic accidents. However, the market is facing challenges as passenger cars shift towards energy-efficient LED technology. The passenger cars segment, the largest in the automotive industry, is the primary market for halogen headlights. Its adoption is influenced by factors such as vehicle ownership, consumer preferences, and safety concerns.
Get a glance at the market report of share of various segments Request Free Sample
The passenger cars segment was valued at USD 6.71 billion in 2019 and showed a gradual increase during the forecast period.
Regional Analysis
- Middle East and Africa is estimated to contribute 2% to the growth of the global market during the forecast period.
Technavio's analysts have elaborately explained the regional trends and drivers that shape the market during the forecast period.

For more insights on the market size of various regions, Request Free Sample
The market in APAC is driven by China's strong economy and high population, making it a significant contributor to the global market. With China being a manufacturing hub for international OEMs and tire suppliers, the region's automotive industry is thriving. In APAC, countries like India and China have high vehicle adoption rates, while Japan and South Korea are established automotive markets. As a result, the region accounts for a substantial share of The market. Halogen bulbs, which use a tungsten filament heated by an electric current in a halogen gas-filled quartz envelope, are widely used in automotive headlights.
Market Dynamics
Our researchers analyzed the data with 2024 as the base year, along with the key drivers, trends, and challenges. A holistic analysis of drivers will help companies refine their marketing strategies to gain a competitive advantage.
What are the key market drivers leading to the rise in the adoption of Automotive Halogen Headlights Industry?
Lower cost benefits of halogen headlights over the headlight types is the key driver of the market.
- Halogen bulbs remain a popular choice for automotive headlights due to their cost-effectiveness and long-life span. Replacing a halogen headlight typically costs between USD 250 and USD 1,000, with the bulb assembly priced between USD 75 and USD 400. Labor costs, which can range from 1 to 5 hours, account for the remainder. Halogen headlights' affordability, coupled with their durability, contributes significantly to their market dominance. Halogen reflectors, the most fundamental type of headlights, are commonly used in mini vehicles worldwide. Halogen gas, an inert gas, is used in these bulbs to generate light through an electric arc between two tungsten filaments. The resulting light output is rated at 1,200 to 2,500 lumens, with a lifespan of approximately 1,000 hours.
- Halogen bulbs are available in two main types: short-arc and long-arc. Short-arc bulbs are used in halogen flashlights and high-brightness applications such as searchlights, large film projectors, and floodlights. Long-arc bulbs, on the other hand, are used in passenger vehicles and commercial vehicles for both headlights and tail lights. Automotive lighting standardization, driven by safety concerns and consumer preferences, has led to the adoption of halogen headlights as an automotive lighting standard. As vehicle electrification and sustainability become increasingly important, organizations are exploring innovative solutions such as light-emitting diodes (LEDs), laser headlights, and adaptive lighting systems. Despite these advancements, halogen bulbs continue to play a significant role in the automotive lighting market due to their cost-effectiveness, durability, and reliability.
What are the market trends shaping the Automotive Halogen Headlights Industry?
Development of halogen headlights with improved visibility is the upcoming market trend.
- The automotive halogen bulbs market continues to dominate the industry due to their affordability, despite the emergence of alternative lighting solutions like xenon and LED headlights. The light output is a crucial factor in nighttime driving, making halogen headlights an essential component for vehicle safety. In response to market demands, manufacturers have engineered halogen headlights that integrate lamp technologies akin to xenon or LED, resulting in whiter or bluer light. This evolution in halogen headlight design addresses consumer preferences for improved brightness and road visibility. Halogen short-arc and long-arc lights remain widely used in various applications, including searchlights, large film projectors, floodlights, and passenger and commercial vehicles.
- As the automotive industry advances, automotive lighting standardization, vehicle electrification, and sustainability become increasingly important. Safety concerns, such as preventing road accidents due to obstruction or mishaps, remain a priority for car users. Therefore, the development of advanced lighting systems, such as adaptive headlights, connected lighting, and dual-beam halogen bulbs, is essential. These improvements not only enhance aesthetics but also contribute to lower costs, longer lifespan, and increased durability and reliability for fleet managers, organizations, and vehicle manufacturers.
What challenges does the Automotive Halogen Headlights Industry face during its growth?
Growing popularity of LED and laser headlights is a key challenge affecting the industry growth.
- The automotive lighting market has witnessed significant advancements since the adoption of incandescent bulbs in vehicles. While laser and LED headlights represent modern lighting technologies, their high costs limit their usage to luxury cars. The increasing demand for these advanced lighting solutions poses a challenge to the growth of The market. Halogen headlights operate using a halogen gas-filled bulb with tungsten filaments. They offer high light output and a rated life of up to 1,000 hours. Halogen short-arc lights are commonly used in searchlights, large film projectors, floodlights, and other high-brightness applications. In contrast, halogen long-arc lights are utilized in industrial applications, such as welding and metal processing.
- Halogen bulbs continue to dominate the automotive lighting landscape due to their affordability and availability in the aftermarket. Automotive lighting standardization, vehicle ownership patterns, and safety concerns are significant factors driving the demand for halogen headlights. However, the shift towards vehicle electrification, sustainability, and energy efficiency is expected to impact the market dynamics. Improved halogen bulbs, such as dual-beam halogen bulbs with dual metal filaments, cater to the demand for higher brightness and whiter light output. Custom lighting, lighting design, and aesthetics are also essential factors influencing consumer preferences. Despite the emergence of new technologies, such as light-emitting diodes (LEDs), halogen headlights continue to be a popular choice for passenger vehicles and commercial vehicles due to their lower costs and durability.
Exclusive Customer Landscape
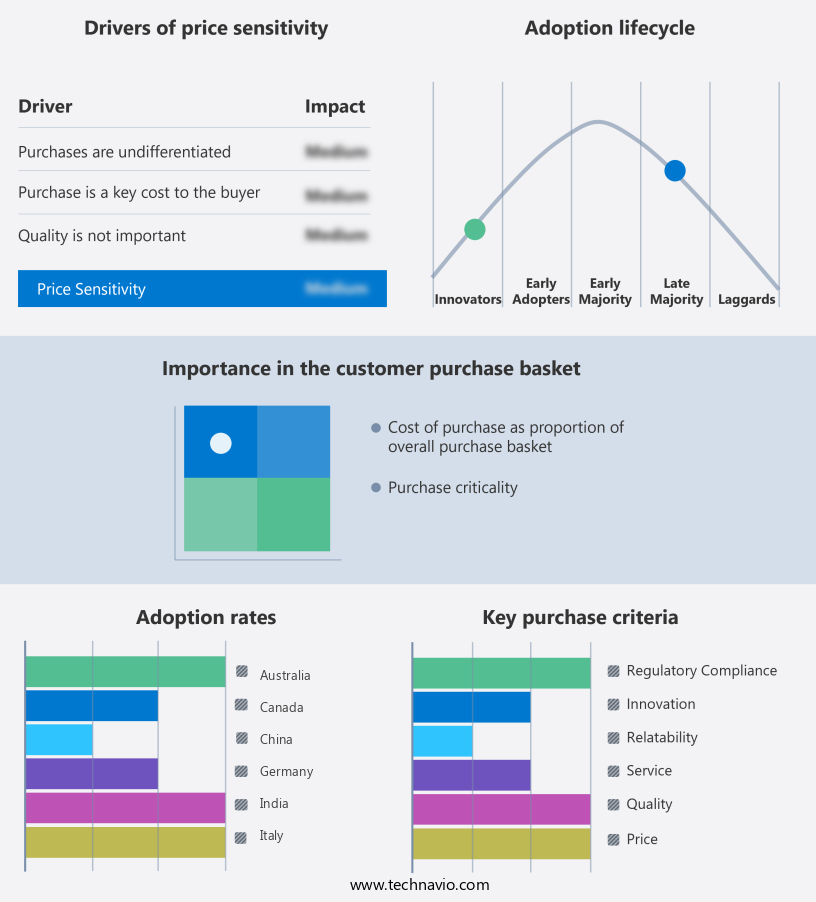
The automotive halogen headlights market forecasting report includes the adoption lifecycle of the market, covering from the innovator's stage to the laggard's stage. It focuses on adoption rates in different regions based on penetration. Furthermore, the automotive halogen headlights market report also includes key purchase criteria and drivers of price sensitivity to help companies evaluate and develop their market growth analysis strategies.
Customer Landscape
Key Companies & Market Insights
Companies are implementing various strategies, such as strategic alliances, automotive halogen headlights market forecast, partnerships, mergers and acquisitions, geographical expansion, and product/service launches, to enhance their presence in the industry.
ams OSRAM AG - The company offers automotive halogen headlights that includes LED lamps, LED high and low beam lamps, LED fog lamps, LED signal lamps, LED interior lamps, LED retrofit lamps, xenon headlight lamps, halogen headlight lamps, and night breaker laser.
The industry research and growth report includes detailed analyses of the competitive landscape of the market and information about key companies, including:
- Autolite India Ltd.
- HELLA GmbH and Co. KGaA
- Hyundai Motor Co.
- J.B.INDUSTRIES
- Koito Manufacturing Co. Ltd.
- Koninklijke Philips NV
- LG Corp.
- Lumax Industries Ltd
- Lumileds Holding BV
- Minda Industries Ltd.
- RAJ ENTERPRISES
- Robert Bosch GmbH
- Sunway Autoparts
- Suprajit Engineering Ltd.
- TA YIH INDUSTRIAL Co. Ltd.
- Tungsram Operations Kft
- Uravi T and Wedge Lamps Ltd.
- Valeo SA
- Varroc Engineering Ltd.
Qualitative and quantitative analysis of companies has been conducted to help clients understand the wider business environment as well as the strengths and weaknesses of key industry players. Data is qualitatively analyzed to categorize companies as pure play, category-focused, industry-focused, and diversified; it is quantitatively analyzed to categorize companies as dominant, leading, strong, tentative, and weak.
Research Analyst Overview
The automotive halogen bulbs market encompasses various applications, including short-arc and long-arc halogen lights, halogen flashlights, and arc lamps. These lighting solutions are widely used in high-brightness applications such as searchlights, large film projectors, floodlights, and passenger vehicles. Halogen bulbs provide superior light output, making them an ideal choice for enhancing road visibility and ensuring safety in various automotive applications. The fundamental components of halogen bulbs include halogen gas, conductors, and carbon rods. The halogen gas maintains a constant pressure within the bulb, preventing the filament from oxidizing and increasing the bulb's lifespan. The conductors facilitate the flow of electrical current, while carbon rods serve as the filaments that emit light when heated.
In addition, halogen bulbs are known for their versatility, as they cater to diverse automotive needs. In passenger vehicles, they are used for headlights, tail lights, and interior lighting. Commercial vehicles, such as buses and robo taxis, also rely on halogen bulbs for their durability and reliability. Moreover, halogen bulbs are increasingly being adopted in advanced lighting systems, including adaptive headlights and connected lighting, to enhance the driving experience and improve safety. The automotive lighting market is witnessing significant advancements, with a focus on energy efficiency, sustainability, and vehicle electrification. Innovative solutions, such as light-emitting diodes (LED) and laser headlights, are gaining popularity due to their energy efficiency and longer lifespan.
However, halogen bulbs continue to hold a significant market share, especially in the aftermarket due to their lower costs and availability. The automotive lighting standardization process is essential for ensuring safety and compatibility across various vehicle types and models. This process involves collaboration between vehicle manufacturers, lighting equipment suppliers, and regulatory bodies to establish uniform lighting regulations and guidelines. The importance of halogen headlights in on-road safety is undeniable. They play a crucial role in preventing road accidents, collisions, and mishaps by enhancing road visibility and providing adequate illumination during nighttime driving. Moreover, the increasing popularity of large vehicles, such as buses and commercial trucks, and the rising number of bikers on the road underscores the importance of high-performance headlights for ensuring safety and reducing fatalities, particularly on rural interstates.
Furthermore, as vehicle electrification gains momentum, the automotive lighting market is evolving to cater to the unique requirements of electric and autonomous vehicles. For instance, dynamic light systems are being developed to enhance the safety and efficiency of robo taxis and other autonomous vehicles. The market is driven by factors such as safety concerns, consumer preferences, and regulatory requirements, with a focus on improving road visibility, energy efficiency, and durability. As the automotive industry continues to evolve, halogen bulbs will remain an essential component of automotive lighting systems, alongside new technologies such as LED and laser headlights.
|
Market Scope |
|
|
Report Coverage |
Details |
|
Page number |
231 |
|
Base year |
2024 |
|
Historic period |
2019-2023 |
|
Forecast period |
2025-2029 |
|
Growth momentum & CAGR |
Decelerate at a CAGR of -5.5% |
|
Market growth 2025-2029 |
USD -1.69 billion |
|
Market structure |
Fragmented |
|
YoY growth 2024-2025(%) |
-5.0 |
|
Key countries |
US, China, Japan, India, South Korea, Canada, UK, Australia, Germany, and Italy |
|
Competitive landscape |
Leading Companies, market growth and forecasting , Market Positioning of Companies, Competitive Strategies, and Industry Risks |
What are the Key Data Covered in this Automotive Halogen Headlights Market Research and Growth Report?
- CAGR of the Automotive Halogen Headlights industry during the forecast period
- Detailed information on factors that will drive the growth and forecasting between 2025 and 2029
- Precise estimation of the size of the market and its contribution of the industry in focus to the parent market
- Accurate predictions about upcoming growth and trends and changes in consumer behaviour
- Growth of the market across APAC, Europe, North America, South America, and Middle East and Africa
- Thorough analysis of the market's competitive landscape and detailed information about companies
- Comprehensive analysis of factors that will challenge the automotive halogen headlights market growth of industry companies
We can help! Our analysts can customize this automotive halogen headlights market research report to meet your requirements.
 RIA -
RIA - 
