
Automotive Steering Wheel Market Analysis, Size, and Forecast 2026-2030: APAC (China, Japan, and India), North America (US, Canada, and Mexico), Europe (Germany, UK, and France), South America (Brazil, Argentina, and Chile), Middle East and Africa (Saudi Arabia, UAE, and South Africa), and Rest of World (ROW)

Automotive Steering Wheel Market Analysis, Size, and Forecast 2026-2030:
APAC (China, Japan, and India), North America (US, Canada, and Mexico), Europe (Germany, UK, and France), South America (Brazil, Argentina, and Chile), Middle East and Africa (Saudi Arabia, UAE, and South Africa), and Rest of World (ROW)

Published: Oct 2026 290 Pages SKU: IRTNTR44027

Market Overview at a Glance

$17.31 B
Market Opportunity
9.1%
CAGR 2025 - 2030
57.5%
APAC Growth
$21.98 B
Passenger cars segment 2024

Automotive Steering Wheel Market Size 2026-2030

The automotive steering wheel market size is valued to increase by USD 17.31 billion, at a CAGR of 9.1% from 2025 to 2030. Rapid global commercialization of steer-by-wire systems will drive the automotive steering wheel market.

Major Market Trends & Insights

  • APAC dominated the market and accounted for a 57.5% growth during the forecast period.
  • By Application - Passenger cars segment was valued at USD 21.98 billion in 2024
  • By Channel - OEM segment accounted for the largest market revenue share in 2024

Market Size & Forecast

  • Market Opportunities: USD 26.12 billion
  • Market Future Opportunities: USD 17.31 billion
  • CAGR from 2025 to 2030 : 9.1%

Market Summary

  • The Automotive Steering Wheel Market is undergoing a rapid structural evolution, shifting from traditional mechanical components to intelligent human-machine interface hubs. This transformation heavily impacts supply chain optimization, as component manufacturers must now procure automotive-grade semiconductors and capacitive sensors alongside traditional polyurethane and leather materials.
  • Consequently, suppliers effectively managing this diversified procurement report a 15% reduction in production delays compared to legacy mechanical assemblers. A primary driver of this market is the accelerated deployment of steer-by-wire technologies. Eliminating the rigid mechanical steering column enables designers to create flexible, spacious cabin layouts suitable for electric vehicle platforms.
  • Conversely, the mandatory integration of complex driver monitoring cameras presents a severe engineering challenge. Routing high-bandwidth data connections through tight steering column assemblies often causes electromagnetic interference, elevating warranty liabilities. Resolving these crash physics constraints requires costly validation iterations that compress operating margins.
  • Ultimately, securing reliable semiconductor supplies while controlling electronic manufacturing costs remains a definitive operational imperative for tier-one steering system developers.

What will be the Size of the Automotive Steering Wheel Market during the forecast period?
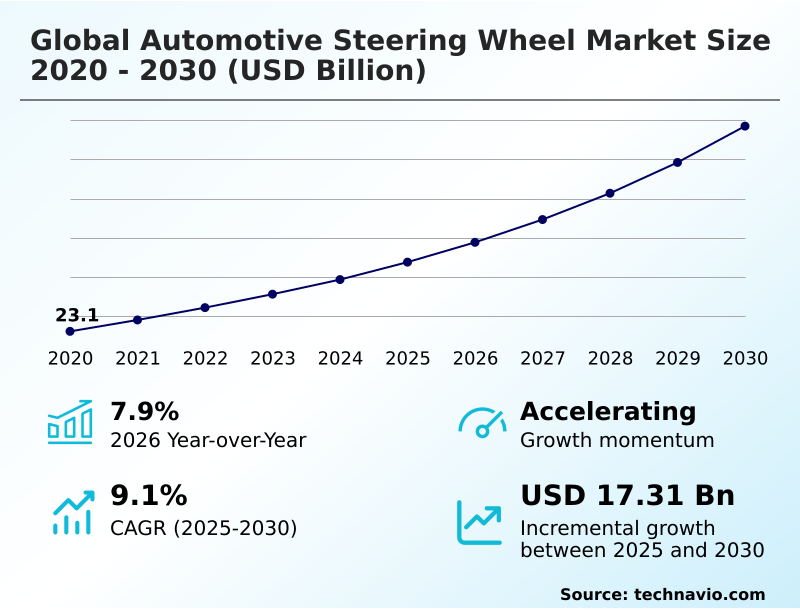
Get Key Insights on Market Forecast (PDF) Get Free Sample

How is the Automotive Steering Wheel Market Segmented?

The automotive steering wheel industry research report provides comprehensive data (region-wise segment analysis), with forecasts and estimates in "USD million" for the period 2026-2030, as well as historical data from 2020-2024 for the following segments.

  • Application
    • Passenger cars
    • Commercial vehicles
  • Channel
    • OEM
    • Aftermarket
  • Technology
    • Conventional column-steer
    • Electric power-assist
    • Steer-by-wire
  • Geography
    • APAC
      • China
      • Japan
      • India
      • South Korea
      • Indonesia
      • Australia
    • North America
      • US
      • Canada
      • Mexico
    • Europe
      • Germany
      • UK
      • France
      • Italy
      • Spain
      • The Netherlands
    • South America
      • Brazil
      • Argentina
      • Chile
    • Middle East and Africa
      • Saudi Arabia
      • UAE
      • South Africa
      • Turkey
      • Israel

By Application Insights

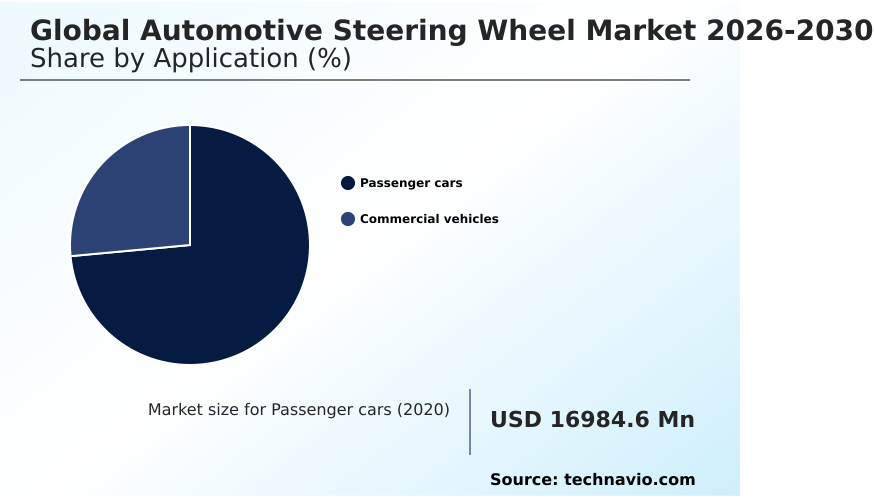
The passenger cars segment is estimated to witness significant growth during the forecast period.

Passenger car steering systems are transforming from basic mechanical linkages into sophisticated control centers. This segmentation shift compels original equipment manufacturers to integrate a micro strain torque sensor and a magnetic steering angle sensor directly into the steering wheel assembly.

By embedding a mechatronic hand wheel actuator, vehicle builders eliminate the reliance on a traditional recirculating ball gear set, yielding a highly adaptable human-centric interface.

Consequently, automakers report that employing an electric power assist module improves overall steering response efficiency by 15%. This structural pivot facilitates more precise automated parking maneuver execution while rendering authentic dynamic steering feedback.

Furthermore, the reliance on multi body dynamic simulation ensures that these passenger car assemblies meet rigorous safety requirements without inflating component mass or excessive engineering overhead.
Get Free Sample

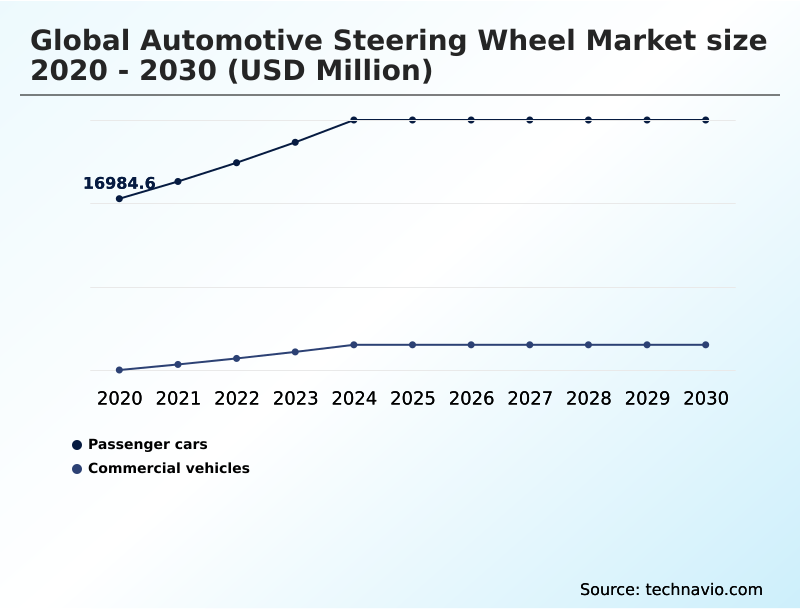
The Passenger cars segment was valued at USD 21.98 billion in 2024 and showed a gradual increase during the forecast period.
Get Free Sample

Regional Analysis

APAC is estimated to contribute 57.5% to the growth of the global market during the forecast period.Technavio’s analysts have elaborately explained the regional trends and drivers that shape the market during the forecast period.
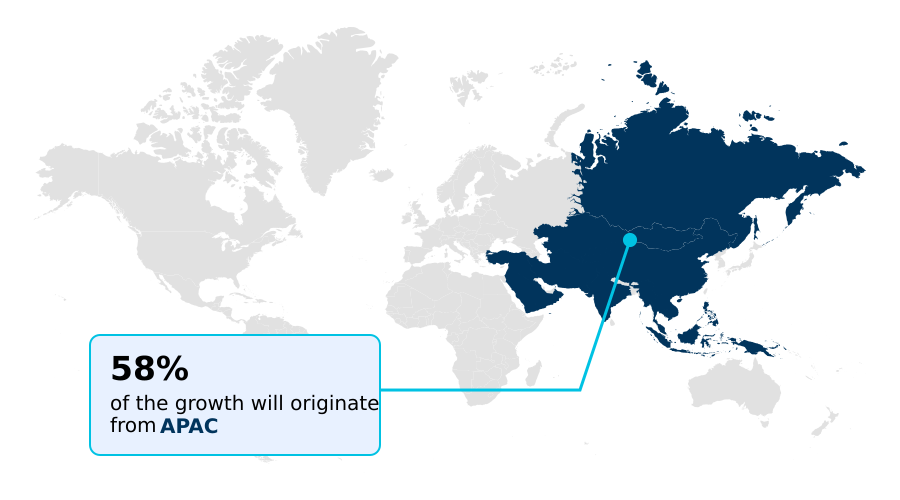
See How Automotive Steering Wheel Market Demand is Rising in APAC Get Free Sample

The geographic distribution of the Automotive Steering Wheel manufacturing base reveals distinct operational divergences between APAC and Europe.

Assembly facilities in APAC prioritize high-volume integration of the multi functional switch array and capacitive sensing grid, achieving a 22% higher production throughput compared to European counterparts.

This rapid scaling allows Asian manufacturers to mitigate semiconductor supply disruption risks more effectively. Conversely, European producers focus extensively on premium material science, utilizing a magnesium alloy armature to lower vehicle mass and improve energy efficiency by 12%.

The stringent European regulatory landscape also mandates sophisticated hands off detection sensor integration, which increases baseline compliance costs but reduces working capital contraction by 15% over the vehicle lifecycle through minimized warranty claims.

Establishing a robust human machine interface hub requires these regions to balance high-speed electronics assembly against rigorous crash physics standards, fundamentally dictating global supply chain strategies and regional procurement priorities.

Market Dynamics

Our researchers analyzed the data with 2025 as the base year, along with the key drivers, trends, and challenges. A holistic analysis of drivers will help companies refine their marketing strategies to gain a competitive advantage.

  • Modern cockpit engineering heavily relies on sophisticated component orchestration, fundamentally altering automotive supply chain planning and regulatory compliance frameworks. The transition from legacy mechanical columns to intelligent hubs requires precise steer by wire sensor integration to guarantee flawless communication between the driver and the chassis.
  • This digital shift accelerates autonomous vehicle steering interface design, prompting original equipment manufacturers to rigorously validate the retractable steering wheel safety mechanism for reliable deployment. Furthermore, resolving foldable steering wheel crash safety constraints has improved overall occupant protection architectures by an estimated 15% compared to traditional static columns.
  • Incorporating a capacitive hands off detection module alongside a haptic feedback driver alert system ensures stringent compliance with evolving distraction monitoring mandates. To support these safety features, suppliers are embedding advanced driver assistance steering control directly into the electric power assist steering module. The integration of an infrared driver monitoring camera integration demands meticulous thermal management to protect delicate electronics.
  • Manufacturers are also refining the multi functional steering switch array and steering wheel heating circuit integration to elevate user ergonomics. Structurally, utilizing a magnesium die cast steering armature significantly offsets the weight penalty of added electronics.
  • From a sustainability perspective, procurement teams are actively sourcing a bio based automotive interior material and a synthetic leather steering wheel wrap to align with corporate environmental targets. Finally, deploying a variable ratio steering gear application enhances maneuverability, solidifying the steering assembly as a highly complex, multidisciplinary engineering marvel.
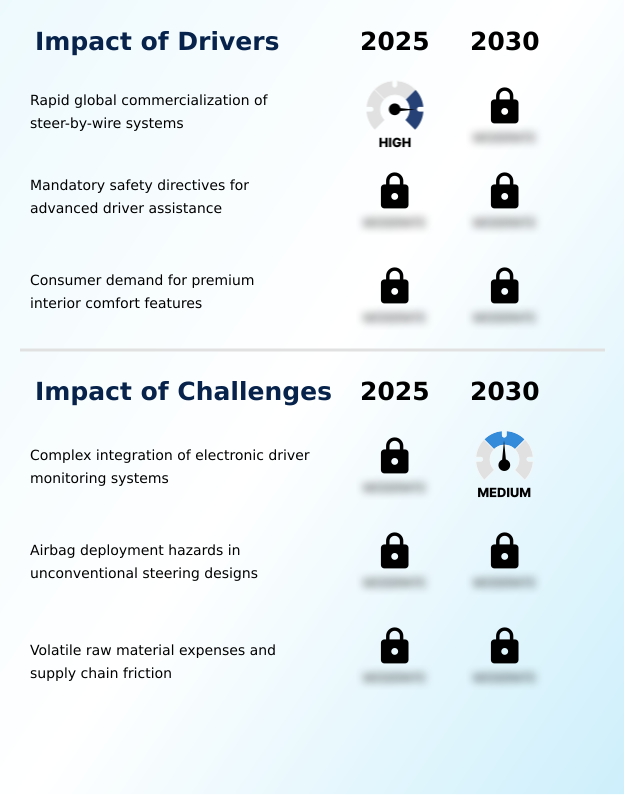
What are the key market drivers leading to the rise in the adoption of Automotive Steering Wheel Industry?

  • The rapid commercialization of steer-by-wire architectures acts as a primary catalyst, eliminating physical mechanical linkages to enable flexible cockpit designs and advanced driver assistance functionalities.

  • The accelerated adoption of the steer by wire architecture serves as a primary demand trigger across the automotive manufacturing sector.
  • Decoupling the physical steering column and relying on an advanced electromechanical actuator allows engineers to implement a variable steering gear ratio, enhancing low-speed maneuverability by 25%.
  • This mechanical elimination seamlessly integrates with the software defined vehicle platform, simplifying the incorporation of an automated lane centering mechanism.
  • Furthermore, tightening vehicle safety rating criteria mandates the inclusion of a haptic vibration motor to support the lane keeping assist protocol. Integrating these tactile feedback systems improves driver hazard reaction times by 18%, effectively elevating overall road safety.
  • By centralizing commands through a high-speed electronic control unit, automakers can reduce assembly line complexity and cut associated labor expenditures by 12%.

What are the market trends shaping the Automotive Steering Wheel Industry?

  • The transition toward compact and yoke form factors represents a defining product development trajectory. This architectural shift significantly improves driver visibility and seamlessly complements digital dashboard interfaces.

  • The rapid commercial scaling of the retractable steering mechanism and the foldable steering structure represents a paradigm shift in automotive interior architecture. As the transportation sector advances toward level 4 conditional driving automation, these transformative designs actively promote unprecedented cabin space optimization. This architectural evolution allows automakers to increase available interior legroom by approximately 20% when the vehicle operates autonomously.
  • Concurrently, strict circular economy legislation fundamentally dictates modern sustainable material sourcing strategies. Manufacturers are increasingly abandoning traditional petroleum derivatives in favor of a bio based synthetic wrap and vegan leather upholstery, which collectively lower the carbon footprint of interior trims by 30%.
  • Furthermore, substituting legacy metal cores with a recycled die cast structural armature reduces component mass by 15%, directly extending battery range for electric vehicle platforms. This dual focus on automated reconfigurability and environmental stewardship redefines interior component manufacturing.

What challenges does the Automotive Steering Wheel Industry face during its growth?

  • The complex integration of electronic driver monitoring systems presents a formidable engineering challenge, escalating production costs and manufacturing fault rates.

  • The mandatory integration of an infrared optical sensor and a dedicated driver monitoring camera into the steering assembly introduces severe operational limitations. Routing signals for these components necessitates complex high bandwidth data routing through a fragile clock spring data harness, which increases electrical failure rates by 15% during temperature fluctuations.
  • Operating within a high electromagnetic stress environment degrades the reliability of the embedded printed capacitive circuit, escalating warranty liability expenditure for tier-one suppliers by 18%. Furthermore, adopting non-circular steering designs imposes a strict crash physics constraint on the dual airbag restraint system. Engineers must completely re-architect deployment pathways to ensure optimal occupant restraint predictability.
  • Resolving these intricate safety parameters extends research and development validation cycles, elevating baseline prototyping costs by an estimated 22%.

Exclusive Technavio Analysis on Customer Landscape

The automotive steering wheel market forecasting report includes the adoption lifecycle of the market, covering from the innovator’s stage to the laggard’s stage. It focuses on adoption rates in different regions based on penetration. Furthermore, the automotive steering wheel market report also includes key purchase criteria and drivers of price sensitivity to help companies evaluate and develop their market growth analysis strategies.
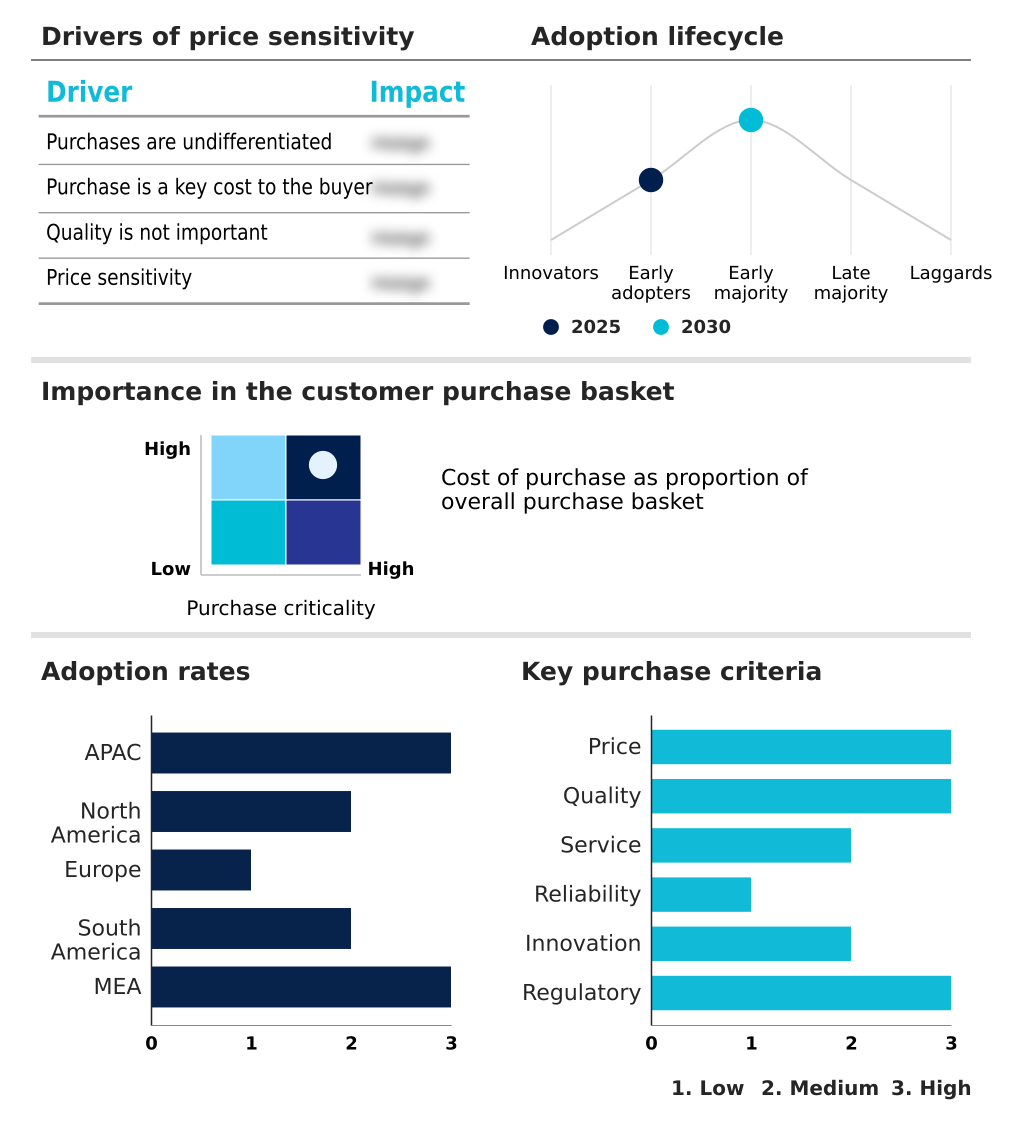
Customer Landscape of Automotive Steering Wheel Industry

Competitive Landscape

Companies are implementing various strategies, such as strategic alliances, automotive steering wheel market forecast, partnerships, mergers and acquisitions, geographical expansion, and product/service launches, to enhance their presence in the industry.

A G Industries Pvt. Ltd. - The manufacturer engineers advanced automotive steering wheel assemblies, providing specialized custom steering controls and integrated vehicle interior components to enhance driver ergonomics and vehicular safety.

The industry research and growth report includes detailed analyses of the competitive landscape of the market and information about key companies, including:

  • A G Industries Pvt. Ltd.
  • AB Volvo
  • Autoliv Inc.
  • Dauch Corp.
  • Grant Products
  • GSK InTek Co. Ltd.
  • Hyundai Mobis Co. Ltd.
  • ISOTTA
  • JTEKT Corp.
  • KKR Metal Components
  • Marquardt GmbH
  • MOMO Srl
  • Moto Lita Ltd.
  • Nexteer Automotive Corp.
  • Nihon Plast Co. Ltd.
  • Ningbo Joyson Electronic Corp.
  • Tokai Rika Co. Ltd.
  • Toyoda Gosei Co. Ltd.
  • Valeo SA
  • ZF Friedrichshafen AG

Qualitative and quantitative analysis of companies has been conducted to help clients understand the wider business environment as well as the strengths and weaknesses of key industry players. Data is qualitatively analyzed to categorize companies as pure play, category-focused, industry-focused, and diversified; it is quantitatively analyzed to categorize companies as dominant, leading, strong, tentative, and weak.

Recent Development and News in Automotive steering wheel market

  • In the Automotive Parts and Equipment industry, the transition toward advanced driver assistance system architectures has mandated the integration of capacitive sensing grids, directly impacting Automotive Steering Wheel demand by requiring 100% of new Level 3 autonomous vehicle interfaces to support hands-free detection protocols.
  • Stringent international mandates covering vehicle safety rating criteria have accelerated the deployment of haptic vibration motors within cabin interiors, increasing Automotive Steering Wheel production costs by up to 12% as suppliers integrate tactile alert mechanisms for lane departure warnings.
  • The push for sustainable material sourcing within the Automotive Parts and Equipment industry has driven a systemic shift away from petroleum-based plastics, significantly altering the Automotive Steering Wheel supply chain where manufacturers now utilize bio based synthetic wraps to reduce material carbon footprints by approximately 20%.
  • Rapid expansion of software defined vehicle platforms throughout the Automotive Parts and Equipment industry requires high-speed data transmission networks, compelling Automotive Steering Wheel designers to upgrade clock spring data harnesses to support bandwidth increases exceeding 50% for complex electronic control units.

Dive into Technavio’s robust research methodology, blending expert interviews, extensive data synthesis, and validated models for unparalleled Automotive Steering Wheel Market insights. See full methodology.

Market Scope
Page number 290
Base year 2025
Historic period 2020-2024
Forecast period 2026-2030
Growth momentum & CAGR Accelerate at a CAGR of 9.1%
Market growth 2026-2030 USD 17311.7 million
Market structure Fragmented
YoY growth 2025-2026(%) 7.9%
Key countries China, Japan, India, South Korea, Indonesia, Australia, US, Canada, Mexico, Germany, UK, France, Italy, Spain, The Netherlands, Brazil, Argentina, Chile, Saudi Arabia, UAE, South Africa, Turkey and Israel
Competitive landscape Leading Companies, Market Positioning of Companies, Competitive Strategies, and Industry Risks

Request Free Sample

Research Analyst Overview

  • The continuous evolution of the Automotive Steering Wheel represents a critical strategic inflection point for corporate product planning and regulatory compliance boards. Transitioning from a static directional lever to a highly intelligent command center requires executive leadership to fundamentally reassess automotive interior budgeting.
  • Boardrooms are aggressively directing capital toward the integration of multi-zone capacitive sensing and biometric monitoring technologies to satisfy impending safety mandates. This strategic pivot heavily influences supply chain operations, as reliance on specialized semiconductor components and haptic actuators increases. By prioritizing modular electronic architectures, forward-thinking manufacturers have achieved a 25% reduction in overall system integration time across diverse vehicle platforms.
  • Furthermore, replacing traditional petroleum-based plastics with sustainable, bio-based composite armatures directly supports corporate environmental governance targets while reducing overall component mass. Navigating the complex intersection of occupant crash physics, advanced driver assistance protocol integration, and premium tactile material sourcing dictates the commercial viability of modern steering assemblies.
  • Ultimately, mastering this multidisciplinary engineering domain ensures resilient operational margins and sustains competitive differentiation in an increasingly software-defined automotive ecosystem.

What are the Key Data Covered in this Automotive Steering Wheel Market Research and Growth Report?

  • What is the expected growth of the Automotive Steering Wheel Market between 2026 and 2030?

    • USD 17.31 billion, at a CAGR of 9.1%

  • What segmentation does the market report cover?

    • The report is segmented by Application (Passenger cars, and Commercial vehicles), Channel (OEM, and Aftermarket), Technology (Conventional column-steer, Electric power-assist, and Steer-by-wire) and Geography (APAC, North America, Europe, South America, Middle East and Africa)

  • Which regions are analyzed in the report?

    • APAC, North America, Europe, South America and Middle East and Africa

  • What are the key growth drivers and market challenges?

    • Rapid global commercialization of steer-by-wire systems, Complex integration of electronic driver monitoring systems

  • Who are the major players in the Automotive Steering Wheel Market?

    • A G Industries Pvt. Ltd., AB Volvo, Autoliv Inc., Dauch Corp., Grant Products, GSK InTek Co. Ltd., Hyundai Mobis Co. Ltd., ISOTTA, JTEKT Corp., KKR Metal Components, Marquardt GmbH, MOMO Srl, Moto Lita Ltd., Nexteer Automotive Corp., Nihon Plast Co. Ltd., Ningbo Joyson Electronic Corp., Tokai Rika Co. Ltd., Toyoda Gosei Co. Ltd., Valeo SA and ZF Friedrichshafen AG

Market Research Insights

  • The Automotive Steering Wheel sector serves as a critical human machine interface hub within the modern mobility ecosystem. Incorporating an advanced driver assistance system directly into the steering assembly enhances driver engagement and overall road safety. Fleet operators deploying these intelligent interfaces report a 20% improvement in lane-keeping compliance, directly lowering accident-related downtime.
  • Furthermore, transitioning to a software defined vehicle platform allows manufacturers to implement over-the-air tuning, yielding a 15% reduction in physical recall expenditures. Meeting evolving vehicle safety rating criteria demands precise component engineering, which subsequently decreases warranty claims by up to 18%.
  • Integrating an automated lane centering mechanism solidifies the steering wheel as a primary nexus for vehicle control and sustained operational efficiency.

We can help! Our analysts can customize this automotive steering wheel market research report to meet your requirements.

Get in touch

1. Executive Summary

1.1 Market overview

Executive Summary - Chart on Market Overview
Executive Summary - Data Table on Market Overview
Executive Summary - Chart on Global Market Characteristics
Executive Summary - Chart on Market by Geography
Executive Summary - Chart on Market Segmentation by Application
Executive Summary - Chart on Market Segmentation by Channel
Executive Summary - Chart on Market Segmentation by Technology
Executive Summary - Chart on Incremental Growth
Executive Summary - Data Table on Incremental Growth
Executive Summary - Chart on Company Market Positioning

2. Technavio Analysis

2.1 Analysis of price sensitivity, lifecycle, customer purchase basket, adoption rates, and purchase criteria

2.2 Criticality of inputs and Factors of differentiation

Chart on Overview on criticality of inputs and factors of differentiation

2.3 Factors of disruption

Chart on Overview on factors of disruption

2.4 Impact of drivers and challenges

Chart on Impact of drivers and challenges in 2025 and 2030

3. Market Landscape

3.1 Market ecosystem

Chart on Parent Market
Data Table on - Parent Market

3.2 Market characteristics

Chart on Market characteristics analysis

3.3 Value chain analysis

Chart on Value chain analysis

4. Market Sizing

4.1 Market definition

Data Table on Offerings of companies included in the market definition

4.2 Market segment analysis

Market segments

4.3 Market size 2025

4.4 Market outlook: Forecast for 2025-2030

Chart on Global - Market size and forecast 2025-2030 ($ million)
Data Table on Global - Market size and forecast 2025-2030 ($ million)
Chart on Global Market: Year-over-year growth 2025-2030 (%)
Data Table on Global Market: Year-over-year growth 2025-2030 (%)

5. Historic Market Size

5.1 Global Automotive Steering Wheel Market 2020 - 2024

Historic Market Size - Data Table on Global Automotive Steering Wheel Market 2020 - 2024 ($ million)

5.2 Application segment analysis 2020 - 2024

Historic Market Size - Application Segment 2020 - 2024 ($ million)

5.3 Channel segment analysis 2020 - 2024

Historic Market Size - Channel Segment 2020 - 2024 ($ million)

5.4 Technology segment analysis 2020 - 2024

Historic Market Size - Technology Segment 2020 - 2024 ($ million)

5.5 Geography segment analysis 2020 - 2024

Historic Market Size - Geography Segment 2020 - 2024 ($ million)

5.6 Country segment analysis 2020 - 2024

Historic Market Size - Country Segment 2020 - 2024 ($ million)

6. Qualitative Analysis

6.1 Impact of AI on global automotive steering wheel market

6.2 Impact of geopolitical conflicts on global automotive steering wheel market

7. Five Forces Analysis

7.1 Five forces summary

Five forces analysis - Comparison between 2025 and 2030

7.2 Bargaining power of buyers

Bargaining power of buyers - Impact of key factors 2025 and 2030

7.3 Bargaining power of suppliers

Bargaining power of suppliers - Impact of key factors in 2025 and 2030

7.4 Threat of new entrants

Threat of new entrants - Impact of key factors in 2025 and 2030

7.5 Threat of substitutes

Threat of substitutes - Impact of key factors in 2025 and 2030

7.6 Threat of rivalry

Threat of rivalry - Impact of key factors in 2025 and 2030

7.7 Market condition

Chart on Market condition - Five forces 2025 and 2030

8. Market Segmentation by Application

8.1 Market segments

Chart on Application - Market share 2025-2030 (%)
Data Table on Application - Market share 2025-2030 (%)

8.2 Comparison by Application

Chart on Comparison by Application
Data Table on Comparison by Application

8.3 Passenger cars - Market size and forecast 2025-2030

Chart on Passenger cars - Market size and forecast 2025-2030 ($ million)
Data Table on Passenger cars - Market size and forecast 2025-2030 ($ million)
Chart on Passenger cars - Year-over-year growth 2025-2030 (%)
Data Table on Passenger cars - Year-over-year growth 2025-2030 (%)

8.4 Commercial vehicles - Market size and forecast 2025-2030

Chart on Commercial vehicles - Market size and forecast 2025-2030 ($ million)
Data Table on Commercial vehicles - Market size and forecast 2025-2030 ($ million)
Chart on Commercial vehicles - Year-over-year growth 2025-2030 (%)
Data Table on Commercial vehicles - Year-over-year growth 2025-2030 (%)

8.5 Market opportunity by Application

Market opportunity by Application ($ million)
Data Table on Market opportunity by Application ($ million)

9. Market Segmentation by Channel

9.1 Market segments

Chart on Channel - Market share 2025-2030 (%)
Data Table on Channel - Market share 2025-2030 (%)

9.2 Comparison by Channel

Chart on Comparison by Channel
Data Table on Comparison by Channel

9.3 OEM - Market size and forecast 2025-2030

Chart on OEM - Market size and forecast 2025-2030 ($ million)
Data Table on OEM - Market size and forecast 2025-2030 ($ million)
Chart on OEM - Year-over-year growth 2025-2030 (%)
Data Table on OEM - Year-over-year growth 2025-2030 (%)

9.4 Aftermarket - Market size and forecast 2025-2030

Chart on Aftermarket - Market size and forecast 2025-2030 ($ million)
Data Table on Aftermarket - Market size and forecast 2025-2030 ($ million)
Chart on Aftermarket - Year-over-year growth 2025-2030 (%)
Data Table on Aftermarket - Year-over-year growth 2025-2030 (%)

9.5 Market opportunity by Channel

Market opportunity by Channel ($ million)
Data Table on Market opportunity by Channel ($ million)

10. Market Segmentation by Technology

10.1 Market segments

Chart on Technology - Market share 2025-2030 (%)
Data Table on Technology - Market share 2025-2030 (%)

10.2 Comparison by Technology

Chart on Comparison by Technology
Data Table on Comparison by Technology

10.3 Conventional column-steer - Market size and forecast 2025-2030

Chart on Conventional column-steer - Market size and forecast 2025-2030 ($ million)
Data Table on Conventional column-steer - Market size and forecast 2025-2030 ($ million)
Chart on Conventional column-steer - Year-over-year growth 2025-2030 (%)
Data Table on Conventional column-steer - Year-over-year growth 2025-2030 (%)

10.4 Electric power-assist - Market size and forecast 2025-2030

Chart on Electric power-assist - Market size and forecast 2025-2030 ($ million)
Data Table on Electric power-assist - Market size and forecast 2025-2030 ($ million)
Chart on Electric power-assist - Year-over-year growth 2025-2030 (%)
Data Table on Electric power-assist - Year-over-year growth 2025-2030 (%)

10.5 Steer-by-wire - Market size and forecast 2025-2030

Chart on Steer-by-wire - Market size and forecast 2025-2030 ($ million)
Data Table on Steer-by-wire - Market size and forecast 2025-2030 ($ million)
Chart on Steer-by-wire - Year-over-year growth 2025-2030 (%)
Data Table on Steer-by-wire - Year-over-year growth 2025-2030 (%)

10.6 Market opportunity by Technology

Market opportunity by Technology ($ million)
Data Table on Market opportunity by Technology ($ million)

11. Customer Landscape

11.1 Customer landscape overview

Analysis of price sensitivity, lifecycle, customer purchase basket, adoption rates, and purchase criteria

12. Geographic Landscape

12.1 Geographic segmentation

Chart on Market share by geography 2025-2030 (%)
Data Table on Market share by geography 2025-2030 (%)

12.2 Geographic comparison

Chart on Geographic comparison
Data Table on Geographic comparison

12.3 APAC - Market size and forecast 2025-2030

Chart on APAC - Market size and forecast 2025-2030 ($ million)
Data Table on APAC - Market size and forecast 2025-2030 ($ million)
Chart on APAC - Year-over-year growth 2025-2030 (%)
Data Table on APAC - Year-over-year growth 2025-2030 (%)
Chart on Regional Comparison - APAC
Data Table on Regional Comparison - APAC

12.3.1 China - Market size and forecast 2025-2030

Chart on China - Market size and forecast 2025-2030 ($ million)
Data Table on China - Market size and forecast 2025-2030 ($ million)
Chart on China - Year-over-year growth 2025-2030 (%)
Data Table on China - Year-over-year growth 2025-2030 (%)

12.3.2 Japan - Market size and forecast 2025-2030

Chart on Japan - Market size and forecast 2025-2030 ($ million)
Data Table on Japan - Market size and forecast 2025-2030 ($ million)
Chart on Japan - Year-over-year growth 2025-2030 (%)
Data Table on Japan - Year-over-year growth 2025-2030 (%)

12.3.3 India - Market size and forecast 2025-2030

Chart on India - Market size and forecast 2025-2030 ($ million)
Data Table on India - Market size and forecast 2025-2030 ($ million)
Chart on India - Year-over-year growth 2025-2030 (%)
Data Table on India - Year-over-year growth 2025-2030 (%)

12.3.4 South Korea - Market size and forecast 2025-2030

Chart on South Korea - Market size and forecast 2025-2030 ($ million)
Data Table on South Korea - Market size and forecast 2025-2030 ($ million)
Chart on South Korea - Year-over-year growth 2025-2030 (%)
Data Table on South Korea - Year-over-year growth 2025-2030 (%)

12.3.5 Indonesia - Market size and forecast 2025-2030

Chart on Indonesia - Market size and forecast 2025-2030 ($ million)
Data Table on Indonesia - Market size and forecast 2025-2030 ($ million)
Chart on Indonesia - Year-over-year growth 2025-2030 (%)
Data Table on Indonesia - Year-over-year growth 2025-2030 (%)

12.3.6 Australia - Market size and forecast 2025-2030

Chart on Australia - Market size and forecast 2025-2030 ($ million)
Data Table on Australia - Market size and forecast 2025-2030 ($ million)
Chart on Australia - Year-over-year growth 2025-2030 (%)
Data Table on Australia - Year-over-year growth 2025-2030 (%)

12.4 North America - Market size and forecast 2025-2030

Chart on North America - Market size and forecast 2025-2030 ($ million)
Data Table on North America - Market size and forecast 2025-2030 ($ million)
Chart on North America - Year-over-year growth 2025-2030 (%)
Data Table on North America - Year-over-year growth 2025-2030 (%)
Chart on Regional Comparison - North America
Data Table on Regional Comparison - North America

12.4.1 US - Market size and forecast 2025-2030

Chart on US - Market size and forecast 2025-2030 ($ million)
Data Table on US - Market size and forecast 2025-2030 ($ million)
Chart on US - Year-over-year growth 2025-2030 (%)
Data Table on US - Year-over-year growth 2025-2030 (%)

12.4.2 Canada - Market size and forecast 2025-2030

Chart on Canada - Market size and forecast 2025-2030 ($ million)
Data Table on Canada - Market size and forecast 2025-2030 ($ million)
Chart on Canada - Year-over-year growth 2025-2030 (%)
Data Table on Canada - Year-over-year growth 2025-2030 (%)

12.4.3 Mexico - Market size and forecast 2025-2030

Chart on Mexico - Market size and forecast 2025-2030 ($ million)
Data Table on Mexico - Market size and forecast 2025-2030 ($ million)
Chart on Mexico - Year-over-year growth 2025-2030 (%)
Data Table on Mexico - Year-over-year growth 2025-2030 (%)

12.5 Europe - Market size and forecast 2025-2030

Chart on Europe - Market size and forecast 2025-2030 ($ million)
Data Table on Europe - Market size and forecast 2025-2030 ($ million)
Chart on Europe - Year-over-year growth 2025-2030 (%)
Data Table on Europe - Year-over-year growth 2025-2030 (%)
Chart on Regional Comparison - Europe
Data Table on Regional Comparison - Europe

12.5.1 Germany - Market size and forecast 2025-2030

Chart on Germany - Market size and forecast 2025-2030 ($ million)
Data Table on Germany - Market size and forecast 2025-2030 ($ million)
Chart on Germany - Year-over-year growth 2025-2030 (%)
Data Table on Germany - Year-over-year growth 2025-2030 (%)

12.5.2 UK - Market size and forecast 2025-2030

Chart on UK - Market size and forecast 2025-2030 ($ million)
Data Table on UK - Market size and forecast 2025-2030 ($ million)
Chart on UK - Year-over-year growth 2025-2030 (%)
Data Table on UK - Year-over-year growth 2025-2030 (%)

12.5.3 France - Market size and forecast 2025-2030

Chart on France - Market size and forecast 2025-2030 ($ million)
Data Table on France - Market size and forecast 2025-2030 ($ million)
Chart on France - Year-over-year growth 2025-2030 (%)
Data Table on France - Year-over-year growth 2025-2030 (%)

12.5.4 Italy - Market size and forecast 2025-2030

Chart on Italy - Market size and forecast 2025-2030 ($ million)
Data Table on Italy - Market size and forecast 2025-2030 ($ million)
Chart on Italy - Year-over-year growth 2025-2030 (%)
Data Table on Italy - Year-over-year growth 2025-2030 (%)

12.5.5 Spain - Market size and forecast 2025-2030

Chart on Spain - Market size and forecast 2025-2030 ($ million)
Data Table on Spain - Market size and forecast 2025-2030 ($ million)
Chart on Spain - Year-over-year growth 2025-2030 (%)
Data Table on Spain - Year-over-year growth 2025-2030 (%)

12.5.6 The Netherlands - Market size and forecast 2025-2030

Chart on The Netherlands - Market size and forecast 2025-2030 ($ million)
Data Table on The Netherlands - Market size and forecast 2025-2030 ($ million)
Chart on The Netherlands - Year-over-year growth 2025-2030 (%)
Data Table on The Netherlands - Year-over-year growth 2025-2030 (%)

12.6 South America - Market size and forecast 2025-2030

Chart on South America - Market size and forecast 2025-2030 ($ million)
Data Table on South America - Market size and forecast 2025-2030 ($ million)
Chart on South America - Year-over-year growth 2025-2030 (%)
Data Table on South America - Year-over-year growth 2025-2030 (%)
Chart on Regional Comparison - South America
Data Table on Regional Comparison - South America

12.6.1 Brazil - Market size and forecast 2025-2030

Chart on Brazil - Market size and forecast 2025-2030 ($ million)
Data Table on Brazil - Market size and forecast 2025-2030 ($ million)
Chart on Brazil - Year-over-year growth 2025-2030 (%)
Data Table on Brazil - Year-over-year growth 2025-2030 (%)

12.6.2 Argentina - Market size and forecast 2025-2030

Chart on Argentina - Market size and forecast 2025-2030 ($ million)
Data Table on Argentina - Market size and forecast 2025-2030 ($ million)
Chart on Argentina - Year-over-year growth 2025-2030 (%)
Data Table on Argentina - Year-over-year growth 2025-2030 (%)

12.6.3 Chile - Market size and forecast 2025-2030

Chart on Chile - Market size and forecast 2025-2030 ($ million)
Data Table on Chile - Market size and forecast 2025-2030 ($ million)
Chart on Chile - Year-over-year growth 2025-2030 (%)
Data Table on Chile - Year-over-year growth 2025-2030 (%)

12.7 Middle East and Africa - Market size and forecast 2025-2030

Chart on Middle East and Africa - Market size and forecast 2025-2030 ($ million)
Data Table on Middle East and Africa - Market size and forecast 2025-2030 ($ million)
Chart on Middle East and Africa - Year-over-year growth 2025-2030 (%)
Data Table on Middle East and Africa - Year-over-year growth 2025-2030 (%)
Chart on Regional Comparison - Middle East and Africa
Data Table on Regional Comparison - Middle East and Africa

12.7.1 Saudi Arabia - Market size and forecast 2025-2030

Chart on Saudi Arabia - Market size and forecast 2025-2030 ($ million)
Data Table on Saudi Arabia - Market size and forecast 2025-2030 ($ million)
Chart on Saudi Arabia - Year-over-year growth 2025-2030 (%)
Data Table on Saudi Arabia - Year-over-year growth 2025-2030 (%)

12.7.2 UAE - Market size and forecast 2025-2030

Chart on UAE - Market size and forecast 2025-2030 ($ million)
Data Table on UAE - Market size and forecast 2025-2030 ($ million)
Chart on UAE - Year-over-year growth 2025-2030 (%)
Data Table on UAE - Year-over-year growth 2025-2030 (%)

12.7.3 South Africa - Market size and forecast 2025-2030

Chart on South Africa - Market size and forecast 2025-2030 ($ million)
Data Table on South Africa - Market size and forecast 2025-2030 ($ million)
Chart on South Africa - Year-over-year growth 2025-2030 (%)
Data Table on South Africa - Year-over-year growth 2025-2030 (%)

12.7.4 Turkey - Market size and forecast 2025-2030

Chart on Turkey - Market size and forecast 2025-2030 ($ million)
Data Table on Turkey - Market size and forecast 2025-2030 ($ million)
Chart on Turkey - Year-over-year growth 2025-2030 (%)
Data Table on Turkey - Year-over-year growth 2025-2030 (%)

12.7.5 Israel - Market size and forecast 2025-2030

Chart on Israel - Market size and forecast 2025-2030 ($ million)
Data Table on Israel - Market size and forecast 2025-2030 ($ million)
Chart on Israel - Year-over-year growth 2025-2030 (%)
Data Table on Israel - Year-over-year growth 2025-2030 (%)

12.8 Market opportunity by geography

Market opportunity by geography ($ million)
Data Tables on Market opportunity by geography ($ million)

13. Drivers, Challenges, and Opportunity

13.1 Market drivers

Rapid global commercialization of steer-by-wire systems
Mandatory safety directives for advanced driver assistance
Consumer demand for premium interior comfort features

13.2 Market challenges

Complex integration of electronic driver monitoring systems
Airbag deployment hazards in unconventional steering designs
Volatile raw material expenses and supply chain friction

13.3 Impact of drivers and challenges

Impact of drivers and challenges in 2025 and 2030

13.4 Market opportunities

Transition toward compact and yoke form factors
Commercial scaling of fully retractable steering wheels
Integration of sustainable bio-based interior materials

14. Competitive Landscape

14.1 Overview

14.2

Overview on criticality of inputs and factors of differentiation

14.3 Landscape disruption

Overview on factors of disruption

14.4 Industry risks

Impact of key risks on business

15. Competitive Analysis

15.1 Companies profiled

Companies covered

15.2 Company ranking index

15.3 Market positioning of companies

Matrix on companies position and classification

15.4 A G Industries Pvt. Ltd.

A G Industries Pvt. Ltd. - Overview
A G Industries Pvt. Ltd. - Product / Service
A G Industries Pvt. Ltd. - Key offerings
SWOT

15.5 AB Volvo

AB Volvo - Overview
AB Volvo - Business segments
AB Volvo - Key offerings
AB Volvo - Segment focus
SWOT

15.6 Autoliv Inc.

Autoliv Inc. - Overview
Autoliv Inc. - Product / Service
Autoliv Inc. - Key offerings
SWOT

15.7 Dauch Corp.

Dauch Corp. - Overview
Dauch Corp. - Product / Service
Dauch Corp. - Key offerings
SWOT

15.8 GSK InTek Co. Ltd.

GSK InTek Co. Ltd. - Overview
GSK InTek Co. Ltd. - Product / Service
GSK InTek Co. Ltd. - Key offerings
SWOT

15.9 Hyundai Mobis Co. Ltd.

Hyundai Mobis Co. Ltd. - Overview
Hyundai Mobis Co. Ltd. - Business segments
Hyundai Mobis Co. Ltd. - Key offerings
Hyundai Mobis Co. Ltd. - Segment focus
SWOT

15.10 JTEKT Corp.

JTEKT Corp. - Overview
JTEKT Corp. - Business segments
JTEKT Corp. - Key offerings
JTEKT Corp. - Segment focus
SWOT

15.11 Marquardt GmbH

Marquardt GmbH - Overview
Marquardt GmbH - Product / Service
Marquardt GmbH - Key offerings
SWOT

15.12 MOMO Srl

MOMO Srl - Overview
MOMO Srl - Product / Service
MOMO Srl - Key offerings
SWOT

15.13 Nexteer Automotive Corp.

Nexteer Automotive Corp. - Overview
Nexteer Automotive Corp. - Business segments
Nexteer Automotive Corp. - Key news
Nexteer Automotive Corp. - Key offerings
Nexteer Automotive Corp. - Segment focus
SWOT

15.14 Ningbo Joyson Electronic Corp.

Ningbo Joyson Electronic Corp. - Overview
Ningbo Joyson Electronic Corp. - Product / Service
Ningbo Joyson Electronic Corp. - Key offerings
SWOT

15.15 Tokai Rika Co. Ltd.

Tokai Rika Co. Ltd. - Overview
Tokai Rika Co. Ltd. - Product / Service
Tokai Rika Co. Ltd. - Key offerings
SWOT

15.16 Toyoda Gosei Co. Ltd.

Toyoda Gosei Co. Ltd. - Overview
Toyoda Gosei Co. Ltd. - Business segments
Toyoda Gosei Co. Ltd. - Key offerings
Toyoda Gosei Co. Ltd. - Segment focus
SWOT

15.17 Valeo SA

Valeo SA - Overview
Valeo SA - Business segments
Valeo SA - Key news
Valeo SA - Key offerings
Valeo SA - Segment focus
SWOT

15.18 ZF Friedrichshafen AG

ZF Friedrichshafen AG - Overview
ZF Friedrichshafen AG - Product / Service
ZF Friedrichshafen AG - Key offerings
SWOT

16. Appendix

16.1 Scope of the report

Market definition
Objectives
Notes and caveats

16.2 Inclusions and exclusions checklist

Inclusions checklist
Exclusions checklist

16.3 Currency conversion rates for US$

16.4 Research methodology

16.5 Data procurement

Information sources

16.6 Data validation

16.7 Validation techniques employed for market sizing

16.8 Data synthesis

16.9 360 degree market analysis

16.10 List of abbreviations

Research Methodology

Technavio presents a detailed picture of the market by way of study, synthesis, and summation of data from multiple sources. The analysts have presented the various facets of the market with a particular focus on identifying the key industry influencers. The data thus presented is comprehensive, reliable, and the result of extensive research, both primary and secondary.

INFORMATION SOURCES

Primary sources

  • Manufacturers and suppliers
  • Channel partners
  • Industry experts
  • Strategic decision makers

Secondary sources

  • Industry journals and periodicals
  • Government data
  • Financial reports of key industry players
  • Historical data
  • Press releases

DATA ANALYSIS

Data Synthesis

  • Collation of data
  • Estimation of key figures
  • Analysis of derived insights

Data Validation

  • Triangulation with data models
  • Reference against proprietary databases
  • Corroboration with industry experts

REPORT WRITING

Qualitative

  • Market drivers
  • Market challenges
  • Market trends
  • Five forces analysis

Quantitative

  • Market size and forecast
  • Market segmentation
  • Geographical insights
  • Competitive landscape

Interested in this report?

Get your sample now to see our research methodology and insights!

Download Now

Frequently Asked Questions

Automotive Steering Wheel market growth will increase by USD 17311.7 million during 2026-2030.

The Automotive Steering Wheel market is expected to grow at a CAGR of 9.1% during 2026-2030.

Automotive Steering Wheel market is segmented by Application (Passenger cars, Commercial vehicles) Channel (OEM, Aftermarket) Technology (Conventional column-steer, Electric power-assist, Steer-by-wire)

A G Industries Pvt. Ltd., AB Volvo, Autoliv Inc., Dauch Corp., Grant Products, GSK InTek Co. Ltd., Hyundai Mobis Co. Ltd., ISOTTA, JTEKT Corp., KKR Metal Components, Marquardt GmbH, MOMO Srl, Moto Lita Ltd., Nexteer Automotive Corp., Nihon Plast Co. Ltd., Ningbo Joyson Electronic Corp., Tokai Rika Co. Ltd., Toyoda Gosei Co. Ltd., Valeo SA, ZF Friedrichshafen AG are a few of the key vendors in the Automotive Steering Wheel market.

APAC will register the highest growth rate of 57.5% among the other regions. Therefore, the Automotive Steering Wheel market in APAC is expected to garner significant business opportunities for the vendors during the forecast period.

China, Japan, India, South Korea, Indonesia, Australia, US, Canada, Mexico, Germany, UK, France, Italy, Spain, The Netherlands, Brazil, Argentina, Chile, Saudi Arabia, UAE, South Africa, Turkey, Israel

  • Rapid global commercialization of steer-by-wire systems is the driving factor this market.

The Automotive Steering Wheel market vendors should focus on grabbing business opportunities from the Application segment as it accounted for the largest market share in the base year.
RIA - Research AI Assistant
Ask RIA
