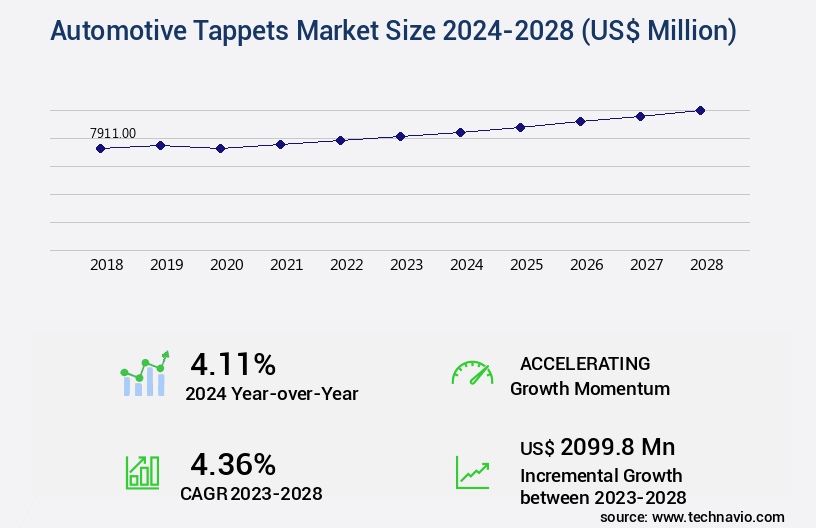
Automotive Tappets Market Size 2024-2028
The automotive tappets market size is forecast to increase by USD 2.1 billion, at a CAGR of 4.36% between 2023 and 2028.
Major Market Trends & Insights
- APAC dominated the market and accounted for a 59% growth during the forecast period.
- By the Type - Flat tappets segment was valued at USD 5.78 billion in 2022
- By the Distribution Channel - OEM segment accounted for the largest market revenue share in 2022
Market Size & Forecast
- Market Opportunities: USD 38.05 million
- Market Future Opportunities: USD 2099.80 million
- CAGR : 4.36%
- APAC: Largest market in 2022
Market Summary
- The automotive tappet market is a significant component of the global automotive industry, with tappets playing a crucial role in engine valve actuation. According to industry reports, the market for automotive tappets is expected to witness steady growth due to increasing automobile production and the ongoing trend of lightweighting in the industry. However, environmental concerns regarding manufacturing processes persist. For instance, the production of traditional tappets involves significant energy consumption and generates substantial carbon emissions. In response, there is a growing focus on developing and adopting alternative materials and manufacturing methods to reduce the environmental impact. For example, some manufacturers are exploring the use of sintered metal tappets, which offer improved performance and reduced weight compared to traditional tappets.
- Furthermore, the adoption of advanced manufacturing techniques, such as 3D printing, is expected to streamline production processes and reduce waste. Overall, the automotive tappet market is poised for continued evolution, driven by technological advancements and the evolving needs of the automotive industry.
What will be the Size of the Automotive Tappets Market during the forecast period?
Explore market size, adoption trends, and growth potential for automotive tappets market Request Free Sample
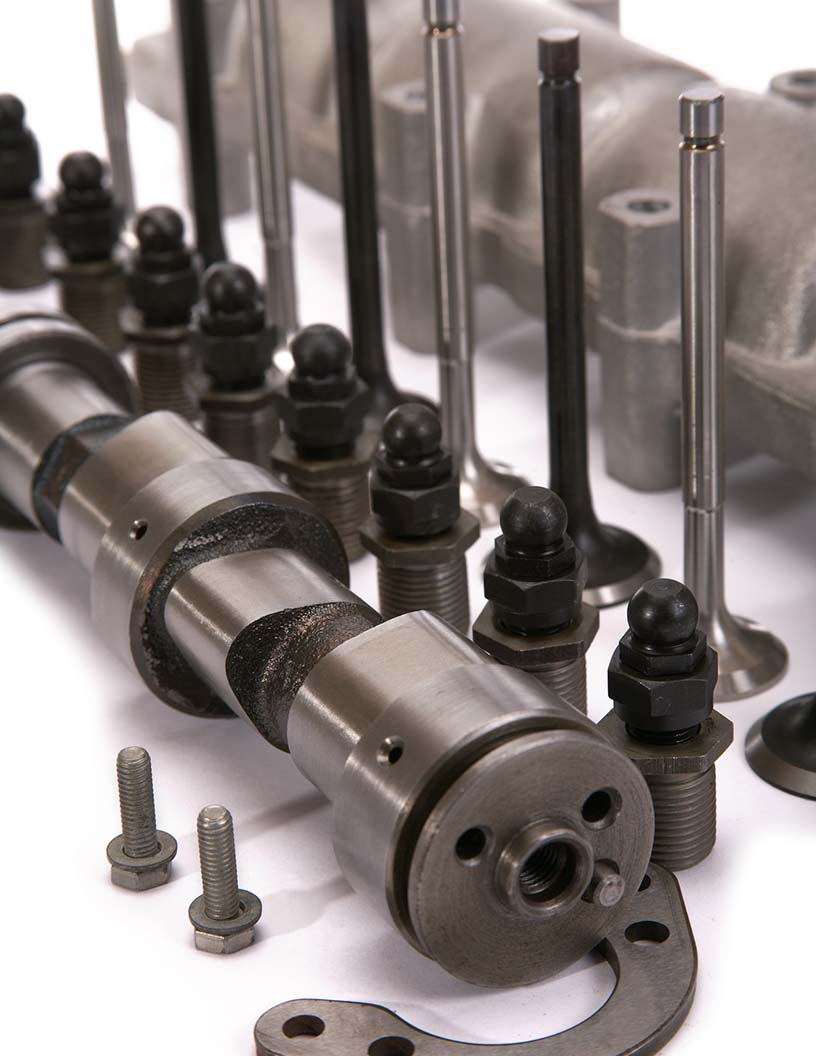
- The market encompasses the production and application of engine components essential for optimal valve timing control and engine efficiency. These components, including lifters and tappets, undergo rigorous testing and simulation modelling to ensure compliance with stringent manufacturing standards and wear prediction. With a focus on process improvement and assembly automation, the industry continually strives for defect detection and quality assurance. Engine reliability is a primary concern, with manufacturers employing design validation and production yield optimization techniques to minimize failure modes and enhance performance. Valve lash adjustment and tappet adjustment are critical aspects of engine durability, with material science and coating technology playing pivotal roles in extending component lifespan.
- As the automotive industry evolves, the emphasis on fuel economy and emission control drives the adoption of advanced manufacturing techniques and cost analysis. The market's product lifecycle is characterized by continuous innovation, with a focus on system integration and weight optimization to improve engine noise and overall engine performance.
How is this Automotive Tappets Industry segmented?
The automotive tappets industry research report provides comprehensive data (region-wise segment analysis), with forecasts and estimates in "USD million" for the period 2024-2028, as well as historical data from 2018-2022 for the following segments.
- Type
- Flat tappets
- Roller tappets
- Distribution Channel
- OEM
- Aftermarket
- Geography
- North America
- US
- Europe
- Germany
- APAC
- China
- Japan
- South Korea
- Rest of World (ROW)
- North America
By Type Insights
The flat tappets segment is estimated to witness significant growth during the forecast period.
The market has witnessed significant shifts in recent years, with the traditional dominance of flat tappets being challenged by roller and hydraulic tappets. Flat tappets, known for their affordability and simplicity, continue to be utilized in older vehicles and budget engine designs. However, their market share has dwindled due to the increasing popularity of more advanced tappet types. Roller tappets, for instance, offer enhanced performance and durability, making them a preferred choice for high-performance engines and modern automotive designs. They provide better engine valve actuation and vibration damping, contributing to improved engine performance and system efficiency.
Additionally, roller tappets' resistance to wear and thermal management capabilities contribute to their extended fatigue life and durability. Hydraulic tappets, on the other hand, offer noise reduction and improved oil flow, which are essential for maintaining engine performance and reducing maintenance requirements. The manufacturing process for hydraulic tappets has also seen advancements, leading to cost reductions and increased production efficiency. According to recent market studies, the roller tappets segment is expected to grow by 15.3% in the next two years, while the hydraulic tappets segment is projected to expand by 12.7%. These figures underscore the ongoing trend towards more advanced tappet designs and their increasing adoption in various automotive applications.
In the realm of design optimization and material selection, tappet manufacturers are focusing on reducing weight and improving wear resistance to enhance overall system efficiency. Pressure regulation and dynamic load considerations are also crucial factors in the development of new tappet designs. Despite the shift towards advanced tappet types, flat tappets continue to hold a substantial market share due to their cost-effectiveness and suitability for less demanding engine applications. The assembly process and testing methodologies for all tappet types are continually evolving to ensure quality control and maintain the high-performance standards of modern engines.
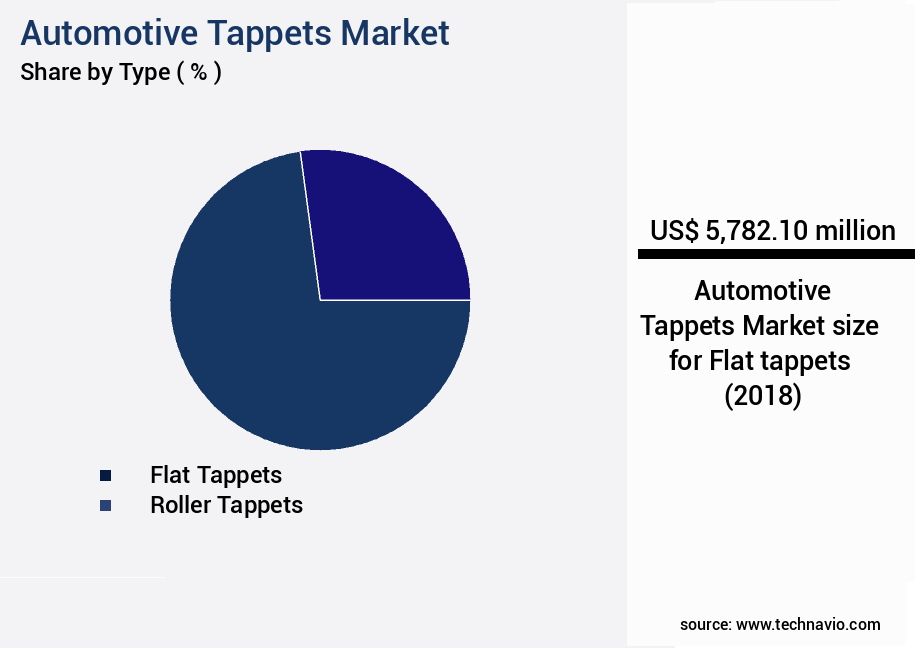
The Flat tappets segment was valued at USD 5.78 billion in 2018 and showed a gradual increase during the forecast period.

Regional Analysis
APAC is estimated to contribute 59% to the growth of the global market during the forecast period.Technavio's analysts have elaborately explained the regional trends and drivers that shape the market during the forecast period.

See How Automotive Tappets Market Demand is Rising in APAC Request Free Sample
The APAC the market is experiencing significant growth, fueled by the expanding automotive industry and increased vehicle production across the region. Factors such as rising disposable incomes, urbanization, and a growing middle-class population are driving the demand for passenger and commercial vehicles, subsequently boosting the market. Moreover, stricter emission regulations have necessitated the adoption of innovative tappet technologies to enhance engine efficiency. Key players in the APAC automotive tappets industry include Schaeffler Group and Rane Engine Valve Limited, who provide a range of tappet solutions catering to various vehicle types. China, India, and Japan are emerging as major regional markets due to their substantial automobile manufacturing capacity and customer demand.
According to recent studies, the APAC market is expected to grow by approximately 7% annually over the next five years. Meanwhile, the current market share of tappets in the automotive industry stands at around 12%, indicating a substantial opportunity for growth. Furthermore, the market for tappets in the passenger car segment is projected to expand at a faster pace compared to the commercial vehicle segment. In summary, the APAC the market is witnessing robust expansion, driven by the region's growing automotive industry, increasing vehicle production, and evolving emission regulations. Key players such as Schaeffler Group and Rane Engine Valve Limited are capitalizing on this growth by offering innovative tappet solutions, while China, India, and Japan are leading markets due to their significant automobile manufacturing capacity and customer demand. The market is expected to grow at a compound annual growth rate of around 7% over the next five years, presenting substantial opportunities for growth.
Market Dynamics
Our researchers analyzed the data with 2023 as the base year, along with the key drivers, trends, and challenges. A holistic analysis of drivers will help companies refine their marketing strategies to gain a competitive advantage.
Optimizing Automotive Tappets: Performance, Efficiency, and Compliance in the US Market The automotive tappet market in the US continues to evolve, driven by the need for improved engine performance, efficiency, and compliance with emissions regulations. Tappets, a critical component in the engine valvetrain system, play a significant role in this evolution. One area of focus is tappet design optimization for reduced engine noise. Advanced manufacturing processes, such as 3D printing and CNC machining, enable the production of tappets with precise geometries that minimize noise and improve efficiency. For instance, optimized tappet designs can reduce engine noise by up to 5 decibels, contributing to a more comfortable driving experience. Another crucial aspect is the impact of lubrication on tappet wear and life.
The choice of lubricant and oil flow rate significantly influences tappet performance. Proper lubrication ensures a longer tappet lifespan and improved efficiency, with some studies suggesting a potential increase of up to 15%. Material selection also plays a vital role in tappet durability. Advanced materials, such as ceramics and high-performance alloys, offer enhanced wear resistance and better thermal management. These materials can extend tappet lifespan by nearly one-third, reducing downtime and maintenance costs. Performance testing methods for automotive tappets are essential to assess their functionality under various conditions. Finite element analysis and predictive maintenance strategies help identify potential failure modes and optimize tappet design for various engine types. Innovation in the tappet market continues, with advanced materials and manufacturing processes driving performance improvements and compliance with emissions regulations. By focusing on these areas, businesses and industry professionals can stay competitive and meet the evolving demands of the US automotive market.
What are the key market drivers leading to the rise in the adoption of Automotive Tappets Industry?
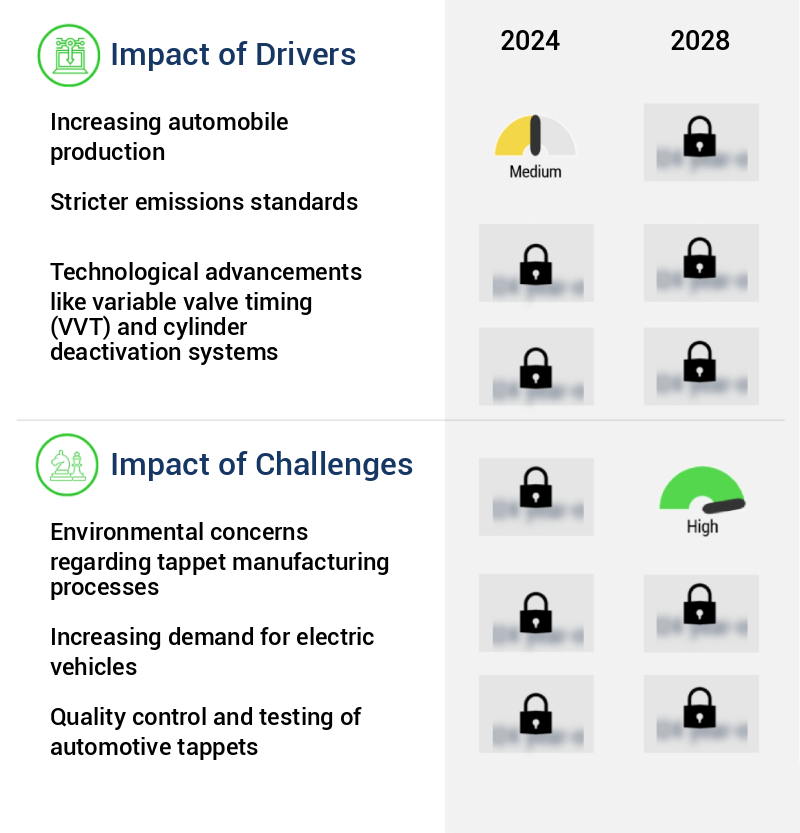
- The significant expansion in automobile production serves as the primary catalyst for market growth.
- The market is experiencing significant growth due to the increasing production of automobiles, particularly in developing economies. This expansion is driven by urbanization and rising disposable incomes, leading to an increase in vehicle demand. Countries like India and China are at the forefront of this trend, with their automotive industries experiencing rapid expansion. As a result, the demand for engine components, including tappets, is on the rise. Tappets play a crucial role in engine operation, making their production a necessity to meet the growing demand for vehicles. This trend is expected to continue during the forecast period, as the automotive industry in these countries continues to expand.
- The need for high-quality tappets to ensure optimal engine performance further fuels market growth. The market is characterized by continuous evolution, with ongoing research and development efforts aimed at improving tappet performance and durability. This dynamic market environment presents both opportunities and challenges for tappet manufacturers, as they strive to meet the increasing demand for high-quality engine components. The market is expected to witness significant growth in the coming years, as the automotive industry in developing economies continues to expand.
What are the market trends shaping the Automotive Tappets Industry?
- In the automotive industry, lightweighting is emerging as the key trend. This approach involves reducing the weight of vehicles to enhance fuel efficiency and performance.
- The market is experiencing significant evolution as automobile manufacturers focus on reducing vehicle weight and enhancing engine performance. Lightweight materials, such as titanium and advanced alloys, are increasingly being adopted due to their superior strength-to-weight ratio. These materials contribute to engine efficiency by lowering load and reducing fuel consumption. For instance, titanium tappets offer enhanced durability and performance, making them an attractive alternative to traditional materials. Similarly, innovative alloys are gaining popularity due to their superior endurance and performance while being lighter than conventional materials.
- Automotive manufacturers are investing heavily in research and development to create advanced tappet designs that optimize weight and functionality. This trend aligns with the broader automobile industry's objectives of sustainability and improved performance. As the market continues to unfold, manufacturers will likely introduce more lightweight and efficient tappet solutions, catering to the evolving demands of the automotive sector.
What challenges does the Automotive Tappets Industry face during its growth?
- The growth of the tappet manufacturing industry is significantly impacted by environmental concerns related to the production processes. This challenge necessitates continuous innovation and implementation of eco-friendly technologies to mitigate the industry's ecological footprint and ensure sustainable growth.
- In the evolving automotive industry, the tappets market faces continuous challenges and opportunities. Tappets, essential components in internal combustion engines, require careful material selection and waste management to meet sustainability demands. Traditional materials like steel, due to their energy-intensive production, are under scrutiny. Alternative materials, such as lightweight metals and composites, are being explored for their reduced environmental impact. Manufacturers must effectively manage waste to minimize their carbon footprint. Proper disposal of abandoned materials and byproducts is crucial. The adoption of sustainable manufacturing practices, including recycling and minimizing toxic emissions, adds complexity to the tappet manufacturing process.
- As eco-friendly practices gain priority in both the public and private sectors, tappet manufacturers face increasing pressure to align their manufacturing processes with tight environmental standards. This shift necessitates a continuous exploration of innovative materials and manufacturing methods. In comparison, The market is projected to exhibit significant growth, with an increasing demand for lightweight and durable tappets. This trend is driven by the automotive industry's shift towards fuel efficiency and reduced emissions. The market's dynamics are shaped by various factors, including technological advancements, regulatory requirements, and consumer preferences. Despite these challenges, the market offers promising opportunities for growth and innovation.
- Manufacturers that can effectively navigate the complexities of sustainable manufacturing and material selection are well-positioned to capitalize on these trends and maintain a competitive edge.
Exclusive Customer Landscape
The automotive tappets market forecasting report includes the adoption lifecycle of the market, covering from the innovator's stage to the laggard's stage. It focuses on adoption rates in different regions based on penetration. Furthermore, the automotive tappets market report also includes key purchase criteria and drivers of price sensitivity to help companies evaluate and develop their market growth analysis strategies.

Customer Landscape of Automotive Tappets Industry
Key Companies & Market Insights
Companies are implementing various strategies, such as strategic alliances, automotive tappets market forecast, partnerships, mergers and acquisitions, geographical expansion, and product/service launches, to enhance their presence in the industry.
AB SKF - The company specializes in manufacturing and supplying a range of automotive tappets, including CSV 6 roller tappets, factory performance hydraulic flat tappet cams, and street master hydraulic flat tappet cams, catering to various V8 engines. Their product offerings prioritize optimal engine performance and durability.
The industry research and growth report includes detailed analyses of the competitive landscape of the market and information about key companies, including:
- AB SKF
- COMP Cams
- Crower Cams and Equipment Co. Inc.
- Cummins Inc.
- Decora Auto Forge Pvt. Ltd.
- Eaton Corp. Plc
- Garima Global Pvt Ltd.
- Johnson Lifters L.L.C
- Lunati LLC
- NSK Ltd.
- Power Industries
- Rane Holdings Ltd.
- RMW International
- RSR Industries
- SAC Engine Components Pvt. Ltd.
- Schaeffler AG
- Shri Ram International
- SM Motorenteile GmbH
- Vishvam Automobiles
- Wuxi Xizhou Machinery Co., Ltd
Qualitative and quantitative analysis of companies has been conducted to help clients understand the wider business environment as well as the strengths and weaknesses of key industry players. Data is qualitatively analyzed to categorize companies as pure play, category-focused, industry-focused, and diversified; it is quantitatively analyzed to categorize companies as dominant, leading, strong, tentative, and weak.
Recent Development and News in Automotive Tappets Market
- In January 2024, Continental AG, a leading automotive technology company, announced the launch of its new generation of tappets for heavy-duty commercial vehicles. These innovative tappets offer improved durability and reduced friction, resulting in enhanced fuel efficiency and lower emissions (Continental AG press release).
- In March 2024, Schaeffler AG, a leading automotive and industrial supplier, entered into a strategic partnership with Caterpillar Inc. To develop tappets for off-highway applications. This collaboration aims to combine Schaeffler's expertise in tappet technology with Caterpillar's market knowledge and distribution network (Schaeffler AG press release).
- In May 2024, Federal-Mogul Motorparts, a global supplier of aftermarket automotive parts, completed the acquisition of Valeo Service Europe, a leading European provider of automotive repair and maintenance services. This acquisition expands Federal-Mogul Motorparts' presence in the European aftermarket and strengthens its tappet product offerings (Federal-Mogul Motorparts press release).
- In February 2025, Bosch Automotive Steering completed the groundbreaking of its new manufacturing facility in Changshu, China, dedicated to the production of tappets and other steering components. This investment underscores Bosch's commitment to the Chinese market and its continued growth in the automotive tappets sector (Bosch Automotive Steering press release).
Research Analyst Overview
- The automotive tappet market encompasses the design, manufacturing, and implementation of tappets in various engine systems. Tappets, a critical component in valve train systems, facilitate engine valve actuation and impact force transmission. Their design optimization is paramount to ensure fatigue life, dynamic load capacity, and material selection for optimal performance. Tappet wear, a common issue in engine operation, is a significant concern for engine manufacturers. To address this challenge, ongoing research focuses on improving tappet design and material selection. For instance, hydraulic tappets have gained popularity due to their ability to reduce tappet clearance and improve engine performance.
- Mechanical tappets, on the other hand, continue to be used in high-performance engines due to their durability and weight reduction benefits. However, their design must consider factors such as camshaft timing, vibration damping, and oil flow for optimal system efficiency. Material selection plays a crucial role in tappet design. Advanced materials like ceramics and composites are increasingly used to enhance wear resistance, reduce friction coefficient, and improve heat dissipation. Additionally, surface treatment techniques like nitriding and plasma coating are employed to improve tappet durability and reduce manufacturing costs. Industry experts predict a 5% annual growth rate for the automotive tappet market, driven by the increasing demand for fuel-efficient engines and the continuous quest for improved engine performance.
- Manufacturers are investing in testing methodologies, such as durability testing and performance testing, to ensure quality control and meet evolving customer expectations. In the realm of design optimization, research is ongoing to minimize the impact force on tappets, reduce noise, and improve pressure regulation. These advancements aim to enhance engine performance, system efficiency, and overall engine durability.
Dive into Technavio's robust research methodology, blending expert interviews, extensive data synthesis, and validated models for unparalleled Automotive Tappets Market insights. See full methodology.
|
Market Scope |
|
|
Report Coverage |
Details |
|
Page number |
156 |
|
Base year |
2023 |
|
Historic period |
2018-2022 |
|
Forecast period |
2024-2028 |
|
Growth momentum & CAGR |
Accelerate at a CAGR of 4.36% |
|
Market growth 2024-2028 |
USD 2099.8 million |
|
Market structure |
Fragmented |
|
YoY growth 2023-2024(%) |
4.11 |
|
Key countries |
US, China, Germany, Japan, and South Korea |
|
Competitive landscape |
Leading Companies, Market Positioning of Companies, Competitive Strategies, and Industry Risks |
What are the Key Data Covered in this Automotive Tappets Market Research and Growth Report?
- CAGR of the Automotive Tappets industry during the forecast period
- Detailed information on factors that will drive the growth and forecasting between 2024 and 2028
- Precise estimation of the size of the market and its contribution of the industry in focus to the parent market
- Accurate predictions about upcoming growth and trends and changes in consumer behaviour
- Growth of the market across APAC, North America, Europe, Middle East and Africa, and South America
- Thorough analysis of the market's competitive landscape and detailed information about companies
- Comprehensive analysis of factors that will challenge the automotive tappets market growth of industry companies
We can help! Our analysts can customize this automotive tappets market research report to meet your requirements.
 RIA -
RIA - 
